Showing posts with label clouds feedback. Show all posts

Wednesday, October 5, 2022

Methane keeps rising

WMO Report on Greenhouse Gases 

In 2020 and 2021, the global network of the World Meteorological Organization (WMO) detected the largest within-year increases (15 and 18 ppb, respectively) of atmospheric methane (CH₄) since systematic measurements began in the early 1980s. 

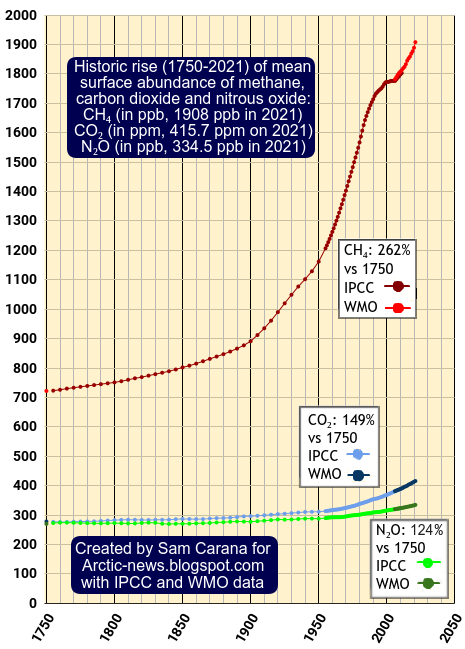
[ IPCC/WMO data through 2021 ]
The image on the right illustrates methane's rise, showing IPCC and, more recently, WMO data. Methane reached 1908 parts per billion (ppb) in 2021, 262% of the 1750 level, while carbon dioxide (CO₂) reached 415.7 parts per million (ppm) in 2021, 149% of the 1750 level, and nitrous oxide (N₂O) reached 334.5 ppb, 124% of the 1750 level. 

The WMO adds that analyses of measurements of the abundances of atmospheric CH₄ and its stable carbon isotope ratio ¹³C/¹²C (reported as δ¹³C(CH₄)) indicate that the increase in CH₄ since 2007 is associated with biogenic processes.

Methane's rise has been accelerating since 2007, which makes this a scary suggestion, as increasing decomposition of plant material as a result of climate change is a self-reinforcing feedback loop that is hard to stop.

Interestingly, a different explanation is pointed at in the 2019 analysis is shale gas a major driver of recent increase in global atmospheric methane?

Another explanation, discussed in an earlier post, is that there was a slowdown from 1984 to 2004 in the rise of methane as a result of rising temperatures increasing the water vapor in the atmosphere, resulting in more hydroxyl decomposing more methane in the atmosphere in the 1990s (compared to the 1980s). Accordingly, while the rise in methane concentration appeared to slow down over those years, methane emissions actually kept growing and continued to do so at accelerating pace, but since an increasingly large part of methane was decomposed by hydroxyl, this continuing rise in methane emissions was overlooked.

This could still mean that plant material is now getting decomposed at higher rates, but an even larger danger is that methane emissions started to increase more strongly from the early 2000s due in part to more methane eruptions from the seafloor of the Arctic Ocean. In other words, while hydroxyl kept increasing, seafloor methane emissions kept increasing even faster, to the extent that methane emissions increasingly started to overwhelm this growth in hydroxyl, resulting in a stronger rise in overall methane abundance in the atmosphere. 

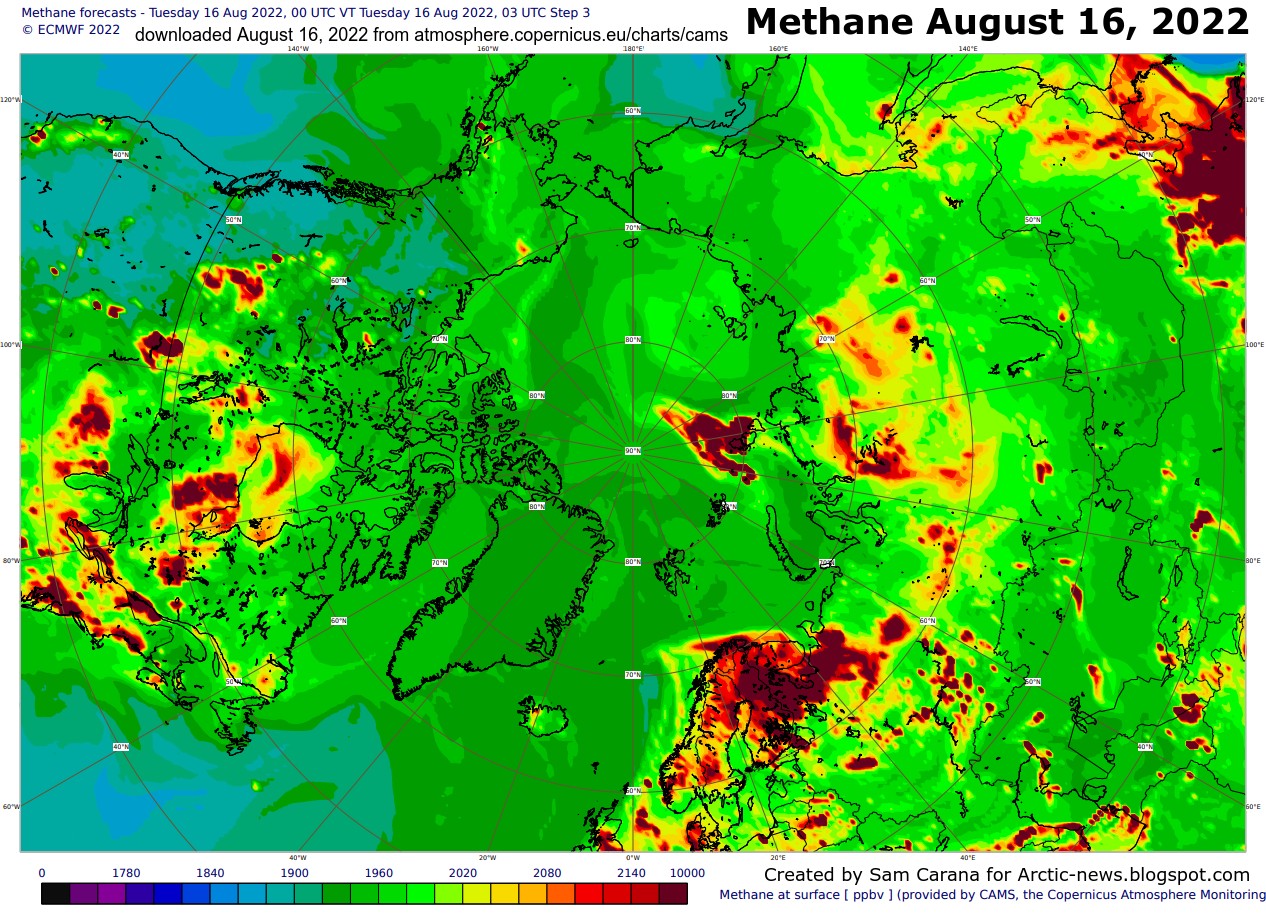
Sadly, there are few measurements available for methane that could erupt from the seafloor of the Arctic Ocean. Moreover, WMO and NOAA data that are used to calculate global means are typically taken at marine surface level, which may be appropriate for carbon dioxide that is present more strongly at sea surface level, but methane is much lighter and will rise quickly and accumulate at higher altitude, as indicated by the satellite images further below. Moreover, the lack of measurements of methane over the Arctic Ocean and at higher altitudes makes it hard to determine from where the methane originated. Much methane could originate from the seafloor of the Arctic Ocean and rise to the Tropopause, while moving from there closer to the Equator, all largely without getting reported.  

What's happening in 2022?

So, what's happening in 2022? Well, it appears that the rise in methane keeps accelerating, as illustrated by the image below showing daily average methane measurements at Mauna Loa, Hawaii, since 2001.

The image below shows methane in situ measurements at Barrow, Alaska, indicating that methane is present in even higher abundance over the Arctic and that levels are rising fast over the Arctic. 


The image below, adapted from Copernicus, shows a forecast for October 27, 2022, 03 UTC at 500 hPa. High levels of methane show up over the Arctic. 


The MetOp-B satellite recorded a mean methane level of 1981 ppb at 293 mb on October 2, 2022 am, while plenty of methane was present over the Arctic Ocean at the three altitudes shown on compilation image below.
The MetOp-B satellite recorded a peak methane level of 2901 ppb at 293 mb on October 20, 2022 am, while plenty of methane was again present over the Arctic Ocean at the three altitudes shown on the compilation image below.

This supports the possibility that large amounts of methane are getting released from the Arctic Ocean, with even more to follow.

While the IPCC keeps hiding the potential for a huge rise in temperature by 2026, as discussed in an earlier post, a recently-published article points out that prudent risk management requires consideration of bad-to-worst-case scenarios. 

How bad could it be? A 2016 analysis warned that there could be a temperature rise of more than 10°C from pre-industral by 2026. An additional danger is that, as methane keeps rising, the clouds tipping point could be crossed even earlier than in 2026. Let's re-evaluate these dangers. 

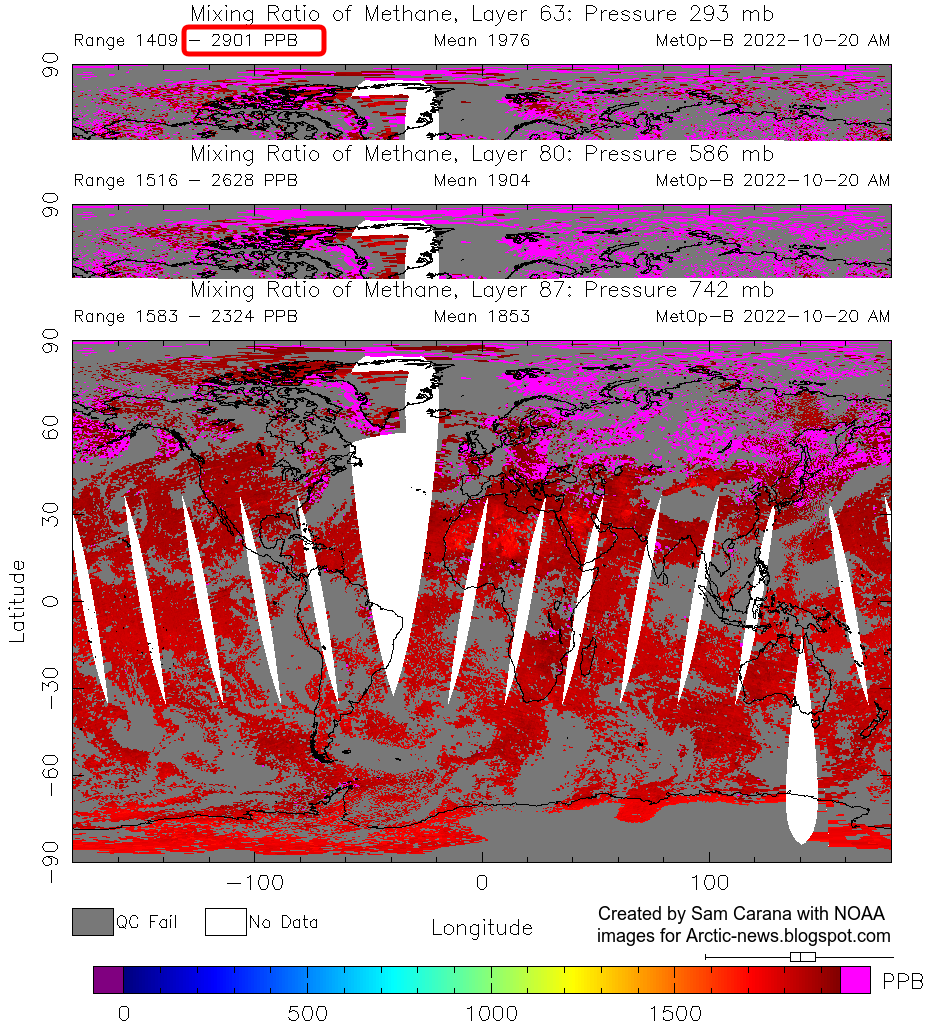
The above 1981 ppb mean methane level translates into 396.2 ppm CO₂e at a 1-year GWP of 200. Destabilization of sediments at the seafloor of the Arctic Ocean could cause a large abrupt burst of methane to enter the atmosphere over the Arctic Ocean. A doubling of the mean methane level could push up the mean methane level to twice as much, to 792.4 ppm CO₂e, which is only 407.6 ppm CO₂ away from the 1200 ppm CO₂e clouds tipping point that on its own could push up the temperature by some 8°C globally. This gap of 407.6 ppm CO₂ could be more than covered by the current carbon dioxide level. The September 2022 CO₂ level at Mauna Loa was higher than that, i.e. 415.96 ppm. Since the CO₂ level at Mauna Loa in September typically is at its lowest point for the year, this implies that a large abrupt burst of methane could cause the the clouds tipping point to be instantly crossed due to methane and CO₂ alone.

Note that there are additional forcers, such as CFCs, while there are also further events and developments that could additionally speed up the temperature rise, as further discussed below. The scary situation therefore is that the clouds tipping point could be instantly crossed with a burst of methane that is far smaller in size than the methane already in the atmosphere. Such a burst of methane could be released at any time, as discussed in earlier posts such as this one

[ from earlier post ]
That's not even the worst-case scenario. In the above calculation, global mean methane levels are used. However, there is a possibility that low-lying clouds could at first break up and vanish abruptly at one specific point, due to a high methane peak, and that this could lead to break-up of neighboring clouds, propagating break-up across the globe and thus pushing up the temperature rise virtually instantly by some 8°C globally.

The MetOp satellite recorded a peak methane level of 3644 ppb and a mean level of 1944 ppb at 367 mb on November 21, 2021, pm, as discussed in an earlier post. This 3644 ppb translates into 728.8 ppm CO₂e, again at a 1-year GWP of 200. This is 471.2 ppm CO₂e away from the clouds tipping point and that 471.2 ppm CO₂e could be covered by the carbon dioxide, nitrous oxide and CFCs currently in the atmosphere.

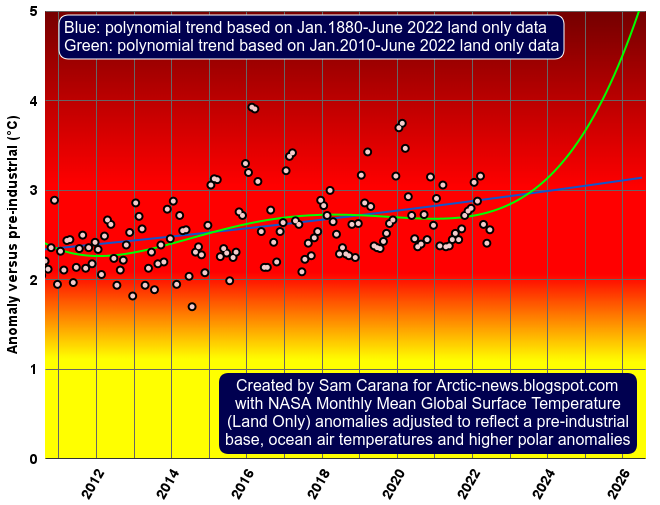
How high could the temperature rise be by 2026? 

There are a number of scenarios that could cause the clouds tipping point to be crossed soon, e.g. if the rise in methane kept following a trend as depicted in the image below, showing WMO 2015-2021 global annual surface mean methane abundance, with a trend added.

[ click on images to enlarge ]
The trend points at a potential mean global abundance of methane of more than 700 ppm CO₂e by the end of 2026, implying that when including further forcers the clouds tipping point could be crossed in 2026. Furthermore, the trend points at 1200 ppm CO₂e getting crossed in 2028 due to the forcing of methane alone. 

Even without such an increase in methane, a huge temperature rise could eventuate by 2026, first of all due to a cataclysmic alignment of El Niño and sunspots.

We are currently in the depths of a persistent La Niña, as illustrated by the image on the right, adapted from NOAA, and this suppresses the temperature rise at the moment.

The next El Niño is already overdue, so the peak of the next El Niño may well coincide with a peak in sunspots which look set to reach a higher than expected maximum impact around July 2025. The rise in sunspots from May 2020 to July 2025 could make a difference of some 0.15°C, concluded an earlier post.

Moving from the bottom of the current La Niña to the peak of a strong El Niño could make a difference of more than half a degree Celsius, as indicated by the image below, adapted from NOAA


Therefore, the rise due to the combined impact of El Niño and sunspots could be 0.65°C by 2025. When adding this to the temperature rise that has already occurred and that, when measured from pre-industrial could be as high as 2.29°C, the total land-ocean global temperature rise could be as high as 2.94°C by 2025,  while the rise on land on the Northern Hemisphere could peak at more than 3°C above pre-industrial, noting that when there was a strong El Niño in February 2016, the land-only monthly anomaly from 1880-1920 was 2.95°C, as illustrated by the image below. 

[ from earlier post ]
Such a huge rise could cause heatwaves and droughts that could result in a huge peak in power demand, as everyone switches on their air conditioners, while at the same time rivers could either dry up or their water could become too hot to cool power plants. This could bring the grid down, which would mean that coal-fired power plants would stop emitting sulfates.

[ from Track Buckling Research ]
This could mean that equipment and appliances that need electricity such as heaters and air conditioners could stop working. Electric pumps could stop working, so there may no longer be water coming out of taps. The internet could stop working where routers require power from the grid.

Furthermore, the heat could cause asphalt and tarmac to melt and rail tracks to buckle, while airports could be closed, not only because the surface of the runway could get too hot, but also because the air could become too thin for planes to take off due to the heat.

In short, traffic, transport and industrial activities such as smelting, which are emitting a lot of sulfates as well at the moment, could grind to a halt at many places on the Northern Hemisphere. The result would be a large reduction in aerosols that are currently masking the full wrath of global warming (mainly sulfates). 

[ see the Extinction page ]
How much difference could it make? The IPCC in AR6 estimates the aerosol ERF to be −1.3 W m⁻², adding that there has been an increase in the estimated magnitude of the total aerosol ERF relative to AR5. In AR6, the IPCC estimate for liquid water path (LWP, i.e., the vertically integrated cloud water) adjustment is 0.2 W m⁻², but a recent analysis found a forcing from LWP adjustment of −0.76 W m⁻², which would mean that the IPCC estimate of −1.3 W m⁻² should be changed to -2.26 W m⁻². When using a sensitivity of ¾°C per W m⁻², this translates into an impact of -1.695°C. Since the IPCC's total for aerosols includes a net positive impact for warming aerosols such as black carbon, the impact of cooling aerosols only (without warming aerosols) will be even more negative.

This supports the 2016 analysis that warned that by 2026 there could be a 1.9°C temperature rise due to a decrease in cooling aerosols, while there could be an additional 0.6°C temperature rise due to an increase in warming aerosols and gases as a result of more biomass and waste burning and forest fires by 2026.

So, together with the upcoming El Niño and a peak in sunspots, that could result in a total rise by 2026 of 5.44°C above pre-industrial. There's more to come! Additionally, the 2016 analysis warned about further rises in temperature due to loss of Arctic sea ice and permafrost, and associated changes, as well as further rises due to gases, concluding that there could be a temperature rise by 2026 of more than 10°C compared to pre-industrial.

With a temperature rise of more than 10°C by 2026, the clouds tipping point will also be crossed, which would result in a total rise of more than 18°C by 2026. Keep in mind that humans are likely to go extinct with a rise of 3°C, as illustrated by the image below, from an analysis discussed in an earlier post.


The situation is dire and the right thing to do now is to help avoid or delay the worst from happening, through action as described in the Climate Plan.


Links

• WMO - More bad news for the planet: greenhouse gas levels hit new highs 

• WMO - Greenhouse Gas Bulletin 
https://public.wmo.int/en/greenhouse-gas-bulletin

• Ideas and perspectives: is shale gas a major driver of recent increase in global atmospheric methane? - by Robert Howarth

• NOAA - Global Monitoring Laboratory
https://gml.noaa.gov/dv/iadv

• Copernicus methane at 500 hPa, forecast for October 18, 2022, 03 UTC
https://atmosphere.copernicus.eu/charts/cams/methane-forecasts?facets=undefined&time=2022101800,3,2022101803&projection=classical_global&layer_name=composition_ch4_500hpa

• What the IPCC impacts report is hiding
https://arctic-news.blogspot.com/2022/02/what-the-ipcc-impacts-report-is-hiding.html

• Climate Endgame: Exploring catastrophic climate change scenarios - by Luke Kemp et al.
https://www.pnas.org/doi/full/10.1073/pnas.2108146119

Also discussed at:
https://www.facebook.com/groups/arcticnews/posts/10160138721434679

• The Clouds Feedback and the Clouds Tipping Point
https://arctic-news.blogspot.com/p/clouds-feedback.html

• Arctic Ocean invaded by hot, salty water

• Sunspots
https://arctic-news.blogspot.com/p/sunspots.html

• NOAA National Centers for Environmental Information, State of the Climate: Monthly Global Climate Report for September 2022, retrieved October 16, 2022
https://www.ncei.noaa.gov/access/monitoring/monthly-report/global/202209/supplemental/page-4

• NOAA Climate Prediction Center - ENSO: Recent Evolution, Current Status and Predictions 
https://www.cpc.ncep.noaa.gov/products/analysis_monitoring/lanina/enso_evolution-status-fcsts-web.pdf

• Crossing 3C
https://arctic-news.blogspot.com/2022/09/crossing-3c.html

• Pre-industrial
https://arctic-news.blogspot.com/p/pre-industrial.html

• Track Buckling Research
https://www.volpe.dot.gov/infrastructure-systems-and-technology/structures-and-dynamics/track-buckling-research

• Invisible ship tracks show large cloud sensitivity to aerosol - by Peter Manhausen et al. 

• Extinction
https://arctic-news.blogspot.com/p/extinction.html


Wednesday, August 10, 2022

Arctic sea ice August 2022

Ocean currents keep pushing heat toward the Arctic Ocean

Arctic sea ice is getting very thin, as temperatures keep rising and ocean currents keep pushing heat toward the Arctic, as illustrated by the NOAA image below that shows sea surface temperatures as high as 33°C or 91.4°F on August 13, 2022. 


The Gulf Stream is an ocean current that extends into the Arctic Ocean, as pictured below and discussed at this page. This ocean current is driven by the Coriolis force and by prevailing wind patterns. 

[ from earlier post ]
This ocean current contributes to the stronger and accelerating warming of the Arctic (compared to the rest of the world), which in turn causes deformation of the Jet Stream that can at times cause strong winds to speed up this ocean current. The image below shows the Jet Stream over the North Atlantic, where the ocean current dives under the sea ice. Sea surface temperature anomalies are much lower over the area where the deformed Jet Stream causes water to evaporate, thus cooling the surface. 


The danger is that a cold freshwater lid grows at the surface of the North Atlantic that enables large amounts of salty, warm water to dive under the sea ice and enter the Arctic Ocean, as discussed earlier here, as well as here and at the feedbacks page


Latent heat

Latent heat is ocean heat that is, or rather was previously consumed by melting of the sea ice underneath the sea surface. 

[ The Latent Heat Buffer ]
This ice has meanwhile all but disappeared, so without this latent heat buffer further incoming heat must go elsewhere, i.e. the heat will further raise the temperature of the water and it will also cause more evaporation to take place where the sea ice has disappeared altogether, and this in turn will further heat up the atmosphere over the Arctic. 

The nullschool.net image below shows sea surface temperature anomalies from 1981-2011. At the green circle, anomalies were 16.1°C or 29°F on August 9, 2022. Back in 1981-2011, the temperature at that spot was 0°C. 


Thin layer of sea ice

The image below, adapted from University of Bremen, shows Arctic sea ice concentration on August 12, 2022, with concentration in a large area close to the North Pole as low as 0%.


The image below, from NSIDC, also shows sea ice concentration on August 9, 2022. 


The Naval Research Laboratory image below, a forecast for August 18, 2022, run on August 10, 2022, shows that the sea ice is getting very thin. 

Danger of methane eruptions

The navy.mil combination image below has three panels. The left panel shows the sea ice on August 30, 2012, the center panel shows the sea ice on August 30, 2015, and the right panel shows a forecast for the sea ice for August 21, 2022. 

[ click on images to enlarge ]
[ click on images to enlarge ]
There still is a relatively extensive but very thin layer of sea ice present at the surface. This is also illustrated by the NSIDC image on the right that shows an Arctic sea ice extent of 6.438 million km² on August 11, 2022. This relatively large extent is mainly due to the suppression of air temperatures that comes with the current La Niña (see images further below). 

As long as air temperatures are low enough to keep this surface ice frozen and as long as there are no strong winds pushing the ice out of the Arctic Ocean, this thin layer of ice will act as a seal, preventing transfer of heat from the Arctic Ocean to the atmosphere. 


The larger the remaining sea ice is in extent, the less ocean heat can be transferred from the Arctic Ocean to the atmosphere, which means that more heat will remain in the Arctic Ocean.

[ The Buffer has gone, feedback #14 on the Feedbacks page ]
The danger is that ocean heat keeps arriving in the Arctic Ocean, while the latent heat buffer is gone, causing more of this heat to reach sediments at the seafloor of the Arctic Ocean that threatens to destabilize hydrates in these sediment, resulting in methane eruptions both from these hydrates and from free gas underneath these hydrates.

Record high methane levels 

Methane levels are already at record high and growth is accelerating, even without an extra burst of seafloor methane.

NOAA registered a globally averaged marine surface April 2022 mean of 1909.9 ppb, which is 18.7 ppb higher than April 2021, as illustrated by the image on the right. By comparison, the highest annual growth on the NOAA record is 18.31 ppb for 2021. 

NOAA's data are for marine surface measurements.  More methane tends to accumulate at higher altitudes, as illustrated by the image on the right.

The MetOp satellite recorded a mean global methane level of 1971 ppb at 293 mb on August 11, 2022 am. When using a 1-year GWP of 200, this translates into 394.2 ppm CO₂e.

As the image underneath also shows, the MetOp satellite also recorded a peak methane level of 3009 ppb at 469 mb on August 9, 2022 pm. 

Record high carbon dioxide levels

Carbon dioxide (CO₂) levels have been quite high over the past few months. Monthly CO₂ was 420.99 ppm both in May and in June 2022. Some hourly CO₂ measurements were well above 422 ppm in May 2022. On May 28, 2022, one hourly average at Mauna Loa was recorded of 424 ppm.

When adding this monthly CO₂ concentration of 420.99 ppm to the above 394.2 ppm CO₂e for methane, that gives a total of 815.19 ppm CO₂e. 


Clouds feedback

Copernicus recorded high concentrations of methane over the Arctic Ocean on August 16, 2022 (forecast for 03 UTC run on 00 UTC). 

The image below shows methane at surface level, where the scale goes up to 10,000 ppb. At a 1-year global warming potential of 200, this top end of the scale translates into 2000 ppm CO₂e. 

[ click on images to enlarge ]
This 2000 ppm CO₂e is well above the 1200 ppm CO₂e clouds tipping point that will trigger the disappearance of the lower clouds. The presence of lower clouds and sea ice causes a lot of sunlight to be reflected back into space, so the danger is that at locations where these clouds and sea ice cover have both disappeared, the water of the Arctic Ocean will strongly heat up at this time of year.

What makes the situation in the Arctic very dangerous is that there is very little hydroxyl in the air over the Arctic to break down methane.

Furthermore, the Arctic Ocean in many places is very shallow, especially off the coast of Siberia, as illustrated by the NOAA image on the right. Shallow waters enable hot surface water to be mixed down all the way to the seafloor. 

[ click on images to enlarge ]
This threatens to trigger destabilization of methane hydrates contained in sediments at the seafloor and result in eruption of huge amounts of methane from such hydrates as well as from free gas contained in sediments underneath the hydrates, as illustrated by the image on the right, from this page.

Abrupt eruption of an additional 5 Gt of methane from the seafloor of the Arctic Ocean would double the methane in the atmosphere.  

An amount of 5 Gt of methane is only 10% of the 50 Gt that Natalia Shakhova et al. warned about long ago, while 50 Gt is in turn only a small fraction of all the methane contained in sediments in the Arctic, as illustrated by the image on the right, from Shakhova et al. (2019). 

On its own, a 5 Gt eruption of seafloor methane could raise the global mean methane concentration by as much as 1971 ppb which, at a 1-year GWP of 200, would translate into another 394.2 ppm CO₂e and when added to the above 815.19 ppm CO₂e, adds up to a total of 1209.39 ppm CO₂e.

[ from earlier post, click on images to enlarge ]
So, that would abruptly cause the joint CO₂e of just two greenhouse gases, i.e. methane and CO₂, to cross the 1200 ppm clouds tipping point globally and trigger a further 8°C global temperature rise, due to the clouds feedback alone.

There are further forcers and feedbacks to be taken into account, which means that the clouds tipping point could be crossed globally even with a far smaller abrupt release of seafloor methane. While it would take longer for the clouds tipping points to get crossed that way, the associated temperature rise could be enough to drive humans into extinctions well before the tipping point was even reached. A rise of 3°C above pre-industrial could occur on land and drive humans into extinction by 2025.

La Niña

[ adapted from NOAA - click on images to enlarge ]
As said, sea ice extent is relatively large at the moment, because we are currently in the depths of a persistent La Niña, which is suppressing the temperature rise.

El Niños typically occur every 3 to 5 years, according to NOAA and as also illustrated by the NOAA image below, so the upcoming El Niño can be expected to occur soon.

The NOAA image below indicates that going from the bottom of a La Niña to the peak of an El Niño could make a difference of more than half a degree Celsius (0.5°C or 0.9°F).


Furthermore, the rise in sunspots from May 2020 to July 2025 could make a difference of some 0.15°C (0.27°F). The next El Niño looks set to line up with a high peak in sunspots, in a cataclysmic alignment that could push up the temperature enough to cause even more dramatic sea ice loss in the Arctic, resulting in runaway temperature rise.

Conclusion

In conclusion, there is a growing risk that methane will erupt from the seafloor of the Arctic Ocean and cause a dramatic rise in temperature. 

Even without such eruption of methane from the seafloor of the Arctic Ocean, temperatures look set to rise strongly soon, as we move into an El Niño and face a peak in sunspots. The resulting temperature rise could drive humans extinct as early as in 2025 with temperatures continuing to skyrocket in 2026, making it in many respects rather futile to speculate about what will happen beyond 2026. 

At the same time, the right thing to do now is to help avoid the worst things from happening, through comprehensive and effective action as described in the Climate Plan.


Arctic sea ice (previous months)

• Arctic sea ice June 2022 - why the situation is so dangerous

• Arctic sea ice July 2022


Further links

• NOAA - Sea Surface Temperature (SST) Contour Charts
• Jet Stream
https://arctic-news.blogspot.com/p/jet-stream.html

• Cold freshwater lid on North Atlantic
https://arctic-news.blogspot.com/p/cold-freshwater-lid-on-north-atlantic.html

• NOAA - ENSO: Recent Evolution, Current Status and Predictions
https://www.cpc.ncep.noaa.gov/products/analysis_monitoring/lanina/enso_evolution-status-fcsts-web.pdf

• NOAA - Monthly Temperature Anomalies Versus El Niño
https://www.ncei.noaa.gov/access/monitoring/monthly-report/global/202207/supplemental/page-4

• University of Bremen
https://seaice.uni-bremen.de/databrowser

• NSIDC - Arctic sea ice concentration

• NSIDC - Chartic, interactive sea ice graph

• NOAA - Trends in Atmospheric Methane

• nullschool
https://earth.nullschool.net

• Naval Research Laboratory
https://www7320.nrlssc.navy.mil/GLBhycomcice1-12/arctic.html

• Understanding the Permafrost–Hydrate System and Associated Methane Releases in the East Siberian Arctic Shelf - by Natalia Shakhova et al. (2019) 
https://www.mdpi.com/2076-3263/9/6/251

• Warning of mass extinction of species, including humans, within one decade
• Cold freshwater lid on North Atlantic

• Albedo, latent heat, insolation and more
https://arctic-news.blogspot.com/p/albedo.html

• Latent Heat Buffer
https://arctic-news.blogspot.com/p/latent-heat.html

• Feedbacks in the Arctic
https://arctic-news.blogspot.com/p/feedbacks.html

• Clouds feedback
https://arctic-news.blogspot.com/p/clouds-feedback.html

• How much time is there left to act?


Wednesday, July 13, 2022

Human Extinction by 2025?

Most important metric

Kevin Trenberth et al. suggest in a recent article that Earth's energy imbalance, defined as the absorbed solar radiation minus the net outgoing longwave radiation, is arguably the most important metric related to climate change. Of the extra heat from Earth's energy imbalance, about 93% ends up in the ocean as increasing ocean heat content (see image below), 3% goes into melting ice, 4% goes into raising temperatures of land and melting permafrost, and less than 1% remains in the atmosphere. 


One could also argue that the most important metric related to climate change is the monthly mean surface temperatures on land, as illustrated by the image below that was created with a July 16, 2022 screenshot from NASA customized analysis plots and shows that the February 2016 (land only) anomaly from 1886-1915 was 2.94°C or 5.292°F. 


Land only anomalies are important. After all, most people live on land and humans will likely go extinct with a rise of 3°C above pre-industrial, as illustrated by the image below, from an analysis in earlier post.


Note that in the above plot, anomalies are measured versus 1886-1915, which isn't pre-industrial. The image raises questions as to what the temperature rise would look like when using a much earlier base, and how much temperatures could rise over the next few years.  

Potential for temperature rise on land

The image below shows land only surface temperature anomalies, similar to the above image but further adjusted by almost a degree to reflect a pre-industrial base, ocean air temperatures and higher polar anomalies, as discussed at the pre-industrial page.


The image features two trends. The blue trend is based on January 1880-June 2022 land only data and shows the potential for 3°C to be crossed on land and to drive humans into extinction by 2025. The green trend is based on January 2010-June 2022 land only data and shows the potential for 5°C to be crossed on land by 2026, which will likely drive most life on land into extinction. 

A temperature rise of 3°C would likely stop all activities by humans, including their emissions, yet temperatures could keep rising.

Could
 temperatures keep rising?

In the video below, Guy McPherson discusses Abrupt, Irreversible Climate Change to Cause Planetary Extinction.


Concentrations of greenhouse gases in the atmosphere constitute yet another important metric related to climate change. Carbon dioxide at Mauna Loa in June 2022 was 420.99 ppm, a joint record high with May 2022, as illustrated by the above image. Methane and nitrous oxide concentrations are also at record high since 1750, as illustrated by the image on the right, from an earlier post

Greenhouse gas concentrations this high are likely to keep adding ocean heat for some time, causing further melting of sea ice, etc.

All these metrics are important, including Earth's energy imbalance, concentrations of greenhouse gases in the atmosphere, and monthly land only surface temperature anomalies.

Greenhouse gases remain in the atmosphere for many years, so even if emissions by people's activities stop now, concentrations of greenhouse gases that have a long lifetime are unlikely to fall much over the next few years, while there would be additional emissions (such as carbon monoxide) from decomposing biomass, forest fires and waste fires globally that would also make it hard for concentrations of shorter-lived methane to fall, as also discussed here.

We're also moving into a new El Niño, as illustrated by the image on the right. The difference between the top of El Niño and the bottom of La Niña could be more than half a degree Celsius, as the NOAA image below shows. The upcoming El Niño may well coincide with a peak in sunspots in 2025, further pushing up temperatures, as also discussed in the post Cataclysmic Alignment, which also mentions a recent study that warns that the combined impact of aerosols and nitrogen fertilizers can contribute much more strongly than previously thought to the formation of cirrus clouds that contribute to global warming. 


The resulting heatwaves and fires could trigger massive blackouts and, as civilization grinds to a halt, this could cause much of the sulfate masking effect to fall away almost instantly, resulting in further acceleration of the temperature rise. 

All this looks set to contribute to keep temperatures rising for years to come, with the danger of increasing ocean temperatures to the point where there would be massive eruptions of seafloor methane that contribute to the clouds tipping point at 1200 ppm CO₂e to be crossed, which in itself would push up temperatures by a further 8°C and cause rapid extinction of most life on Earth, as this 2019 analysis and this and this more recent analyses warn.

[ from earlier post ]

The clouds tipping point could be crossed as a result of seafloor methane releases. There is potential for such releases, given the rising ocean heat and the vast amounts of methane present in vulnerable sediments at the seafloor of the Arctic Ocean, as discussed in posts such as this one. If methane concentrations would increase in line with the trend in the above mage, i.e. methane reaching 780 ppm CO₂e by 2028 using a 1-year GWP of 200, this plus a concentration of carbon dioxide of 420.99 ppm as in the image further above would suffice to cause the clouds tipping point to be crossed. When adding further forcers, this could happen even earlier.

[ click on images to enlarge ]
Altogether, the global temperature could rise by more than 18°C above pre-industrial within a few years, as also discussed at the Extinction page. Even the longer-term outlook doesn't look promising. A 2020 analysis by Jorgen Randers et al. points out that, even if all greenhouse gas emissions by people could stop immediately and even if the temperature anomaly could fall to 0.5°C above pre-industrial, greenhouse gas levels would start rising again after 2150 and keep rising for centuries to come, while, as discussed in an earlier post, a 2016 analysis by Ganapolski et al. suggests that even moderate anthropogenic cumulative carbon dioxide emissions would cause an absence of the snow and ice cover in the next Milankovitch cycle, so there would be no buffer at the next peak in insolation, and temperatures would continue to rise, making the absence of snow and ice a permanent loss for millennia to come.

Conclusion

In an earlier post, the following question was also discussed: Could temperatures keep rising? This post concludes that surface temperatures on land could rise strongly over the next few years and drive humans into extinction as early as in 2025. Temperatures could continue to rise afterwards and drive most life on Earth into extinction soon thereafter, making it the more important to do the right thing now and help avoid the worst from happening, through comprehensive and effective action as described in the Climate Plan.

Our duty to support local people's courts that administer local feebates 

The disregard for science and democracy by those in power has now become so apparent and appalling that we, the people, must agree that the best way forward is to institute Local People's Courts in which randomly-chosen residents administer local feebates, as a superior form of democracy and decision-making.

Elections do allow people to participate in decisions regarding their own lives and future, but elections only give people a single choice every few years between representatives who then take decisions of importance for them. While this can be regarded as a shallow form of democracy, it is now sufficiently clear that elections effectively remove people's participation in such decisions and deteriorate the outlook and future for people and the environment locally and globally.

Residents should participate in decisions regarding their own lives and environment by supporting Local People's Courts that administer local feebates, with fees added to the sales price of polluting products and to rates on degraded land, and with revenue of fees used to fund support for improvements, such as through rebates on cleaner products sold locally or rebates on local rates on improved land. Local People's Courts can best ensure that choices regarding percentages and eligibility of fees and rebates are science-based, while feebates leave the choice as to what to buy or sell to individuals.

[ image from earlier post ]


Links

• A perspective on climate change from Earth's energy imbalance - by Kevin Trenberth et al. 
https://iopscience.iop.org/article/10.1088/2752-5295/ac6f74

• Another Record: Ocean Warming Continues through 2021 despite La Niña Conditions - by Lijing Cheng et al. 
https://link.springer.com/article/10.1007/s00376-022-1461-3

• Improved Quantification of the Rate of Ocean Warming - by Lijing Cheng et al. 
https://journals.ametsoc.org/view/journals/clim/35/14/JCLI-D-21-0895.1.xml

• NASA - GISS Surface Temperature Analysis 


• An earth system model shows self-sustained thawing of permafrost even if all man-made GHG emissions stop in 2020 - by Jorgen Randers et al.
https://www.nature.com/articles/s41598-020-75481-z

• Could temperatures keep rising?

• Critical insolation–CO2 relation for diagnosing past and future glacial inception - by Andrey Ganapolski et al. (2016)
https://www.nature.com/articles/nature16494

• NOAA - Trends in Atmospheric Carbon Dioxide - Mauna Loa, Hawaii 
https://gml.noaa.gov/ccgg/trends/graph.html

• Will COP26 in Glasgow deliver?
• Impact of interannual and multidecadal trends on methane-climate feedbacks and sensitivity - by Chin-Hsien Cheng et al.
https://www.nature.com/articles/s41467-022-31345-w

• NOAA - ENSO: Recent Evolution, Current Status and Predictions
https://www.cpc.ncep.noaa.gov/products/analysis_monitoring/lanina/enso_evolution-status-fcsts-web.pdf

• NOAA - Monthly Temperature Anomalies Versus El Niño

• Cataclysmic Alignment 
https://arctic-news.blogspot.com/2022/06/cataclysmic-alignment.html

• Sunspots
https://arctic-news.blogspot.com/p/sunspots.html

• Methane rise is accelerating