Showing posts with label near term human extinction. Show all posts

Sunday, September 14, 2025

El Nino 2026, extinction?

El Niño-Southern Oscillation (ENSO) is a climate pattern that fluctuates from El Niño to La Niña conditions and back. El Niño raises temperatures, whereas La Niña suppresses temperatures. This year, there have been neutral to La Niña conditions, as illustrated by the image below, which also shows that over the past few months, there has been a zigzag pattern of rises and falls around the mean sea surface temperature in Niño 3.4, an area in the Pacific (inset) that is critical to the development of El Niño. 


    [ click on images to enlarge ]
On September 13, 2025, the temperature reached an anomaly in this area of -0.54°C versus 1991-2020, indicating that La Niña conditions are likely to dominate late 2025/early 2026. The inset on the above image shows the Niño 3.4 area and sea surface temperature anomalies versus 1991-2020 on that day.

The image on the right, adapted from NOAA, shows the ENSO outlook (CFSv2 ensemble mean, black dashed line) favoring La Niña late 2025/early 2026. 

[ image from earlier post ]
The image on the right, adapted from ECMWF, shows an ENSO forecast for developments in Niño3.4 through August 2026, indicating that the next El Niño may emerge early 2026 and grow in strength in the course of 2026.

Rising temperature in absence of El Niño

Critical is the temperature on land, which is after all where people live. The image below shows that in 2025, monthly temperature anomalies (from 1880-1920) on land have fallen from a high of +2.93°C in January 2025 to +1.45°C in July 2025, in line with the temperature suppression that comes with a move into La Niña. 


The anomaly was +2.93°C in January 2025, very close to +3°C. Note that when using a genuinely pre-industrial base, anomalies can be much higher than depicted in the above image. While anomalies have come down somewhat, the anomaly rose again to +1.82°C in August 2025, which could indicate that acceleration of the temperature rise is overwhelming the temperature suppression that comes with a move into La Niña. 

The sea surface temperature anomaly keeps rising, in particular from the latitudes of 30° and higher north, as illustrated by the image below. 


Adding to fears that the temperature rise is accelerating despite the absence of El Niño is the most recent rise of the global temperature anomaly. As illustrated by the image below, the global temperature anomaly versus 1991-2020 has risen strongly recently, from +0.21°C on July 4, 2025, to +0.83°C on September 20, 2025. 


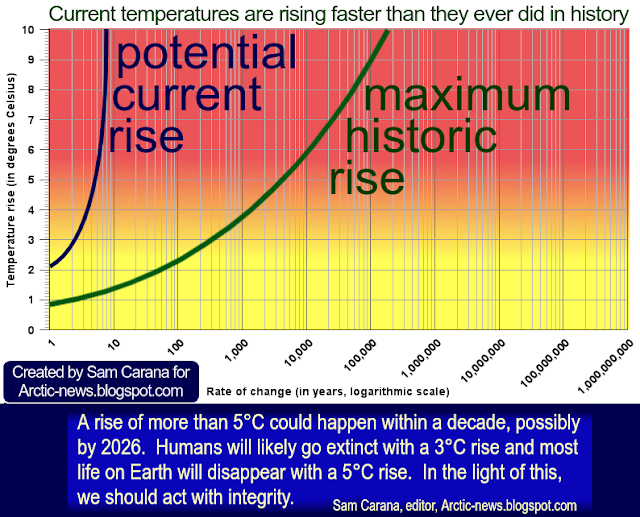
A +3°C temperature rise constitutes an important threshold, since humans will likely go extinct with such a rise, as illustrated by the image below. 
[ from the post When will humans go extinct? ]
   [ from: When Will We Die? ]
Recent research led by David Fastivich finds that, historically, vegetation responded at timescales from hundreds to tens of thousands of years, but not at timescales shorter than about 150 years. It takes centuries for tree populations to adapt - far too slow to keep pace with today’s rapidly warming world.

Note that healthy vegetation relies not only on temperature, but also on the presence of good soil, microbes, rain, soil nutrients, pollinators, habitat, groundwater and an absence of toxic waste, pests and diseases.

A 2018 study by Strona & Bradshaw indicates that most life on Earth will disappear with a 5°C rise (see box on the right). Humans, who depend on a lot of other species, will likely go extinct with a 3°C rise, as discussed in the earlier post When Will We Die?

The map below shows the size of the population rather than the size of the territory, decreasing the size of Canada, Mongolia, Australia, and Russia, and highlighting how many people are vulnerable to heat stress.

[ cartogram from Ourworldindata.org - click to enlarge ]

In the video below, Herb Simmens discussed the situation with Peter Carter and Paul Beckwith


Climate Emergency Declaration

The temperature rise is accelerating and the rise could accelerate even more due to decreases in buffers (as described in earlier posts such as this one), due to strengthening feedbacks, especially during an El Niño, and due to further reduction of the aerosol masking effect, which are all developments that could rapidly speed up existing feedbacks and trigger new feedbacks.

The situation is dire and the precautionary principle calls for rapid, comprehensive and effective action to reduce the damage and to improve the situation, as described in this 2022 post, where needed in combination with a Climate Emergency Declaration, as discussed at this group.


Links

• Climate Reanalyzer
https://climatereanalyzer.org

• NOAA - Climate Prediction Center - ENSO: Recent Evolution, Current Status and Predictions
https://www.cpc.ncep.noaa.gov/products/analysis_monitoring/lanina/enso_evolution-status-fcsts-web.pdf

• ECMWF - El Niño forecast
https://charts.ecmwf.int/products/seasonal_system5_nino_annual_plumes

• NASA - surface temperature analysis - gistemp 
https://data.giss.nasa.gov/gistemp

• When Will We Die?
https://arctic-news.blogspot.com/2019/06/when-will-we-die.html

• Population cartogram
https://ourworldindata.org/world-population-cartogram

Tuesday, May 18, 2021

Extinction by 2027

by Malcolm Light

The greatest threat to humanity on Earth is the escalating Arctic atmospheric methane buildup, caused by the destabilization of subsea methane hydrates. This subsea Arctic methane hydrate destabilization will go out of control in 2024 and lead to a catastrophic heatwave by 2026.

While the source region for this subsea methane is in Russian waters, the hot ocean current setting them off is the northern extension of the Gulf Stream - North Atlantic Drift, the “Svalbard Current”, which makes United States and Canadian atmospheric pollution guilty of this looming catastrophic Global Extinction event.


References

Extinction by 2027 - Post by Malcolm Light and comments 
https://www.facebook.com/malcolm.light.50/posts/4013328748745929

Anomalies of methane in the atmosphere over the East Siberian shelf: Is there any sign of methane leakage from shallow shelf hydrates? - by Shakhova, Semiletov, Salyuk and Kosmach (2008) 
http://www.cosis.net/abstracts/EGU2008/01526/EGU2008-A-01526.pdf

Max, M.D. & Lowrie, A. 1993. Natural gas hydrates: Arctic and Nordic Sea potential. In: Vorren, T.O., Bergsager, E., Dahl-Stamnes, A., Holter, E., Johansen, B., Lie, E. & Lund, T.B. Arctic Geology and Petroleum Potential, Proceedings of the Norwegian Petroleum Society Conference, 15-17 August 1990, Tromso, Norway. Norwegian Petroleum Society (NPF), Special Publication 2 Elsevier, Amsterdam, 27-53. 
https://www.elsevier.com/books/arctic-geology-and-petroleum-potential/vorren/978-0-444-88943-0

Lucy-Alamo Projects - Hydroxyl Generation and Atmospheric Methane Destruction 

Friday, January 17, 2020

Could Humans Go Extinct Within Years?


Above image depicts how humans could go extinct within years. The image was created with NASA LOTI 1880-Dec.2019 data, 0.78°C adjusted to reflect ocean air temperatures (as opposed to sea surface temperatures), to reflect higher polar temperature anomalies (as opposed to leaving out 'missing' data) and to reflect a 1750 baseline (as opposed to a 1951-1980 baseline), with two trends added. Blue: a long-term trend based on Jan.1880-Dec.2019 data. Red: a short-term trend, based on Jan.2009-Dec.2019 data, to illustrate El Niño/La Niña variability and how El Niño could be the catalyst to trigger huge methane releases from the Arctic Ocean. This updates an earlier post with more detail on how the image was created.

The image below shows El Niño/La Niña variability going back to 1950, added to the NOAA monthly temperature anomaly.
[ click on images to enlarge ]

The image on the right shows how ocean heat has increased over the years (from: from the paper Record-Setting Ocean Warmth Continued in 2019, by Lijing Chang et al.).

Ocean heat is increasing rapidly, especially on the Northern Hemisphere, as illustrated by the NOAA image below, showing the rise from 1980 through 2019.

The image underneath uses the same data and has a trend added pointing at a 1.5°C anomaly from the 20th century average by the year 2026.

As discussed in an earlier point, there is a tipping point at 1°C above the 20th century average, i.e. there are indications that a rise of 1°C will result in most of the sea ice underneath the surface to disappear. This sea ice used to consume the inflow of warm, salty water from the Atlantic Ocean and the Pacific Ocean. So, while there may still be sea ice left at the surface, the latent heat buffer will be gone.
[ click on images to enlarge ]
Loss of the latent heat buffer speeds up heating of the Arctic Ocean, with the danger that huge amounts of methane will be released from the seafloor. The image below illustrates the danger, showing that peak methane levels as high as 2670 parts per billion (ppb) were recorded by the MetOp-1 satellite on January 2, 2020 pm at 469 mb.


Most worryingly, above image shows a large almost-solidly magenta-colored area blanketing the East Siberian Arctic Shelf (ESAS), with magenta indicating levels above 1950 ppb. Such satellite measurements indicate that large amounts of methane are erupting from the seafloor of the Arctic Ocean.


Above image shows that, a few years ago, methane was accumulating most strongly at an altitude corresponding to a pressure of some 400 mb. More recently, methane has been accumulating most strongly at higher altitudes, corresponding to a pressure of just under 300 mb, which is the upper limit of the troposphere over the North Pole. Methane tends to follow the Tropopause, i.e. at higher altitudes methane will be present in higher concentrations closer to the Equator, where the troposphere extends further into space, as discussed in an earlier post.

The NOAA graph below indicates that methane levels are growing at over 10 parts per billion per year, and this may actually underestimate global methane concentrations. The graph uses land-based measurements taken at sea level that can miss methane rising from the seafloor, especially from the seafloor of the Arctic Ocean, since there are few measuring stations in the Arctic in the first place. Land-based measurements can additionally overlook methane that is moving along the Tropopause from the Arctic toward the Equator.

Ominously, the image below shows high methane levels at Barrow, Alaska, at the end of January 2020.


Rising CO₂ levels are also worrying. A daily average CO₂ level of 415.79 ppm was recorded by NOAA at Mauna Loa, Hawaii, on January 21, 2020, a level that is unprecedented for millions of years. Since an annual peak is typically reached in May, we can expect even higher levels over the coming months.


It's not just at Mauna Loa that such high CO₂ readings were recorded recently. The image below shows CO₂ levels recorded recent;y at Barrow, Alaska.


Fires in Australia have contributed to these high CO₂ levels. The image below shows smoke plumes from fires in Australia on January 4, 2020.


Such fires can generate huge amounts of smoke, with smoke rising up high in the atmosphere and entering the stratosphere, while circumnavigating Earth. The ferocity of these fires is also shown in the NASA video below.


In the video below, Guy McPherson gives examples of species that went extinct rapidly.


Meanwhile, the Bulletin of the Atomic Scientists has moved the Doomsday Clock closer to Midnight, to 100 seconds to Midnight, adding that Civilization-ending nuclear war—whether started by design, blunder, or simple miscommunication—is a genuine possibility. Climate change that could devastate the planet is undeniably happening. And for a variety of reasons that include a corrupted and manipulated media environment, democratic governments and other institutions that should be working to address these threats have failed to rise to the challenge. Faced with a daunting threat landscape and a new willingness of political leaders to reject the negotiations and institutions that can protect civilization over the long term, the Bulletin of the Atomic Scientists Science and Security Board moved the Doomsday Clock 20 seconds closer to midnight—closer to apocalypse than ever. 

The image below, created with thebulletin.org content and data from 1991 to 2020, has a linear trend added that points at Midnight by 2022.


The situation is dire and calls for immediate, comprehensive and effective action, as described in the Climate Plan.


Links

• Extinction in 2020?
https://arctic-news.blogspot.com/2019/12/extinction-in-2020.html

• NOAA Global Climate Report - Annual 2019 - Monthly temperature anomalies versus El Niño
https://www.ncdc.noaa.gov/sotc/global/201913/supplemental/page-2

• Record-Setting Ocean Warmth Continued in 2019 - by Lijing Chang et al.
https://link.springer.com/article/10.1007/s00376-020-9283-7

• 2020 El Nino could start 18°C temperature rise
https://arctic-news.blogspot.com/2019/11/2020-el-nino-could-start-18-degree-temperature-rise.html

• Near-Term Human Extinction
http://arctic-news.blogspot.com/2014/04/near-term-human-extinction.html

• NOAA Global CH4 Monthly Means
https://www.esrl.noaa.gov/gmd/ccgg/trends_ch4

• Methane Erupting From Arctic Ocean Seafloor
http://arctic-news.blogspot.com/2017/03/methane-erupting-from-arctic-ocean-seafloor.html

• NASA: Global Transport of Smoke from Australian Bushfires
https://gmao.gsfc.nasa.gov/research/science_snapshots/2020/Australia_fires_smoke.php

• NASA: Global Transport of Australian Bushfire Smoke
https://climate.nasa.gov/climate_resources/202/global-transport-of-australian-bushfire-smoke

• Bulletin of the Atomic Scientists
https://thebulletin.org/doomsday-clock/past-statements/

• Doomsday by 2021?
https://arctic-news.blogspot.com/2018/11/doomsday-by-2021.html

• Climate Plan
https://arctic-news.blogspot.com/p/climateplan.html


Thursday, March 6, 2014

Presentation by Guy McPherson

Presentation by Guy McPherson, February 2014, Traditions Cafe, Olympia WA.


View the video of the presentation below: