Showing posts with label water vapor. Show all posts

Tuesday, June 30, 2026

Water Vapor Worries

The Ozone Layer

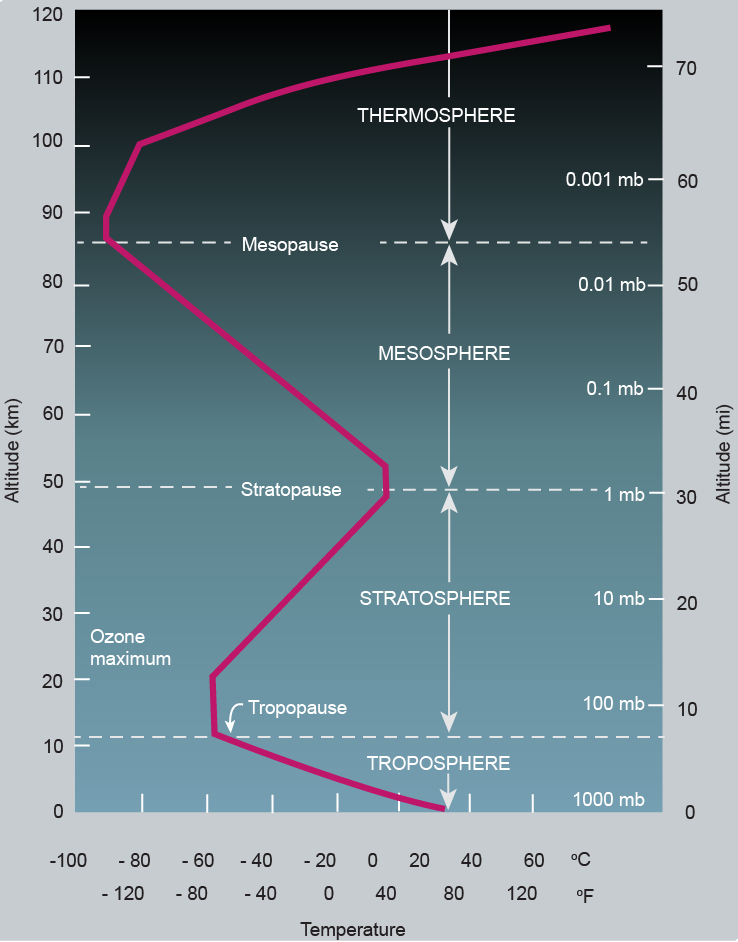
[CC image, credit: nptel.ac.in ]
The Atmosphere can be divided into layers. The Troposphere is the layer that is closest to the surface. When rising up in the Atmosphere, the next layer up is the Stratosphere. The next layer up is the Mesosphere and the fourth layer from the bottom is the Thermosphere.

The temperature rises or falls in a different way in each of these layers, as illustrated by the red line in the image CC from archive.nptel.ac.in on the right and the scale on the bottom.

The ozone layer is located in the lower stratosphere at an altitude of 15 to 35 km or 9 to 22 miles above the Earth's surface, with the highest concentrations usually peaking around 25 km. This altitude corresponds with a pressure level of 100 to 10 mb or hPa.

The ozone layer absorbs 97% to 99% of the Sun's medium-frequency ultraviolet light (from about 200 nm to 315 nm wavelength), which otherwise could cause severe damage to life on Earth.

Water vapor rising over Antarctica

The image below shows a temperature anomaly forecast for July 3, 2026. At this time of year very little sunlight is reaching Antarctica, so the temperature over Antarctica can get very low. At the same time, global warming has increased sea surface temperatures and this also keeps air temperatures over water relatively warm. The difference in temperature strengthens wind patterns from the Southern Ocean to Antarctica, which can lead to atmospheric rivers moving toward Antarctica, carrying water vapor and heat from the Southern Ocean to Antarctica.


The red color on the above image indicates high temperature anomalies over Antarctica. The dark blue areas indicate where snow has fallen over the sea ice around Antarctica and over the interior of Antarctica. 


As temperatures rise, the water vapor in the air increases. The amount of water vapor that the air can hold rises by 7% for each 1°C temperature rise (Clausius-Clapeyron relation). While much of the water vapor will fall out of the air as precipitation, in the form of rain or snow, some of the water vapor will remain in the air. This extra water vapor increases temperatures, since water vapor is a strong greenhouse gas. The IPCC adds: Water vapor feedback acting alone approximately doubles the warming from what it would be for fixed water vapor. Furthermore, water vapor feedback acts to amplify other feedbacks in models, such as cloud feedback and ice albedo feedback. If cloud feedback is strongly positive, the water vapor feedback can lead to 3.5 times as much warming as would be the case if water vapor concentration were held fixed.

Part of the precipitation will fall over Antarctica in the form of snow, thickening the snow cover there, without returning to the surface of the Southern Ocean. The net result is that the salinity of the Southern Ocean surface increases, facilitating increased melting of Antarctic sea ice, further speeding up the temperature rise, as also discussed in earlier posts such as this one.

The threat is further illustrated by the image below, which shows a forecast of precipitable water standardized anomalies on June 30, 2026. 


Damage to the Ozone Layer

Furthermore, part of the extra water vapor can rise up and moisten the atmosphere up to and above the ozone layer. The combination image below shows relative humidity on June 30, 2026 at 01:00 UTC, with relative humidity reaching up to 100% at surface level (left), up to 100% at 70 mb or hPa (center), and up to 23% at 10 mb or hPa (right).


[ from earlier post ]
Increases in stratospheric water vapor are bad news, as they not only speed up global warming but also lead to loss of stratospheric ozone, as Drew Shindell pointed out back in 2001.

It has long been known that deterioration of the ozone shield increases ultraviolet-B irradiation, in turn causing skin cancer.

Research (box right) suggests that, millions of years ago, it could also have led to loss of fertility and consequent extinction in plants and animals.

Water vapor reaching stratospheric altitudes causes ozone depletion, as James Anderson describes in a 2017 paper and discusses in the short 2016 video below.

[ from earlier post ]

A recent study led by Yifeng Peng finds that moderate volcanic eruptions and extreme wildfires since 2005 have systematically increased stratospheric water vapor. Both contribute through aerosol-induced tropopause warming; extreme wildfires also reveal an additional self-lofting pathway that transports water vapor into the stratosphere. 

Conclusion

The image below shows annual maximum daily precipitation change with a temperature versus 1850-1900 rise of 1.5°C, 2°C, and 4°C, from the IPCC AR6


The situation looks set to deteriorate further. More water vapor causes more warming, since water vapor is a potent greenhouse gas. As more snow falls over Antarctica, the sea surface of the Southern Ocean increases in salinity, which speeds up melting of sea ice. The extra water vapor and increased melting of sea ice can both strongly accelerate the temperature rise, while water vapor that reaches the stratosphere also causes damage to the ozone layer.

The situation is dire and unacceptably dangerous, and the precautionary principle necessitates the danger to be acknowledged, while facilitating rapid, comprehensive and effective action to reduce the damage and to improve the outlook, where needed in combination with a Climate Emergency Declaration, as described in posts such as in this 2022 post and this 2025 post, and as discussed in the Climate Plan group.


Links

• Moistening Atmosphere
https://arctic-news.blogspot.com/p/moistening-atmosphere.html

• Care for the Ozone Layer
https://arctic-news.blogspot.com/2019/01/care-for-the-ozone-layer.html

• Double Blue Ocean Event 2026-2027? - update 
https://arctic-news.blogspot.com/2026/06/double-blue-ocean-event-2026-2027-update.html

• Moderate volcanic eruptions and extreme wildfires humidify the stratosphere - by Yifeng Peng et al. 
https://www.nature.com/articles/s41586-026-10731-0


Saturday, October 11, 2025

Methane Danger

Global methane concentrations have not risen as strongly during El Niño years 2023 and 2024 as they did from 2020 to 2022, as illustrated by the above image, showing monthly methane concentrations through May 2025, and the image below, showing annual methane growth through 2024. The question is, why did the growth in methane concentrations slow down in 2023 and 2024?


Is the rise in methane releases partly masked? 

One possible mechanism, described here earlier, is that, as temperatures rise and water vapor in the atmosphere increases accordingly (7% more water vapor for every 1°C warming), more hydroxyl becomes present in the atmosphere, so more methane gets broken down by this increased hydroxyl in the atmosphere. Accordingly, stronger methane breakdown by more hydroxyl in 2023 and 2024 may give the impression that methane releases appeared to slow down, whereas methane releases may actually have kept growing, while - since it was getting masked - methane growth was overlooked.

In other words, methane releases may have continue to grow, even at accelerating pace. However, since an increasingly large part of the methane releases was decomposed by more hydroxyl, growth in methane concentrations in the atmosphere only appeared to slow down, while methane releases were partly masked by growth in hydroxyl, as discussed in earlier posts such as this 2017 one.

Where could the extra methane releases have come from? In part, they may have come from seafloor methane releases. In a 2014 post, methane releases were estimated at 771 Tg/y, whereas the IPCC's estimate was 678 Tg/y. That post estimated methane from hydrates and permafrost at 13% of total methane emissions, whereas the IPCC's estimate was a mere 1% of total methane emissions.

According to this mechanism, methane releases actually started to increase more strongly (partly due to more methane erupting from the seafloor of oceans) from the early 2000s, but hydroxyl also kept increasing, slowing down growth in methane concentrations. Eventually, increasing methane releases (including seafloor methane releases) progressively overwhelmed the growth in hydroxyl, contributing to a stronger rise in overall methane concentrations in the atmosphere. 

The growth in methane concentrations peaked in 2022, but after that, the emerging El Niño in 2023 and 2024 drove up temperatures and thus also hydroxyl. So, while growth in methane releases may appear to have slowed down over the past few years, this mechanism suggests that some methane releases may be overlooked, particularly methane releases for the seafloor of oceans, due to increased hydroxyl production in line with more water vapor in the atmosphere over the past few years.

Earthquake danger

Further illustrating the danger of seafloor methane releases, the combination image below shows an earthquake that occurred on October 10, 2025, in between South Africa and Antarctica (left). Methane at 1000 mb (near surface) shows up in a magenta-colored area in between South Africa and Antarctica, indicating methane releases of 1980 ppb and higher (right).


Note that the high methane concentrations near Antarctica are not in the same spot where the earthquake occurred. This can be attributed to the wind moving air clockwise around Antarctica. The combination image below shows wind at 10 m (left) and at 250 mb or hPa (right) on October 11, 2025.


To watch the wind at 1000 hPa or mb (near surface) move around and over Antarctica on October 12, 2025, click on this nullschool.net link

Danger of increase snowfall over Antarctica

The combination image below shows a distorted Jet Stream (250 hPa) moving over Antarctica, which results in high preciptable water anomalies over that area (left) and snowfall (right).


The danger of increased snowfall over Antarctica is described in the image below. 
[ screenshot from earlier post ]

The methane danger has been described in many earlier posts, e.g. the image below is from a 2014 post. The image shows a polynomial trend based on IPCC AR5 data from 1955 to 2011, pointing at methane reaching mean global levels higher than 3000 ppb by the year 2030. If methane starts to erupt in large quantities from clathrates underneath the seafloor of oceans and from thawing permafrost, then something like this may well happen and the amount of methane in the atmosphere could double by 2030. 


Climate Emergency Declaration

UN secretary-general António Guterres recently spoke about the need for “a credible global response plan to get us on track” regarding the international goal of limiting the global temperature rise. “The science demands action, the law commands it,” Guterres said, in reference to a recent international court of justice ruling. “The economics compel it and people are calling for it.”

What could be added is that the situation is dire and unacceptably dangerous, and the precautionary principle necessitates rapid, comprehensive and effective action to reduce the damage and to improve the outlook, where needed in combination with a Climate Emergency Declaration, as described in posts such as this 2022 post and this one and as discussed in the Climate Plan group.


Links

• Focus on Antarctica
https://arctic-news.blogspot.com/2025/09/focus-on-antarctica.html

• Record low Arctic sea ice volume minimum highlights methane danger
https://arctic-news.blogspot.com/2025/10/record-low-arctic-sea-ice-volume-highlights-methane-danger.html

• Global methane concentration and annual growth
https://gml.noaa.gov/ccgg/trends_ch4
also discussed on Facebook at: 
https://www.facebook.com/groups/arcticnews/posts/10163340957609679

• Transforming Society
https://arctic-news.blogspot.com/2022/10/transforming-society.html

• Climate Plan
https://arctic-news.blogspot.com/p/climateplan.html

• Climate Emergency Declaration
https://arctic-news.blogspot.com/p/climate-emergency-declaration.html


Wednesday, July 2, 2025

Saltier water, less sea ice

The Southern Meriodinal Ocean Circulation (SMOC) used to be driven by a cold freshwater layer resulting from melting Antarctic sea ice, enabling circumpolar waters to cool off and freshen, making them more dense and sink to the bottom. 
[ Antarctic waters sinking to the bottom, click on images to enlarge ]
This is illustrated by the above image, from a study led by Violaine Pellichero (2018), showing water-mass transformation within the Southern Ocean mixed-layer under sea-ice. Schematic cross-section illustrating the main water-masses in the Southern Ocean (Antarctic Intermediate and Mode Waters in red, Circumpolar Deep Waters in gray, and Dense Shelf Waters and Antarctic Bottom Waters in blue) and their interaction with ice and the surface. The water-masses are denoted by their neutral density values and the arrows corresponding to each water-masses indicate subduction (downward) or upwelling (upwards). The violet arrows illustrate the effect of northward sea-ice extent and freshwater transport. The green line is the mixed-layer.

A study led by Alessandro Silvano (2025) finds that, over the years, surface waters have become more salty.
By combining satellite observations with data from underwater robots, researchers built a 15-year picture of changes in ocean salinity, temperature and sea ice, as illustrated by the above image. Around 2015, surface salinity in the Southern Ocean began rising sharply – just as sea ice extent started to crash. 
When surface waters become saltier, they sink more readily, stirring the ocean’s layers and allowing heat from the deep to rise. This upward heat flux can melt sea ice from below, even during winter, making it harder for ice to reform. This vertical circulation also draws up more salt from deeper layers, reinforcing the cycle.

In addition to heat rising up from the deep, there is the danger that increasing amounts of both heat and carbon dioxide (CO₂), previously stored in the deep ocean by sinking circumpolar waters, will instead remain at the surface and cause both atmospheric temperatures and CO₂ concentrations to rise.

In the video below, Paul Beckwith discusses the recent study. 


The video below by @JustHaveaThink also discusses the recent study. 


Saltier water, less sea ice

   [ Saltier water, less sea ice ]
The higher the water's salt content, the lower its melting point. Seawater typically has a salinity of about 3.5% (35 grams of salt per liter of water). Sea ice starts melting when the temperature rises to about -2°C (28.4°F). By contrast, freshwater remains frozen as long as the temperature remains below 0°C (32°F).

What is causing the Southern Ocean surface to become more salty? Higher temperatures come with feedbacks, such as stronger wind and stronger evaporation resulting in both a lot more water vapor and a lot more heat getting transferred from the surface to the atmosphere. 

Much of the water vapor will return to the surface in the form of precipitation such as rain and snow, but part of this precipitation will fall over Antarctica, with the net result of an increase in salinity of the surface of the Southern Ocean. Increased snowfall over Antarctica can be attributed to rising air temperatures and stronger evaporation, changes in atmospheric circulation and the effects of ozone depletion. 

Furthermore, 7% more water vapor will remain in the atmosphere for every degree Celsius rise in temperature. Since water vapor is a potent greenhouse gas, this will further increase temperatures, making it a self-amplifying feedback that can significantly contribute to further acceleration of the temperature rise. 

Accumulating feedbacks

Warmer oceans result in stronger stratification (feedback #29), further contributing to make it harder for heat to reach the deeper parts of oceans. As a result, a larger proportion of the heat that was previously entering oceans will instead remain in the atmosphere or accumulate at the ocean surface, and slowing down of the Atlantic Meriodinal Overturning Circulation (AMOC) further contributes to this. 
[ from earlier post ]
More evaporation typically makes the sea surface more salty, while more precipitation, melting of sea ice and run-off from rivers and glaciers typically make the ocean surface fresher. As the recent study shows, the Southern Ocean surface is becoming more salty, which contributes to higher sea surface temperatures and in more melting of the sea ice. It's a self-amplifying feedback, in that saltier water at the ocean surface draws up more heat from the deep ocean, making it harder for sea ice to regrow. Increasing amounts of heat and CO₂ that were previously stored in the deep ocean by sinking circumpolar waters, threaten to instead remain at the surface and cause both atmospheric temperatures and CO₂ concentrations to rise. 

Less sea ice also comes with loss of albedo (water is less reflective than ice, feedback #1), loss of the latent heat buffer (as sea ice disappears, heat can no longer be consumed by the process of melting, and the heat will instead go into increasing the temperature, feedback #14) and loss of emissivity (water is less efficient than ice in emitting in the far-infrared region of the spectrum, feedback #23), while warmer water result in more water vapor and less low-level clouds that reflect sunlight back into space (feedback #25). 

The image below, from an earlier post, illustrates that higher temperatures come with feedbacks and the impact of one feedback can amplify the impact of other feedbacks.


The above image depicts some of the dangers of feedbacks for the Arctic. Many feedbacks also apply to the Antarctic, but the bottom part of the image on the right may be particularly applicable to the Southern Hemisphere, which has more ocean surface and Antarctica constitutes a huge land mass on and around the South Pole. 

Covering more than 70% of Earth’s surface, our global ocean has absorbed about 90% of the warming that has occurred in recent decades due to increasing greenhouse gases, and the top few meters of the ocean store as much heat as Earth's entire atmosphere, as described by a NASA post

Even a small change could therefore result in a huge rise in the global air temperature.

Climate Emergency Declaration

The situation is dire and the precautionary principle calls for rapid, comprehensive and effective action to reduce the damage and to improve the situation, as described in this 2022 post, where needed in combination with a Climate Emergency Declaration, as discussed at this group.


Links

• The southern ocean meridional overturning in the sea-ice sector is driven by freshwater fluxes - by Violaine Pellichero (2018) 

• Rising surface salinity and declining sea ice: A new Southern Ocean state revealed by satellites - by Alessandro Silvano et al. (2025)
https://www.pnas.org/doi/full/10.1073/pnas.2500440122
discussed on facebook at: 
https://www.facebook.com/groups/arcticnews/posts/10162876582119679

• Abrupt Antarctic Ocean Regime Shift: Reversed SMOC - Southern Meridional Overturning Circulation - video by Paul Beckwith 

Wednesday, September 4, 2024

Water Vapor Feedback


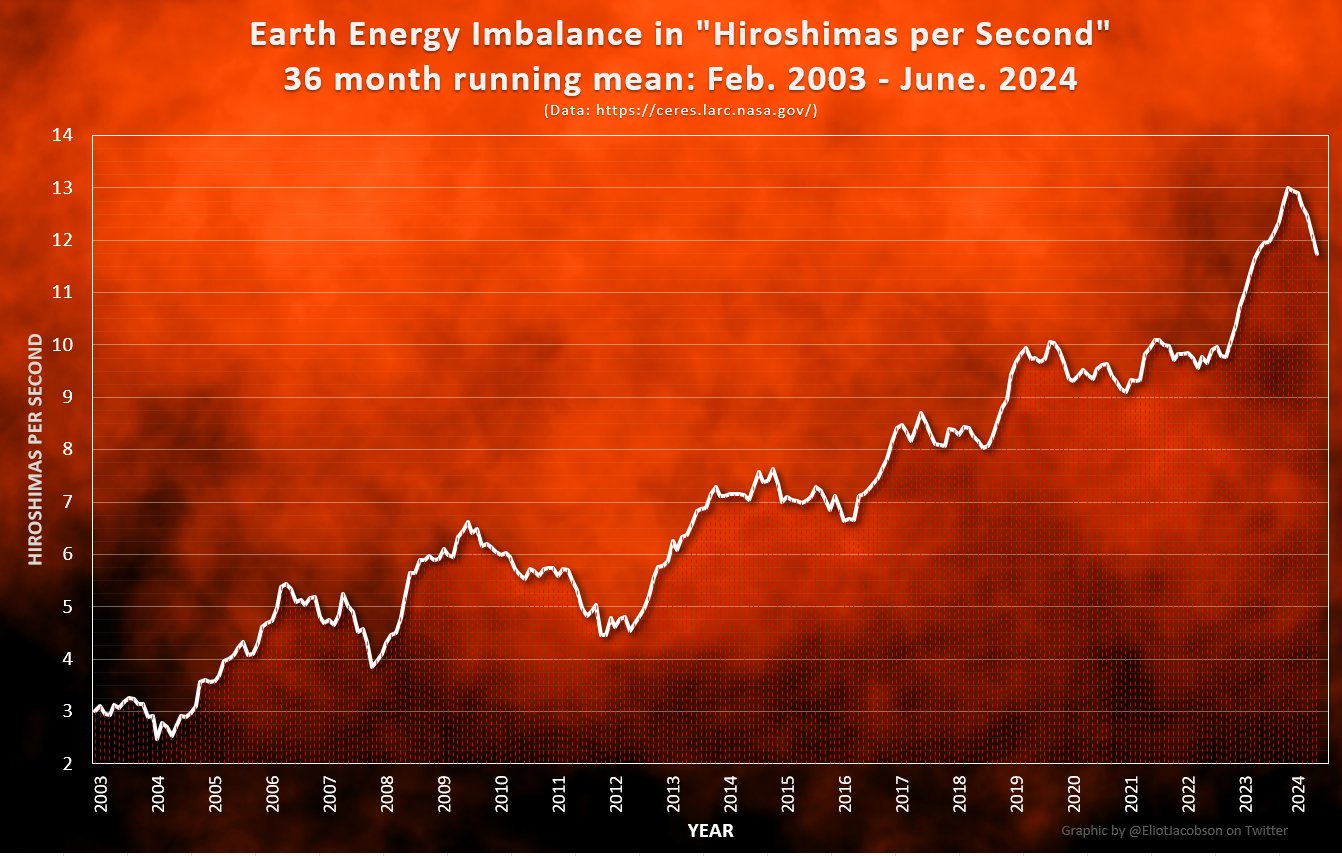
Earth's Energy Imbalance is now about four times as high as it was a decade ago, as illustrated by the above image, by Eliot Jacobson. As a result, feedbacks are starting to kick in with greater ferocity.

Water vapor feedback

One such feedback is the water vapor feedback. The temperature rise results in more evaporation, i.e. more water vapor and heat will enter the atmosphere, much of which will return to the surface in the form of precipitation, but some will remain in the atmosphere, as there will be 7% more water vapor for every 1°C warming. As illustrated by the image below, created with NOAA data, surface precipitable water was 27.181 kg/m² in August 2024, a record high for this month.

[ surface precipitable water through August 2024 ]

How much more water vapor currently is in the atmosphere compared to pre-industrial depends on how much the temperature has risen since pre-industrial. The February 2024 temperature was 1.76°C above 1885-1915, which could be as much as 2.75°C above the pre-industrial temperature. A 2.75°C rise corresponds with almost ⅕ more water vapor in the atmosphere.

More ocean heat and water vapor moving to Arctic

The temperature rise also comes with stronger wind. An earlier post points at a study that found increased kinetic energy in about 76% of the upper 2,000 meters of global oceans, as a result of intensification of surface winds since the 1990s.

Stronger wind speeds up ocean currents, enabling more ocean heat to move to the Arctic, while stronger wind also enables more water vapor to move to the Arctic and more rain to fall closer to the Arctic, along the path of prevailing ocean currents and wind patterns. As a result, both heat and water vapor will increase in the Arctic. 

This will in turn further increase the temperature rise in the Arctic, since water vapor is a potent greenhouse gas, while more water vapor also results in less hydroxyl, thus extending methane's lifetime.

The resulting temperature rise in the Arctic also reduces the snow and ice cover, further amplifying the temperature rise in the Arctic, while the temperature rise and the presence of more open water will also enable more evaporation, resulting in more water vapor in the atmosphere over the Arctic. 

High levels of methane are already present over the Arctic and the water vapor feedback makes things worse. Additionally, more ocean heat entering the Arctic Ocean threatens to further destabilize sediments at the seafloor that contain methane hydrates and cause even more methane to erupt, resulting in huge amounts of methane entering the atmosphere over the Arctic, from the hydrates and also from free gas underneath the hydrates.

[ click on images to enlarge ]
More water vapor and rainfall combined with higher temperatures will also cause more methane releases from lakes, wetlands and permafrost on land in the northern parts of Canada, Europe and Siberia. 

The image on the right shows a forecast by Climate Reanalyzer of high temperature anomalies in the northern parts of Europe on September 7, 2024. 

The image below shows high methane levels forecast by Copernicus at surface level in northern Europe on September 7, 2024, 03 UTC (run 00 UTC). 


As the image below shows, methane concentrations as high as 2400 parts per billion (ppb) were recently recorded at the NOAA observatory in Utqiagvik (Barrow), Alaska.


As Earth's Energy Imbalance keeps rising, an increasing amount of heat accumulates in oceans. The image below, adapted from NOAA, illustrates the huge amount of heat present in the ocean around North America, with sea surface temperatures as high as 33.6°C (92.48°F) recorded on September 6, 2024. The image also shows the Gulf Stream (middle right), the Atlantic ocean current that carries heat from the Gulf of Mexico to the Arctic Ocean. 


The image below, by Brian McNoldy shows that ocean heat content in the Gulf of Mexico was at record high on September 4, 2024.


The temperature rise is hitting the Arctic hard, as illustrated by the image below, created with NASA content.


The temperature rise in the air is most profound at both poles, a phenomenon known as polar amplification, as illustrated by the temperature anomaly map for August 2024 below. 


[ from earlier post ]
Oceans are still absorbing an estimated 91% of the excess heat energy trapped in the Earth's climate system due to human-caused global warming. If just a small part of that heat instead remains in the atmosphere, this could constitute a huge rise in temperature. Heat already stored in the deeper layers of the ocean will eventually be released, committing Earth to at least some additional surface warming in the future.

Polar amplification of the temperature rise causes a relative slowing down of the speed at which heat flows from the Equator to the poles. This impacts ocean currents and wind patterns, resulting in slowing down of the Atlantic meridional overturning circulation (AMOC) and of ocean currents around Antarctica that carry heat to the deep ocean, as well as in deformation of the Jet Stream. 

recent study warns about intensification of global warming due to the slowdown of the overturning circulation. The overturning circulation carries carbon dioxide and heat to the deep ocean, where it is stored and hidden from the atmosphere. As the ocean storage capacity is reduced, more carbon dioxide and heat are left in the atmosphere. This feedback accelerates global warming.
[ from earlier post ]
Warmer oceans also result in stronger stratification, which further contributes to make it harder for heat to reach the deeper parts of oceans. As a result, a larger proportion of heat that was previously entering oceans will instead remain in the atmosphere or accumulate at the ocean surface, and slowing down of the overturning circulation further contributes to this, as discussed above. 

At the same time, overall global wind strength increases as temperatures rise, and as the Jet Stream gets more deformed, this can at times strongly boost the flow of wind and water along prevailing ocean currents, wind patterns and storm tracks that carry heat toward the Poles. Furthermore, polar amplification of the temperature rise results in a relatively stronger rise in water vapor in the air over Antarctica and the Arctic. 


At times, part of this accumulated energy can, in the form of ocean heat and precipitable water, be abruptly transported to the Arctic, along the path of prevailing ocean currents and wind patterns boosted by stronger wind and storms. This is illustrated by the above image that shows unusually high amounts of precipitable water recorded near the North Pole on September 1, 2024, at 04 UTC (20 kg/m² at the green circle). This can be further facilitated by the formation of a freshwater lid at the surface of the North Atlantic that enables more ocean heat to travel underneath this lid to the Arctic Ocean. 


Temperatures remain high

Temperatures remain high, even while a transition to La Niña is expected by Sep-Nov 2024, persisting through Jan-Mar 2025, as illustrated by the image below, adapted from NOAA.


The image below, from an earlier post and adapted from NOAA, illustrates that El Niño conditions were present from June 2023 through April 2024, and that ENSO-neutral started in May 2024. While El Niños typically occur every 3 to 5 years, as NOAA explains, El Niños can occur as frequently as every two years, as happened in 2002, 2004 and 2006, and as illustrated by the image below. The danger is that we could move into a new El Niño in 2025, while temperatures remain high due to feedbacks and while sunspots move toward a peak in this cycle, expected to occur in July 2025.


The image below illustrates that, for 14 consecutive months, the temperature anomaly has exceeded 1.2°C above 1951-1980 or (more aptly) 2°C above pre-industrial, and is rising again, even while El Niño ended April 2024.


Similarly, the image below illustrates that, for more than 14 consecutive months, the temperature anomaly has been high, i.e. about 0.8°C (± 0.3°C) above the 1991-2020 average and much more when compared to a pre-industrial base, with little or no sign of a return to earlier temperatures. On September 2, 2024, the temperature was 0.8°C above 1991-2020, the highest anomaly on record for that day of the year.

[ click on images to enlarge ]

The image below, created with NASA data while using a 1903-1924 custom base, illustrates that the monthly temperature anomaly through August 2024 has been more than 1.5°C above this base for each of the past consecutive 14 months, and even more when compared to a pre-industrial base. The red line shows the trend (2-year Lowess Smoothing) associated with the rapid recent rise.


A huge temperature rise could unfold by 2026, as the joint result of changes in the atmosphere, changes in surface and cloud albedo, changes in wind patterns & ocean currents, and further developments, e.g. in a cataclysmic alignment, a strong El Niño could develop in 2025 which, in combination with higher than expected sunspots, could make a difference of 0.75°C. Sunspots are expected to reach a peak in the current cycle in July 2025. 

Sea ice disappearing fast

Sea ice is disappearing over large parts of the Arctic Ocean, including near the North Pole. 


The above compilation image shows, on the left, that Arctic sea ice volume was at a record low for the time of year on September 5, 2024, as it has been for most of the year. On the right, an image by the University of Bremen showing sea ice concentration on September 5, 2024.


In the above compilation image, the NASA Worldview image on the left shows Arctic sea ice on September 10, 2024.

The Danish Meteorological Institute (DMI) image at the top right is from an earlier date, not yet showing the 2024 minimum, yet it does show that the minimum volume in earlier years was not as far below 5000 km³ as it was in 2024. The 2024 minimum is depicted on the DMI image on the bottom right, showing that Arctic sea ice volume was well below 5000 km³ on September 10, 2024.


In the above image the two DMI images overlap, highlighting that Arctic sea ice volume did reach a record low in 2024. 


Global sea ice extent was 21.04 million km² on September 4, 2024, a record low for the time of year, as feedbacks start kicking in with greater ferocity, including less albedo, latent heat buffer and emissivity, more water vapor, less lower clouds, Jet Stream changes, more emissions, lightning and forest fires, stronger rainfall and heatwaves causing more run-off of heat, and stronger storms that can push ocean heat toward the poles, all contributing to accelerate sea ice loss and the temperature rise, as discussed in earlier posts such as this one

[ for more background, also view the Extinction page ]
A huge temperature rise could occur soon

As a result, several tipping points threaten to be crossed in the Arctic soon, as described in an earlier post, including the latent heat tipping point and a Blue Ocean Event (starting when Arctic sea ice extent will fall below 1 million km²), which would further speed up the temperature rise in the Arctic.

As temperatures keep rising in the Arctic, changes to the Jet Stream look set to intensify, resulting in loss of terrestrial albedo in the Arctic that could equal the albedo loss resulting from sea ice decline.

Further feedbacks include permafrost degradation, both terrestrial and on the seafloor of the Arctic Ocean, which looks set to cause huge releases of greenhouse gases (particularly CO₂, CH₄ and N₂O).

This would in turn also cause more water vapor to enter the atmosphere, further speeding up the temperature rise, especially in the Arctic, where vast amounts of methane are contained in sediments at the seafloor and where there is very little hydroxyl in the air to break down the methane.

Temperatures look set to rise further in the Arctic, due to falling away of sulfate aerosols, as illustrated by the IPCC image below that shows how much temperatures are currently suppressed in the Arctic due to aerosols and thus also shows how much temperatures in the Arctic look set to rise as the aerosol masking effect falls away.


Furthermore, the combined impact of aerosols and nitrogen fertilizers has been underestimated; a recent study concludes that when ammonia, nitric acid and sulfuric acid are present together, they contribute strongly to the formation of cirrus clouds.

At the same time, there could be a temperature rise due to releases of other aerosols that have a net warming impact, such as black and brown carbon, which can increase dramatically as more wood burning, forest fires and urban fires take place, which again would hit the Arctic hard by darkening the surface as they settle on the snow and ice cover, thus speeding up its decline.

The image below, with forecasts for September 9, 2024 03 UTC (run 00 UTC) adapted from Copernicus, illustrates gases and aerosols released due to forest fires burning in the Amazon.


The joint impact could cause the clouds tipping point to get crossed, adding an abrupt further 8°C to the rise, and altogether, a global temperature rise could unfold of more than 18°C above pre-industrial, as illustrated by the image further above on the right, and as also discussed at Extinction. This could in turn cause the water vapor tipping point to get crossed, which means that from then on the increase in water vapor alone would suffice to keep increasing the temperature, in a runaway greenhouse process in which evaporation could cause a global surface temperature rise of several hundred degrees Celsius and make our planet as inhospitable as Venus, as this study concludes and as discussed at this post.

[ click on images to enlarge ]
A 2020 study led by Jorgen Randers concludes that the world is already past a point-of-no-return for global warming, as self-sustained thawing of the permafrost will continue for hundreds of years, even if global society did stop all emissions of man-made greenhouse gases immediately, due to a combination of declining surface albedo (driven by decline of the Arctic snow and ice cover), increasing amounts of water vapor in the atmosphere (driven by higher temperatures), and changes in concentrations of further greenhouse gases in the atmosphere (driven by changes in sinks and sources of carbon dioxide and methane such as thawing permafrost), as illustrated by the image on the right, from an earlier post.

Climate Emergency Declaration

The situation is dire and the precautionary principle calls for rapid, comprehensive and effective action to reduce the damage and to improve the situation, as described in this 2022 post, where needed in combination with a Climate Emergency Declaration, as discussed at this group.


Links

• Earth Energy Imbalance - by Eliot Jacobson

• NOAA - Physical Sciences Laboratory
https://psl.noaa.gov

• NOAA - Global Monitoring Laboratory - Carbon Cycle Gases
https://gml.noaa.gov/dv/iadv/graph.php?code=BRW&program=ccgg&type=ts

• Cataclysmic Alignment threatens Climate Catastrophe
• Sunspots
https://arctic-news.blogspot.com/p/sunspots.html

• Pre-industrial
https://arctic-news.blogspot.com/p/pre-industrial.html

• Ocean Heat Content - by Brian McNoldy
https://bmcnoldy.earth.miami.edu/tropics/ohc

• Recent reduced abyssal overturning and ventilation in the Australian Antarctic Basin - by Kathryn Gunn et al. 
https://www.nature.com/articles/s41558-023-01667-8
Discussed on facebook at: 

• Copernicus - Atmosphere

• NASA - Gistemp

• NASA - Worldview

• Danish Meteorological Institute - Arctic sea ice volume and thickness
https://ocean.dmi.dk/arctic/icethickness/thk.uk.php

• University of Bremen - Arctic sea ice
https://seaice.uni-bremen.de/start

• Arctic Data archive System - National Institute of Polar Research - Japan
https://ads.nipr.ac.jp/vishop

• Will temperatures keep rising fast?
https://arctic-news.blogspot.com/2023/12/will-temperatures-keep-rising-fast.html

• Feedbacks
https://arctic-news.blogspot.com/p/feedbacks.html

• Jet Stream
https://arctic-news.blogspot.com/p/jet-stream.html

• The Clouds Feedback and the Clouds Tipping Point
https://arctic-news.blogspot.com/p/clouds-feedback.html

• Cold freshwater lid on North Atlantic
https://arctic-news.blogspot.com/p/cold-freshwater-lid-on-north-atlantic.html

• Resetting tropospheric OH and CH4 lifetime with ultraviolet H2O absorption - by Michael Prather et al. 
https://www.science.org/doi/abs/10.1126/science.adn0415
Discussed on facebook at: 
https://www.facebook.com/groups/arcticnews/posts/10161571351924679

• Transforming Society
https://arctic-news.blogspot.com/2022/10/transforming-society.html

• Climate Plan
https://arctic-news.blogspot.com/p/climateplan.html

• Climate Emergency Declaration
https://arctic-news.blogspot.com/p/climate-emergency-declaration.html