Wednesday, March 23, 2022

From a Miocene-like CO2 level of ~420 ppm to irreversible climate change

by Andrew Glikson

As terrestrial adversaries keep pushing the Earth and its inhabitants to within seconds of a nuclear catastrophe, looming through heat waves, extreme fires and flood events is the huge calamity of irreversible global warming.

[ from earlier post ]


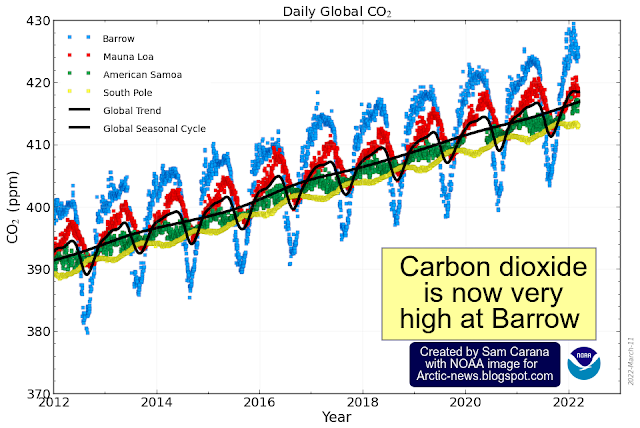
Carbon dioxide (CO₂) reached levels well above 420 parts per million (ppm) at Mauna Lao, Hawaii, on February 13 and 14, 2022, as illustrated by the image, from an earlier post.


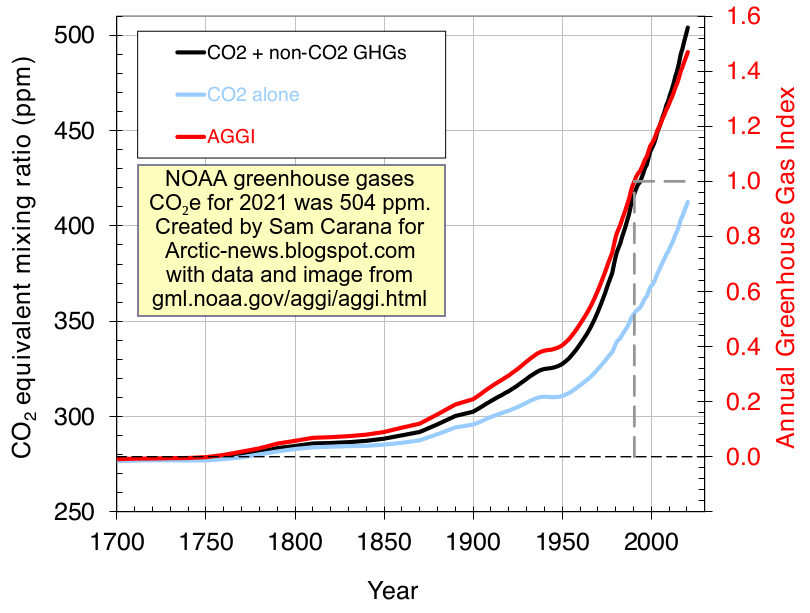
The image below, adapted from NOAA, shows CO₂ and other greenhouse gases such as methane (CH₄) and nitrous oxide (N₂O) rising from 280 ppm CO₂e in 1700 to 504 ppm CO₂e in 2021. This figure of 504 ppm CO₂e could be much higher when applying a short horizon to calculate methane's Global Warming Potential. 


CO₂ levels have been rising from ~315 ppm in 1950 to ~419 ppm in 2022, at an average growth rate of some 1.44 ppm/year accelerating to about 2.5 ppm/year recently. 


The rate of this CO₂ rise is unprecedented in the Cenozoic (since 65 Ma) record, with perhaps the closest parallel being the aftermath of the K-T dinosaur mass extinction event, when the temperature rose by as much as ~7.5°C. According to Beerling et al. (2002) CO₂ level rose from 350–500 ppm to at least 2,300 ppm within 10,000 years following the K-T impact, at an average rate of ~0.2 ppm/year, significantly less than today's rate.


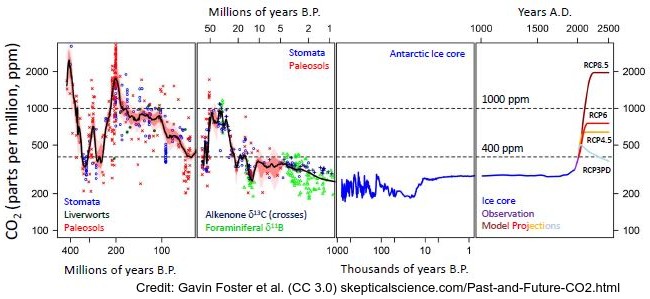
Above image shows CO₂ on track to reach 575 ppm by 2061, a level commensurate with atmospheric conditions during parts of the Miocene, when the temperature in central Europe was 20°C higher than today, as also illustrated by the image below, adapted from a 2020 study by Methner et al


The image below further illustrates that to find CO₂ levels as high as 575 ppm, we have to go back in time millions of year, into the Miocene. 


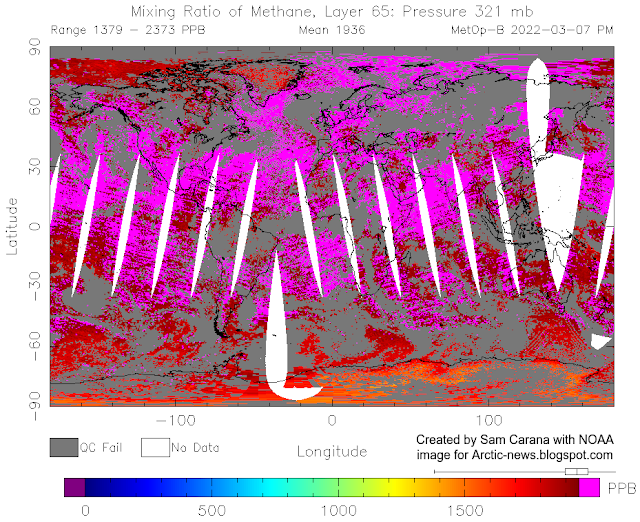
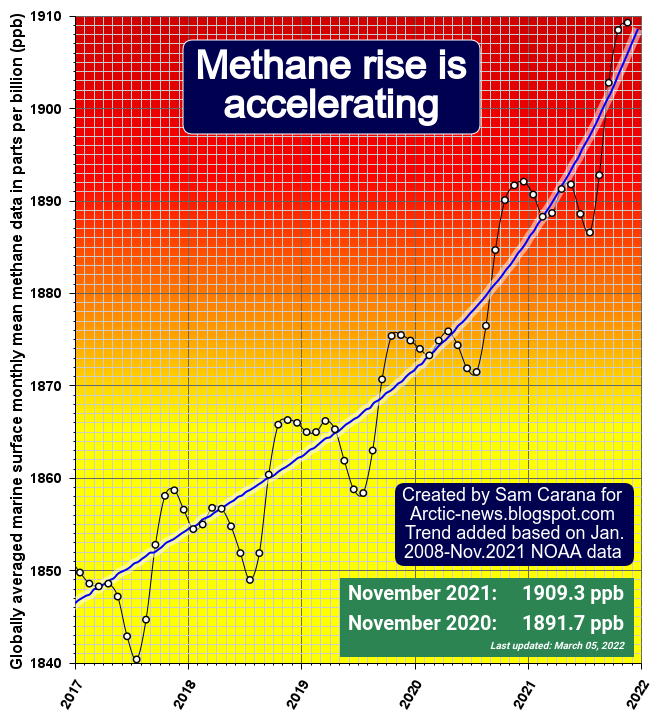
What makes current conditions even more dire is that it's not just carbon dioxide that is rising at a speed unprecedented in history, methane is rising at an even faster pace, as illustrated by the image below, from an earlier post


Can the current climate trend be arrested, or even reversed?

The current global greenhouse gas trend is leading to one of the largest mass extinctions of species in the geological record, one of the victims being human civilization. The current focus on emission reduction overlooks a major factor, namely the amplifying feedbacks from land and oceans (Steffen et al., 2018). There is a desperate need, in addition to emission reduction, for urgent large-scale sequestration of atmospheric greenhouse gases, and for further action to combat the temperature rise.

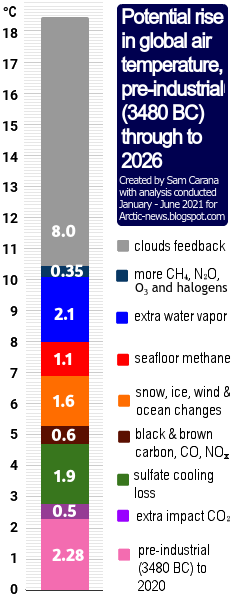
The role of amplifying GHG feedbacks from land and oceans, leading to enhanced heating, appears to be neglected in climate negotiationsAmplifying feedbacks include:
  • an increase in evaporation, raising atmospheric water vapor levels, which enhances the greenhouse gas effect;
  • a decline in the polar albedo (reflection) due to large-scale lateral and vertical melting of ice;
  • release of methane from degrading permafrost and from polar sediments;
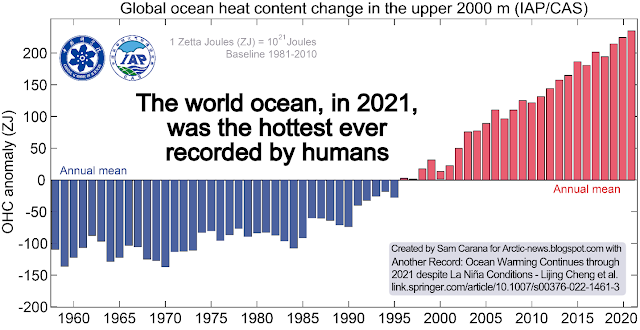
  • reduced CO₂ intake by warming oceans. Currently the oceans absorb between 35-42% of all CO₂ and around 90% of the excess heat;
  • warming, desiccation, deforestation and fires over land areas.
Numerous species have been unable to survive the accelerated global heating following the K-T impact event, nor are many species likely to survive the even higher rate of the of the Anthropocene catastrophe. A connection between climate change and human wars is evident from the accelerated global warming in the wake of the industrial-scale world wars I and II and subsequent industrial developments. It is possible that climate change could have been arrested in the 1960s had global efforts been directed at the time for abrupt cuts in emissions, transformation of agricultural and land clearing practices, and effort at CO₂ drawdown/sequestration. By the onset of the 21st century however, such efforts have hardly been undertaken and could yet turn out to be too late. The repetitions of humanity’s old warlike habits, investing resources in industries of death, genocidal wars associated with intensive carbon emissions, forecast in “The Fate of the Earth”, yield little promise for a change of direction.


Andrew Glikson
A/Prof. Andrew Glikson

Earth and Paleo-climate scientist
School of Biological, Earth and Environmental Sciences
The University of New South Wales,
Kensington NSW 2052 Australia

Books:
The Asteroid Impact Connection of Planetary Evolution
https://www.springer.com/gp/book/9789400763272
The Archaean: Geological and Geochemical Windows into the Early Earth
https://www.springer.com/gp/book/9783319079073
Climate, Fire and Human Evolution: The Deep Time Dimensions of the Anthropocene
https://www.springer.com/gp/book/9783319225111
The Plutocene: Blueprints for a Post-Anthropocene Greenhouse Earth
https://www.springer.com/gp/book/9783319572369
Evolution of the Atmosphere, Fire and the Anthropocene Climate Event Horizon
https://www.springer.com/gp/book/9789400773318
From Stars to Brains: Milestones in the Planetary Evolution of Life and Intelligence
https://www.springer.com/us/book/9783030106027
Asteroids Impacts, Crustal Evolution and Related Mineral Systems with Special Reference to Australia
https://www.springer.com/us/book/9783319745442
The Event Horizon: Homo Prometheus and the Climate Catastrophe
https://www.springer.com/gp/book/9783030547332
The Fatal Species: From Warlike Primates to Planetary Mass Extinction
https://www.springer.com/gp/book/9783030754679


Friday, March 18, 2022

Signs of the rise to come

Arctic sea ice extent has fallen strongly over the past few weeks and looks set to keep falling rapidly over the next few months. 


Ocean heat is at record levels, as illustrated by the image below and as discussed in an earlier post


The image below shows the temperature at the North Pole reaching 0.7°C or 33.3°F (at 1000 hPa, at the green circle) on March 16, 2022, with ocean currents depicted at the background.


How could the temperature at the North Pole get this high, in March? 

As said, ocean heat is at record levels. This is heating up the air over the Atlantic Ocean. At times, huge amounts of heat are getting pushed into the Arctic due to a distorted Jet Stream. The image on the right shows the Jet Stream on the Northern Hemisphere on March 16, 2022, with strong winds at 250 hPa pushing heat from the Atlantic Ocean into the Arctic.

Furthermore, the Gulf Stream is pushing huge amounts of ocean heat toward the Arctic. 

The image below shows that sea surface temperatures were as much as 14.1°C or 25.3°F higher than 1981-2011 off the North American coast (green circle) on March 5, 2022.


The image below shows that, on March 16, 2022, the temperature in the Arctic was 3.5°C higher than 1979-2000. 


Below, a Climate Reanalyzer forecast for March 18, 2022, of very high temperature anomalies over Antarctica combined with a forecast of a diversion over Antarctica of the Southern Polar Jet Stream (wind at 250 hPa).


As the combination image below shows, the temperature on Antarctica was 12.5°C or 54.4°F at 1000 hPa at the green circle on March 17, 2022 at 17:00 UTC. The image in the left panel shows high sea surface temperature anomalies south of Australia, while the Jet Stream (250 hPa) moves over Antarctica. The image in the right panel shows wind and temperature at 1000 hPa. 


What causes such distortions of the Jet Stream?

• Emissions by people heat up the air, and heat up oceans and make winds stronger, as discussed in an earlier post.

• Another mechanism affecting the Jet Stream is that, as oceans heat up, the temperature difference between land and oceans widens both in Summer and in Winter and this can cause the Jet Stream to divert deeper from the narrow path it used to follow, as discussed in an earlier post

• What especially affects the Jet Stream on the Northern Hemisphere is that, as the Arctic gets hit hard by temperature rises, the temperature difference narrows between the Arctic and the Equator, slowing the Jet Stream; this can prolong and amplify extreme weather events.


Signs of the things to come

The above events could be seen as signs of the strength and the speed of the rise to come.  


Rise due to La Niña and high sunspots

The image below indicates that the global temperature difference between the top of an El Niño and the bottom of a La Niña period could be more than half a degree Celsius.


The highest temperature anomalies have over the years shown up at the highest latitudes North, i.e. the Arctic Ocean, in particular during El Niño periods.

This is illustrated by the image on the right, created with a NASA image that shows temperature anomalies of up to 4.1°C (versus 1951-1980) over the Arctic Ocean.

The next image on the right, by Climate Reanalyzer, illustrates that very high temperature anomalies can show up at the highest latitudes North during Winter on the Northern Hemisphere, in this case a temperature anomaly (vs 1979-2000) of 7°C for the Arctic as a whole on February 28, 2022. 

It is ominous for such high anomalies to show up in the Arctic during a La Niña period, and when it's Winter on the Northern Hemisphere when there's only very little sunlight reaching the Arctic. 

For comparison, the next image on the right shows a temperature anomaly (vs 1979-2000) of 7.7°C for the Arctic as a whole on November 18, 2016, when there was an El Niño. 

We're currently in the depth of a persistent La Niña, as illustrated by the next image on the right, adapted from NOAA. This has been suppressing the temperature and it will keep suppressing the temperature until the start of the next El Niño. The next El Niño could push temperatures up even more strongly than the average El Niño, for a number of reasons.

As the temperature keeps rising, ever more frequent strong El Niño events are likely to occur, as discussed in an earlier post. Furthermore, a 2019 study analyzes how tipping the ENSO into a permanent El Niño can trigger state transitions in global terrestrial ecosystems, as mentioned in an earlier post.

Currently, the temperature rise is additionally suppressed by low sunspots. Within a few years time, sunspots can be expected to reach the peak of their current cycle. Observed sunspots look stronger than predicted, as described at the sunspots page. According to IPCC AR4, warming by solar irradiance ranges from 0.06 to 0.3 W/m².


Rise due to further elements

[ from the Extinction page ]
On top of the temperature rise that can be expected to unfold over the next few years due to variables such as an upcoming  El Niño and high sunspots, there is the temperature rise due to further elements.

One of these elements causing the temperature to rise is the falling away of sulfate aerosols, while there could be a further temperature rise due to releases of other aerosols that have a net warming impact, such as black and brown carbon, which can increase dramatically as more wood burning and forest fires take place.

As the temperature of the atmosphere rises, this will trigger self-reinforcing feedbacks such as an increase in water vapor combined with a decrease in lower clouds decks, further increasing the temperature, as described at the clouds feedback page.

What could further push up temperatures a lot over the next few years is the compound impact of feedbacks in the Arctic, including decline of the snow and ice cover, releases of greenhouse gases from degrading subsea and terrestrial permafrost, and further distortion of the Jet Stream causing more extreme weather events.


Conclusion

The situation is dire and calls for the most comprehensive and effective action, as described at the Climate Plan.


Links

• Albedo loss in Antarctica
https://arctic-news.blogspot.com/2022/02/albedo-loss-in-antarctica.html

• NSIDC - Charctic interactive Sea Ice Graph
https://nsidc.org/arcticseaicenews/charctic-interactive-sea-ice-graph

• Nullschool.net
https://earth.nullschool.net

• Climate Reanalyzer
https://climatereanalyzer.org

• Accelerating loss of global snow and ice cover
https://arctic-news.blogspot.com/2022/02/accelerating-loss-of-global-snow-and-ice-cover.html

• Why stronger winds over the North Atlantic are so dangerous

• NOAA - ENSO: Recent Evolution, Current Status and Predictions
https://www.cpc.ncep.noaa.gov/products/analysis_monitoring/lanina/enso_evolution-status-fcsts-web.pdf

• Historical change of El Niño properties sheds light on future changes of extreme El Niño - by Bin Wang et al. 
https://www.pnas.org/content/116/45/22512

• Tipping the ENSO into a permanent El Niño can trigger state transitions in global terrestrial ecosystems - by Mateo Duque-Villegas et al. 
https://esd.copernicus.org/articles/10/631/2019

• Accelerating loss of global snow and ice cover 

• Clouds feedback

• Feedbacks in the Arctic


Saturday, March 12, 2022

Methane rise is accelerating


NOAA's globally averaged marine surface monthly mean methane reading for November 2021 of 1909.3 parts per billion (ppb) is 17.6 ppb higher than the reading for November 2020. By comparison, NOAA's annual global mean methane increase of 15.57 ppb for 2020 was at the time the highest on record.

Keep in mind that this 1909.3 ppb reading is for November 2021; it now is March 2022. Furthermore, NOAA's data are for marine surface measurements; more methane tends to accumulate at higher altitudes.

The image below shows that the MetOp-B satellite recorded a mean methane level of 1936 ppb at 321 mb on March 7, 2022 pm.


Carbon dioxide

Carbon dioxide levels are currently very high over the Arctic, as illustrated by the image below that shows carbon dioxide levels approaching 430 parts per million (ppm) recently at Barrow, Alaska. 


Clouds tipping point

[ from earlier post ]
The danger is that high greenhouse gas levels could combine to push the carbon dioxide equivalent (CO₂e) level over the 1200 ppm clouds tipping point, at first in one spot, causing low-altitude clouds in various neighboring areas to break up there, and then propagating break-up of clouds in further areas, as discussed at the clouds feedback page.

The MetOp-B satellite recorded a mean methane level of 1958 ppb on October 25, 2021 am at 295 mb. When using a 1-year GWP of 200, this translates into 391.6 ppm CO₂e. Together with a global mean CO₂ level of 420 ppm, that's 811.6 ppm CO₂e, i.e. only 388.4 ppm CO₂e away from the 1200 ppm CO₂e clouds tipping point. 

The image on the right shows a trend based pointing at a methane level of almost 4000 ppb by end 2026, from an earlier post.

Alternatively, an additional 5 Gt of methane from abrupt release from the seafloor could raise the global mean methane concentration by about 2000 ppb, and even earlier than 2026.

At a 1-year GWP of 200, an extra 2000 ppb would translate into an extra 400 ppm CO₂e, thus pushing the joint impact of just two greenhouse gases (carbon dioxide and methane) above the 1200 ppm CO₂e clouds tipping point and raising the global temperature by 8°C due to the clouds feedback alone, i.e. on top of the additional rise caused by other warming elements, as further discussed below.


Seafloor methane eruptions could trigger a huge temperature rise 

Warnings about the potential for seafloor methane releases have been given repeatedly, such as in this 2017 analysis, in this 2019 analysis (image below) and in a recent analysis (2022). Researchers in 2019 found amounts of methane in the air over the East Siberian Sea up to nine times the global average.


2021 analysis indicates that massive methane seepage from the seafloor of the Arctic Ocean occurred during ice sheet wastage over the last and penultimate deglaciation periods (i.e. the Holocene, ~20-15 ka, respectively the Eemian, ~140-130 ka).

At the time, seafloor methane entering the atmosphere could be accommodated without resulting in huge temperature rises, because such releases were spread out over relatively long periods, while the level of methane in the atmosphere at the time was relatively low and since the lifetime of methane is limited to a decade or so. 

Today, circumstances are much more dire in many respects. While high heat peaks may have occurred locally during the last and penultimate deglaciation, today's global mean temperature is higher, as James Hansen et al., confirmed in a 2017 analysis. Furthermore, a 2012 analysis indicates that oceanic heat transport to the Arctic today is higher.

Greenhouse gas levels are very high at the moment and their rise is accelerating. As a result of the rapidity of today's rise, new seafloor methane eruptions can occur while previous methane releases haven't yet been broken down in the atmosphere. 
  
Seafloor methane eruptions can thus trigger a huge temperature rise, as illustrated by the image on the right, from the extinction page


Conclusions

The situation is dire and calls for the most comprehensive and effective action, as described at the Climate Plan.


Links

• NOAA - globally averaged marine surface monthly mean methane data
https://gml.noaa.gov/webdata/ccgg/trends/ch4/ch4_mm_gl.txt

• NOAA - globally averaged marine surface annual mean methane growth rates
https://gml.noaa.gov/webdata/ccgg/trends/ch4/ch4_gr_gl.txt

• NOAA - Infrared Atmospheric Sounding Interferometer (IASI) Sounding Products (MetOp-B)
https://www.ospo.noaa.gov/Products/atmosphere/soundings/iasi

• NOAA - Trends in Atmospheric Carbon Dioxide
https://gml.noaa.gov/ccgg/trends/gl_trend.html

• NOAA - Carbon Cycle Gases, Barrow Atmospheric Baseline Observatory, United States
https://gml.noaa.gov/dv/iadv/graph.php?code=BRW

• NOAA - Trends in Atmospheric Carbon Dioxide, Mauna Loa, Hawaii
https://gml.noaa.gov/ccgg/trends/graph.html

• Clouds feedback
https://arctic-news.blogspot.com/p/clouds-feedback.html

• Human Extinction by 2022?
https://arctic-news.blogspot.com/2021/11/human-extinction-by-2022.html

• Terrifying Arctic methane levels
https://arctic-news.blogspot.com/2021/12/terrifying-arctic-methane-levels.html

• Terrifying Arctic methane levels continue
https://arctic-news.blogspot.com/2022/01/terrifying-arctic-greenhouse-gas-levels-continue.html

• Current rates and mechanisms of subsea permafrost degradation in the East Siberian Arctic Shelf - by Nataia Shakhova et al. (2017)
https://www.nature.com/articles/ncomms15872

• Understanding the Permafrost–Hydrate System and Associated Methane Releases in the East Siberian Arctic Shelf - by Nataia Shakhova et al. (2019)
https://www.mdpi.com/2076-3263/9/6/251

• CNN - Russian scientists say they've found the highest-ever 'flares' of methane in Arctic waters
https://edition.cnn.com/2019/10/12/us/arctic-methane-gas-flare-trnd/index.html

• In-situ temperatures and thermal properties of the East Siberian Arctic shelf sediments: Key input for understanding the dynamics of subsea permafrost - by Evgeny Chuvilin et al. (2022)
https://www.sciencedirect.com/science/article/abs/pii/S0264817222000289

• When Will We Die?
https://arctic-news.blogspot.com/2019/06/when-will-we-die.html

• Arctic methane release due to melting ice is likely to happen again 
https://www.geosociety.org/GSA/News/pr/2021/21-15.aspx

• Ice-sheet melt drove methane emissions in the Arctic during the last two interglacials - by Pierre-Antoine Dessandier et al. (2021)
https://pubs.geoscienceworld.org/gsa/geology/article-abstract/49/7/799/595627/Ice-sheet-melt-drove-methane-emissions-in-the

• Contrasting ocean changes between the subpolar and polar North Atlantic during the past 135 ka - by Henning Bauch et al. (2012) 
https://agupubs.onlinelibrary.wiley.com/doi/full/10.1029/2012GL051800

• Young people's burden - by James Hansen et al. 

• Extinction

• Climate Plan