 |
| [ Temperature anomaly through February 2025 ] |
The temperature anomaly is rising rapidly, the red line (2-year Lowess Smoothing trend) points at a 2°C rise in 2026 (compared to 1903-1924, which - as said - is not pre-industrial).

As the above image shows, the February 2025 temperature anomalies were particularly high over the Arctic, as high as 11.7°C and reflecting very high temperatures of the water of the Arctic Ocean. This is a very dangerous situation, as discussed elsewhere in this post.
The image below confirms the very high Arctic temperature anomalies in February 2025.

The image below illustrates the threat of a huge temperature rise. The red trend warns that the temperature could increase at a terrifying speed soon. The global surface air temperature was 13.87°C on March 8, 2025, the highest temperature on record for this day. This is the more remarkable since this record high temperature was reached during a La Niña.


The shading in the above image highlights the difference between El Niño conditions (pink shading) and La Niña conditions (blue shading). An El Niño pushes up temperatures, whereas La Niña suppresses temperatures. We're currently in a La Niña, so temperatures are suppressed, but this is predicted to end soon. NOAA predicts a transition away from La Niña to occur next month.
The transition from La Niña to El Niño is only one out of ten mechanisms that could jointly cause the temperature rise to accelerate dramatically in a matter of months, as described in a previous post. Another one of these mechanisms is the increase in greenhouse gas concentrations.
Increase in carbon dioxide
The daily average carbon dioxide (CO₂) at Mauna Loa, Hawaii, was 430.60 parts per million (ppm) on March 7, 2025, the highest daily average on record. To find higher levels, one needs to go back millions of years.
 Carbon dioxide typically reaches its annual maximum in May, which means that even higher daily averages can be expected over the next few months. The image below shows that this reading of 430.6 ppm at Mauna Loa is way higher than the highest daily averages recorded in 2024.

In addition, the high angle of the Sun produces long days, while the sunlight is also concentrated over a smaller area. Above the Arctic Circle, the Sun does not set at this time of year, so solar radiation continues all day and night. During the months of June and July, insolation over the Arctic is higher than anywhere else on Earth.
Another mechanism is sunspots, which are predicted to reach a peak in this cycle in July 2025 and sunspots to date in this cycle are higher than predicted.
Increase in carbon dioxide


The image below shows the daily average for March 7, 2025, marked in blue and with an arrow pointing at it. The image shows that weekly averages are also at a record high, 428.1 ppm, higher than the highest weekly average in 2024. The monthly average for February 2025 was 427.09 ppm, higher than the highest monthly average in 2024.

The above trend illustrates that the clouds tipping point could get crossed in early 2032 due to rising CO₂ alone, which on its own could push temperatures up by an additional 8°C. The clouds tipping point is actually at 1200 ppm CO₂e, so when growth of other greenhouse gases and further mechanisms is taken into account, the tipping point could be crossed much earlier than in 2033.
Increase in methane
Methane in the atmosphere could be doubled soon if a trend unfolds as depicted in the image below. A rapid rise is highlighted in the inset and reflected in the trend.
The trend is based on 22 consecutive global monthly averages as calculated by NOAA (from January 2023 through October 2024) and has a R-squared value of 1, indicating that the trend constitutes a perfect fit of the data.
The period of 22 months was selected as the resulting trend strongly reflects the steep rise in methane that took place over the four most recent months for which data are available (as highlighted in the inset on the image). One could argue that seasonal variations could reduce the growth over the coming months, but on the other hand, a huge rise in methane could occur soon due to eruptions of methane from clathrates at the seafloor of the Arctic Ocean.
The trend points at a doubling of methane by March 2026. If the trend would continue, methane concentrations in the atmosphere would by September 2026 increase to more than triple the most recent value, and would increase to more than fourfold the most recent value by the end of 2026.
At the moment, more sunlight reaches the Southern Hemisphere than the Northern Hemisphere. Consequently, low sea ice on the Southern Hemisphere results in a lot less sunlight getting reflected back into space and a lot more sunlight instead getting absorbed by the surface globally.

Sea ice extent is the total region with at least 15% sea ice cover. Sea ice extent can include holes or cracks in the sea ice and melt ponds on top of the ice, all having a darker color than ice. Sea ice area is the total region covered by ice alone. Sea ice area (image below) is a more critical measure in regard to albedo than sea ice extent (image on the right), so it makes sense to look at sea ice area, rather than at sea ice extent.
Over the next few months, the state of Arctic sea ice will become progressively more important regarding reflectivity, as progressively more sunlight will reach the Northern Hemisphere with the change in seasons. The temperature of the water of the Arctic Ocean could rise dramatically due to low Arctic sea ice.

The annual increase in CO₂ at Mauna Loa, Hawaii, is accelerating, as illustrated by the image below.
 |
| [ click on images to enlarge ] |
A trend, based on 2015-2024 annual data, points at 1200 ppm CO₂ getting crossed in the year 2032, as illustrated by the image below.
 |
| [ from an earlier post ] |
Increase in methane
Methane in the atmosphere could be doubled soon if a trend unfolds as depicted in the image below. A rapid rise is highlighted in the inset and reflected in the trend.
 |
| [ from earlier post ] |
The period of 22 months was selected as the resulting trend strongly reflects the steep rise in methane that took place over the four most recent months for which data are available (as highlighted in the inset on the image). One could argue that seasonal variations could reduce the growth over the coming months, but on the other hand, a huge rise in methane could occur soon due to eruptions of methane from clathrates at the seafloor of the Arctic Ocean.
The trend points at a doubling of methane by March 2026. If the trend would continue, methane concentrations in the atmosphere would by September 2026 increase to more than triple the most recent value, and would increase to more than fourfold the most recent value by the end of 2026.
A rise like the one depicted in the trend could eventuate as rising ocean heat destabilizes methane hydrates contained in sediments at the seafloor of the Arctic Ocean. The temperature rise in the Arctic would accelerate since the methane would have a huge immediate impact on temperatures over the Arctic and cause depletion of hydroxyl, of which there is very little in the atmosphere over the Arctic in the first place. Such a rise in methane would also dramatically increases in tropospheric ozone and in stratospheric water vapor. A large increase in methane over the Arctic would also trigger massive wildfires and devastate terrestrial permafrost, resulting in huge amounts of further emissions.
Sea ice loss
The image below illustrates that global sea ice area has been at a record daily low since the start of February 2025.

 |
| [ Arctic sea ice extent, click to enlarge ] |

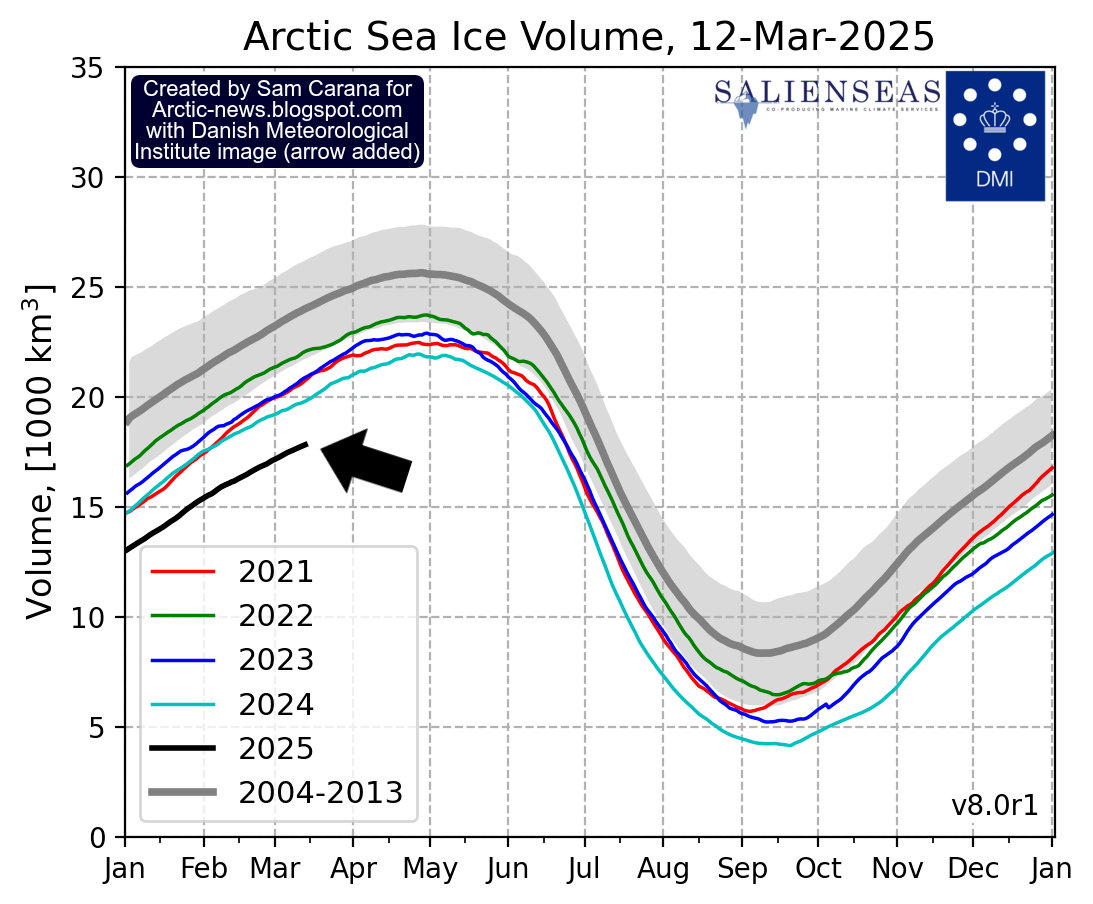 |
| [ Arctic sea ice volume, click to enlarge ] |
Warmer water flowing into the Arctic Ocean causes Arctic sea ice to shrink not only in extent and area, but even more so in thickness and thus volume, diminishing its capacity to act as a buffer that consumes ocean heat entering the Arctic Ocean from the North Atlantic and from the Pacific Ocean.
As sea ice thickness decreases, less incoming ocean heat can be consumed by melting the sea ice from below, while ocean heat is rising. An increasing proportion of the incoming ocean heat will therefore contribute to higher temperatures of the water of the Arctic Ocean. There is a point beyond which the rise in ocean heat will accelerate dramatically.
As sea ice thickness decreases, less incoming ocean heat can be consumed by melting the sea ice from below, while ocean heat is rising. An increasing proportion of the incoming ocean heat will therefore contribute to higher temperatures of the water of the Arctic Ocean. There is a point beyond which the rise in ocean heat will accelerate dramatically.

Similarly, there is a point beyond which thawing of permafrost on land and melting of glaciers can no longer consume heat, and all further heat will instead warm up the surface.
 |
| [ from earlier post ] |
The Sun will reach its most northerly position on June 21, 2025 (Solstice). Around this time of year, the sunlight has less distance to travel through the thinner atmosphere over the Arctic, so less sunlight gets absorbed or scattered before reaching the surface.
 |
| [ from Insolation ] |
Further mechanisms
Another mechanism is sunspots, which are predicted to reach a peak in this cycle in July 2025 and sunspots to date in this cycle are higher than predicted.
Yet another mechanism is reductions in cooling aerosols. According to James Hansen et al. (2023), reductions in cooling aerosols from shipping may well be responsible for much of the acceleration in the recent rise in temperature and the increase in the Earth's Energy Imbalance.
For more on mechanisms, see also the earlier post Mechanisms behind a steep rise in temperature.
Climate Emergency Declaration
The situation is dire and the precautionary principle calls for rapid, comprehensive and effective climate action to reduce the damage and to improve the situation, as described in this 2022 post, where needed in combination with a Climate Emergency Declaration, as discussed at this group.

Links
• NASA - Goddard Institute for Space Studies - surface temperature
https://data.giss.nasa.gov/gistemp
• Climate Reanalyzer
https://climatereanalyzer.org
• pre-industrial
https://arctic-news.blogspot.com/p/pre-industrial.html
• Extinction
https://arctic-news.blogspot.com/p/extinction.html
• Global surface air temperature
https://pulse.climate.copernicus.eu
• NOAA - Global Monitoring Laboratory - monthly trends in CO₂
https://gml.noaa.gov/ccgg/trends/monthly.html
https://gml.noaa.gov/ccgg/trends/monthly.html
• NOAA - Global Monitoring Laboratory
• Albedo
https://arctic-news.blogspot.com/p/albedo.html
• Insolation
https://arctic-news.blogspot.com/p/insolation.html
• Sunspots
https://arctic-news.blogspot.com/p/sunspots.html
• Global warming in the pipeline - by James Hansen et al. (2023)
https://gml.noaa.gov/dv/iadv/graph.php?code=MLO&program=ccgg&type=ts
• Clouds tipping point
https://arctic-news.blogspot.com/p/clouds-feedback.html
• Kevin Pluck - seaice.visuals.earth
https://seaice.visuals.earth
• NSIDC - National Snow and Ice Data Center
https://nsidc.org
• Danish Meteorological Institute - Arctic sea ice volume and thickness
https://ocean.dmi.dk/arctic/icethickness/thk.uk.php
• Albedo
https://arctic-news.blogspot.com/p/albedo.html
• Insolation
https://arctic-news.blogspot.com/p/insolation.html
• Sunspots
https://arctic-news.blogspot.com/p/sunspots.html
• Global warming in the pipeline - by James Hansen et al. (2023)
https://academic.oup.com/oocc/article/3/1/kgad008/7335889
• Carbon dioxide growing rapidly
https://arctic-news.blogspot.com/2024/08/carbon-dioxide-growing-rapidly.html
• Double Blue Ocean Event 2025?
https://arctic-news.blogspot.com/2024/10/double-blue-ocean-event-2025.html
• Did a Terminal Temperature Acceleration Event start in December 2024?
https://arctic-news.blogspot.com/2024/12/did-a-terminal-temperature-acceleration-event-start-in-december-2024.html
• Transforming Society
https://arctic-news.blogspot.com/2022/10/transforming-society.html
• Climate Plan
https://arctic-news.blogspot.com/p/climateplan.html
• Climate Emergency Declaration
https://arctic-news.blogspot.com/p/climate-emergency-declaration.html


