Showing posts with label extinction. Show all posts

Friday, August 7, 2026

Record high temperatures

Record high global surface air temperature for the time of year

On August 15, 2026, the global surface air temperature was 17.05°C, the highest temperature on record for this day of the year. The globe (inset) shows the global temperature anomaly vs 1991-2020 on August 15, 2026, with anomalies showing up higher than 12°C and with Antarctica and sea ice around Antarctica getting hit by very high (as well as low) temperature anomalies.


Record high Northern Hemisphere surface air temperature 

Land temperatures are rising faster than ocean temperatures. The Northern Hemisphere is heating up faster than the Southern Hemisphere, since the Northern Hemisphere has more land. On August 1, 2026, a record high temperature of 22.4°C was reached in the Northern Hemisphere, 1.45°C higher than 1979-2000, as illustrated by the image below. The globe (inset) shows temperature anomalies versus 1991-2020 on August 1, 2026, with the Northern Hemisphere highlighted.

[ click on images to enlarge ]

On August 12, 2026, the Northern Hemisphere temperature was 22.57°C, a record high for the day of the year and 1.48°C higher than 1979-2000, as illustrated by the image below. The globe (inset) shows temperature anomalies versus 1991-2020 on August 12, 2026, with the Northern Hemisphere highlighted.


The above anomalies are not calculated from pre-industrial. Another threshold is the wet-bulb temperature threshold, at which the human body can no longer cool down by sweating even in strong wind.

The image below shows a forecast for July 26, 2026, 21:00 UTC. The image shows a temperature of 122°F (50°C) at a location near Death Valley with a relative humidity of 9% resulting in a wet bulb globe temperature of 95°F (35°C). At the same time, a temperature of 116°F (47°C) with a relative humidity of 20% results in a wet bulb globe temperature of 97°F (36°C) at a location in the south of California.

[ Wet-bulb threshold crossed, image from earlier post ]
The wet-bulb globe temperature is measured in direct sunlight, whereas the wet-bulb temperature is measured in the shade. The wet-bulb temperature threshold can be reached or exceeded by a combination of temperature and humidity, and it is the maximum, the absolute physiological limit, that a human can endure as a peak. It was long assumed that reaching such a limit would require a large increase in global temperature. However, a 2020 study (led by Raymond) warns that this limit could be regularly exceeded with a temperature rise of less than 2.5°C above pre-industrial. As the above image indicates, the wet bulb globe temperature limit can already be reached or even exceeded now.

Furthermore, a 2022 study (led by Vecellio) finds that the actual limit can be much lower — about 31°C wet-bulb or 87°F at 100% humidity — even for young, healthy subjects. The temperature for older populations, who are more vulnerable to heat, is likely even lower. In practice the limit will typically be lower and depending on circumstances could be as low as a wet-bulb temperature of 25°C.

Record high sea surface temperature 

As illustrated by the image below, from an earlier post, the world (60°S–60°N, 0–360°E) sea surface temperature was 21.2°C on August 5, 2026, a record high temperature and 0.99°C higher than 1982-2010 (which is not pre-industrial). The globe (inset bottom left) shows sea surface temperature anomalies versus 1991-2020 on August 5, 2026.


Ocean heat is getting pushed along the path of the Gulf Stream from the North Atlantic through the Fram Strait into the Arctic Ocean and - to a lesser extent - from the North Pacific through the Bering Strait into the Arctic Ocean.

The image below shows sea surface temperature anomalies on August 9, 2026.  


The image below, adapted from NOAA, shows sea surface temperatures as high as 33.6°C (or 92.48°F) around North America on August 17, 2026. The image also illustrates geographic conditions facilitating the Gulf Stream to push ocean heat north in the Atlantic Ocean toward the Arctic.

[ Sea surface temperatures as high as 33.6°C on August 17, 2026 - click on images to enlarge ]

The image on the right shows a surface temperature of 23.1°C or 73.5°F recorded at a location on Greenland marked by the green circle on August 5, 2026.

As air temperatures and sea surface temperatures rise at higher latitudes, the danger increases that a huge amount of warm, salty water suddenly gets pushed into the Arctic Ocean by a cyclone, destabilizing sediments at the seafloor and triggering eruptions of methane from hydrates.

This danger has been discussed in many earlier posts such as this 2018 post.

The combination image below shows a nullschool.net image with a sea surface temperature of 4.6°C or 40.3°F recorded at the green circle on August 8, 2026 (left), and Northern Hemisphere maximum temperature on August 9, 2026 (right).


Sea ice 

Rising temperatures threaten to unleash a Double Blue Ocean Event

The combination image below shows Arctic sea ice concentration on August 8, 2026 (left), and Arctic sea ice thickness on August 8, 2026 (right). 


The high temperatures that are recorded in many places in August 2026 are not restricted to the Northern Hemisphere. The image below shows that a temperature of 42°C or 107.6°F is forecast to hit a location in Paraguay (marked by the green circle) while it is winter in the Southern Hemisphere, on August 17, 2026.


On August 13, 2026, the global sea ice area was 15.56 million km², the second lowest on record for that day and a deviation of -5.07σ, as illustrated by the image below. The year 2026 is highlighted in black, the year 2025 is highlighted in blue and the years 2023 and 2024 are highlighted in purple. 


The combination image below shows Antarctic sea ice concentration on August 12, 2026. The image on the right also shows the median ice edge 1981-2010. 


On August 13, 2026, Antarctic sea ice area was 2 million km² lower than 1981-2010, the second lowest on record for that day and a deviation of -4.44σ, as illustrated by the image below. The year 2026 is highlighted in black, the year 2023 is highlighted in blue and the year 2016 is highlighted in purple. 


Both 2016 and 2023 were strong El Niño years and the 2026 El Niño is on track to become even stronger, as discussed below. 

El Niño

The image below, from NOAA, shows an outlook of the 2026 El Niño strength and probabilities, issued August 2026.


The image below shows that the sea surface temperature in the Nino3.4 region was 29.65°C on August 9, 2026, 2.87°C higher than 1982-2010 and a jump of 3.9°C in a span of 7 months from the 25.75°C recorded on January 9, 2026. The globe (inset bottom) shows sea surface temperature anomalies versus 1991-2020 on August 9, 2026 with the Nino3.4 region highlighted in the Pacific Ocean.


Back in March 2026, La Niña was dominant, but this time what is forecast to be the strongest El Niño on record is present and it is strengthening, with the potential to unleash a Double Blue Ocean Event, an Arctic Blue Ocean Event in 2026 followed by an Antarctic Blue Ocean Event in early 2027.


The above image is adapted from Climate Reanalyzer and shows sea surface temperature anomalies versus 1951-1980 over the years in the Niño3.4 region, a region in the Pacific Ocean that is indicative for El Niño strength. The image has a potential 2026 El Niño anomaly of more than 3.5°C added (red dashed line on the right) to highlight the danger that a Double Blue Ocean Event will occur. For more on the 2026 El Niño also see this earlier post


The above image shows the global monthly temperature anomaly versus 1951-1980 through July 2026. 


The above image shows the July 2026 temperature anomaly versus 1951-1980, with very high anomalies showing up over and around Antarctica. 

[ click on images to enlarge, image from earlier post ]
The above image, from Berkeley Earth Temperature Report for 2024, illustrates the importance of Antarctic Sea ice loss in accelerating the temperature rise in 2020-2023 compared to 2010-2019. The red color shows an area with an extra radiative forcing of +2.1 W/m², which is primarily the result of Antarctic sea ice loss. This +2.1 W/m² is about as much as forcing as the change caused by all CO² released by people from 1750 to 2019, according to IPCC AR6 figures (image right, from earlier post).

Antarctic sea ice area was only 1.09 million km² on February 22, 2023, very close to the 1 million km² threshold when a Blue Ocean Event could be called, as illustrated by the image on the right, from an earlier post.

El Niño could trigger huge rise

Land temperatures are rising faster than ocean temperatures. The image below shows NASA Land-Only annual anomalies versus 1880-1890 (not pre-industrial) through 2025. 


The above image shows that 1.5°C was crossed on land for each month since 2009 (black squares). The Lowess 3-year smoothing trend (red line) indicates that 2°C was crossed on land in 2021 and that 3°C may get crossed on land soon, possibly before 2030 if this trend continues (dashed red extension), or even as early as end 2026, triggered by El Niño (see image below).

As said, land temperatures are rising faster than ocean temperatures. The Northern Hemisphere is heating up faster than the Southern Hemisphere, since the Northern Hemisphere has more land. The image below shows NOAA temperature anomalies versus 1901-2000 (not pre-industrial) on land in the Northern Hemisphere through July 2026 with a polynomial trend added. The image should act as a warning, illustrating the danger that the strengthening 2026 El Niño could trigger a rapid and steep rise in temperature on land in the Northern Hemisphere in late 2026 that could cross the 3°C threshold.


Human extinction

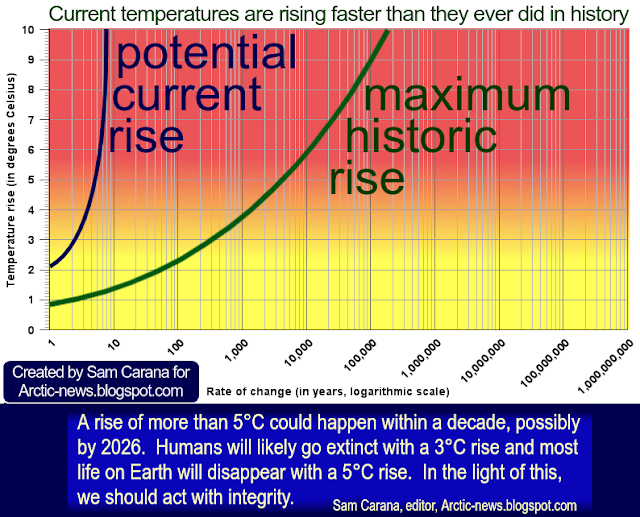
Most people live on land in the Northern Hemisphere. A 2019 post discussed a 2018 study (by Strona & Bradshaw) indicating that most life on Earth will disappear with a 5°C rise. What does this mean for humans? Terrestrial vertebrates are more in danger than many other species, since they depend on numerous other species for food. Humans are terrestrial vertebrates and humans are also large warm-blooded mammals with high metabolic rates, thus requiring more habitat. It also takes a long time for humans to reach maturity. Additionally, humans have become addicted to processed food, fossil fuels, plastic, etc. Furthermore, humans require large amounts of fresh water, including for sweating when temperatures rise. Therefore, a temperature rise of more than 3°C may be fatal for many species such as humans. In other words, a 3°C rise may suffice to cause human extinction, as warned about in earlier posts such as this one. The image below highlights the existential danger for humans.
As temperatures rise, the outlook is widespread crop loss and shortages of fresh water. Temperatures are rising too fast for forests to adapt by moving to higher latitudes. It takes centuries for tree populations to adapt—far too slow to keep pace with today’s rapid warming. Merely planting trees may not help much if the soil lacks ectomycorrhizal fungi, as discussed in an earlier post. Rapidly transforming society could improve the outlook, but - sadly - this currently doesn't have much government support.

Conclusion

The situation is dire and unacceptably dangerous, and the precautionary principle necessitates the danger to be acknowledged, while facilitating rapid, comprehensive and effective action to reduce the damage and to improve the outlook, where needed in combination with a Climate Emergency Declaration, as described in posts such as in this 2022 post and this 2025 post, and as discussed in the Climate Plan group.


Links

• Climate Reanalyzer
https://climatereanalyzer.org

• NASA - Goddard Institute for Space Studies
https://data.giss.nasa.gov/gistemp


• NOAA - Sea Surface Temperature Contour Charts
https://www.ospo.noaa.gov/products/ocean/sst/contour/index.html

• NOAA - ENSO strength probabiliities
https://cpc.ncep.noaa.gov/products/analysis_monitoring/enso/roni/strengths

• Nullschool.net
https://earth.nullschool.net

• NSIDC - National Snow and Ice Data Center
https://www.nsidc.org

• Rising temperature threatens to devastate sea ice 


• Double Blue Ocean Event

• Double Blue Ocean Event 2026-2027? - update

• Antarctica


Sunday, September 14, 2025

El Nino 2026, extinction?

El Niño-Southern Oscillation (ENSO) is a climate pattern that fluctuates from El Niño to La Niña conditions and back. El Niño raises temperatures, whereas La Niña suppresses temperatures. This year, there have been neutral to La Niña conditions, as illustrated by the image below, which also shows that over the past few months, there has been a zigzag pattern of rises and falls around the mean sea surface temperature in Niño 3.4, an area in the Pacific (inset) that is critical to the development of El Niño. 


    [ click on images to enlarge ]
On September 13, 2025, the temperature reached an anomaly in this area of -0.54°C versus 1991-2020, indicating that La Niña conditions are likely to dominate late 2025/early 2026. The inset on the above image shows the Niño 3.4 area and sea surface temperature anomalies versus 1991-2020 on that day.

The image on the right, adapted from NOAA, shows the ENSO outlook (CFSv2 ensemble mean, black dashed line) favoring La Niña late 2025/early 2026. 

[ image from earlier post ]
The image on the right, adapted from ECMWF, shows an ENSO forecast for developments in Niño3.4 through August 2026, indicating that the next El Niño may emerge early 2026 and grow in strength in the course of 2026.

Rising temperature in absence of El Niño

Critical is the temperature on land, which is after all where people live. The image below shows that in 2025, monthly temperature anomalies (from 1880-1920) on land have fallen from a high of +2.93°C in January 2025 to +1.45°C in July 2025, in line with the temperature suppression that comes with a move into La Niña. 


The anomaly was +2.93°C in January 2025, very close to +3°C. Note that when using a genuinely pre-industrial base, anomalies can be much higher than depicted in the above image. While anomalies have come down somewhat, the anomaly rose again to +1.82°C in August 2025, which could indicate that acceleration of the temperature rise is overwhelming the temperature suppression that comes with a move into La Niña. 

The sea surface temperature anomaly keeps rising, in particular from the latitudes of 30° and higher north, as illustrated by the image below. 


Adding to fears that the temperature rise is accelerating despite the absence of El Niño is the most recent rise of the global temperature anomaly. As illustrated by the image below, the global temperature anomaly versus 1991-2020 has risen strongly recently, from +0.21°C on July 4, 2025, to +0.83°C on September 20, 2025. 


A +3°C temperature rise constitutes an important threshold, since humans will likely go extinct with such a rise, as illustrated by the image below. 
[ from the post When will humans go extinct? ]
   [ from: When Will We Die? ]
Recent research led by David Fastivich finds that, historically, vegetation responded at timescales from hundreds to tens of thousands of years, but not at timescales shorter than about 150 years. It takes centuries for tree populations to adapt - far too slow to keep pace with today’s rapidly warming world.

Note that healthy vegetation relies not only on temperature, but also on the presence of good soil, microbes, rain, soil nutrients, pollinators, habitat, groundwater and an absence of toxic waste, pests and diseases.

A 2018 study by Strona & Bradshaw indicates that most life on Earth will disappear with a 5°C rise (see box on the right). Humans, who depend on a lot of other species, will likely go extinct with a 3°C rise, as discussed in the earlier post When Will We Die?

The map below shows the size of the population rather than the size of the territory, decreasing the size of Canada, Mongolia, Australia, and Russia, and highlighting how many people are vulnerable to heat stress.

[ cartogram from Ourworldindata.org - click to enlarge ]

In the video below, Herb Simmens discussed the situation with Peter Carter and Paul Beckwith


Climate Emergency Declaration

The temperature rise is accelerating and the rise could accelerate even more due to decreases in buffers (as described in earlier posts such as this one), due to strengthening feedbacks, especially during an El Niño, and due to further reduction of the aerosol masking effect, which are all developments that could rapidly speed up existing feedbacks and trigger new feedbacks.

The situation is dire and the precautionary principle calls for rapid, comprehensive and effective action to reduce the damage and to improve the situation, as described in this 2022 post, where needed in combination with a Climate Emergency Declaration, as discussed at this group.


Links

• Climate Reanalyzer
https://climatereanalyzer.org

• NOAA - Climate Prediction Center - ENSO: Recent Evolution, Current Status and Predictions
https://www.cpc.ncep.noaa.gov/products/analysis_monitoring/lanina/enso_evolution-status-fcsts-web.pdf

• ECMWF - El Niño forecast
https://charts.ecmwf.int/products/seasonal_system5_nino_annual_plumes

• NASA - surface temperature analysis - gistemp 
https://data.giss.nasa.gov/gistemp

• When Will We Die?
https://arctic-news.blogspot.com/2019/06/when-will-we-die.html

• Population cartogram
https://ourworldindata.org/world-population-cartogram

Saturday, July 12, 2025

Will humans go extinct soon?

The image below shows the June 2025 temperature anomaly versus 1951-1980, using ERA5 data.

[ June 2025 temperature anomaly, click on images to enlarge ]
    [ from earlier post, click to enlarge ]
The above image shows relatively low anomalies over the Arctic Ocean, with a relatively cool area persisting in the North Atlantic, south of Greenland. This appears to reflect heavy melting, slowing down of the Atlantic Meridional Overturning Circulation (AMOC) and strong evaporation followed by more rainfall further down the track of the Gulf Stream, as illustrated by the image on the right.

The above image also shows high anomalies over parts of Antarctica and Antarctic sea ice. This appears to reflect changes to the Southern Meridional Overturning Circulation (SMOC).

Rising temperatures result in a loss of carbon storage, concludes a recent study led by Thomas Werner into marine heatwaves. 

   [ marine heatwave in North Pacific ]
The image on the right shows that the sea surface temperature was as much as 7.5°C (13.4°F) higher than 1981-2011 on July 16, 2025, 12:00 UTC, at the location marked by the green circle, reflecting a strong marine heatwave in the North Pacific. The image also shows a distorted Jet Stream (at 250 hPa).

Covering more than 70% of Earth’s surface, our global ocean has absorbed 90% of the warming that has occurred in recent decades due to increasing greenhouse gases, and the top few meters of the ocean store as much heat as Earth's entire atmosphere, as described by a NASA post

A small reduction in the 90% uptake of heat by oceans could result in a huge rise in the global air temperature, and studies warn about changes that are occurring in the AMOC and SMOC, as discussed in earlier posts such as this one. Such feedbacks could strike hard very rapidly, i.e. as fast feedbacks. 

The IPCC (AR6 WG1 SPM page 11) uses an equilibrium climate sensitivity of 3°C, but James Hansen says fast-feedback equilibrium climate sensitivity is 4.8°C and equilibrium global warming for today’s amount of greenhouse gases (4.1 W/m²) is 10°C, which includes a 2°C rise that would eventuate by the falling away of the aerosols that currently mask the temperature rise. 

A 2024 study led by Judd finds that climate sensitivity has historically been about 8°C. 

[ Temperature rise vs 1901-2000 (ClimateReanalyzer) and vs 1850-1900 (IPCC, inset left) ]

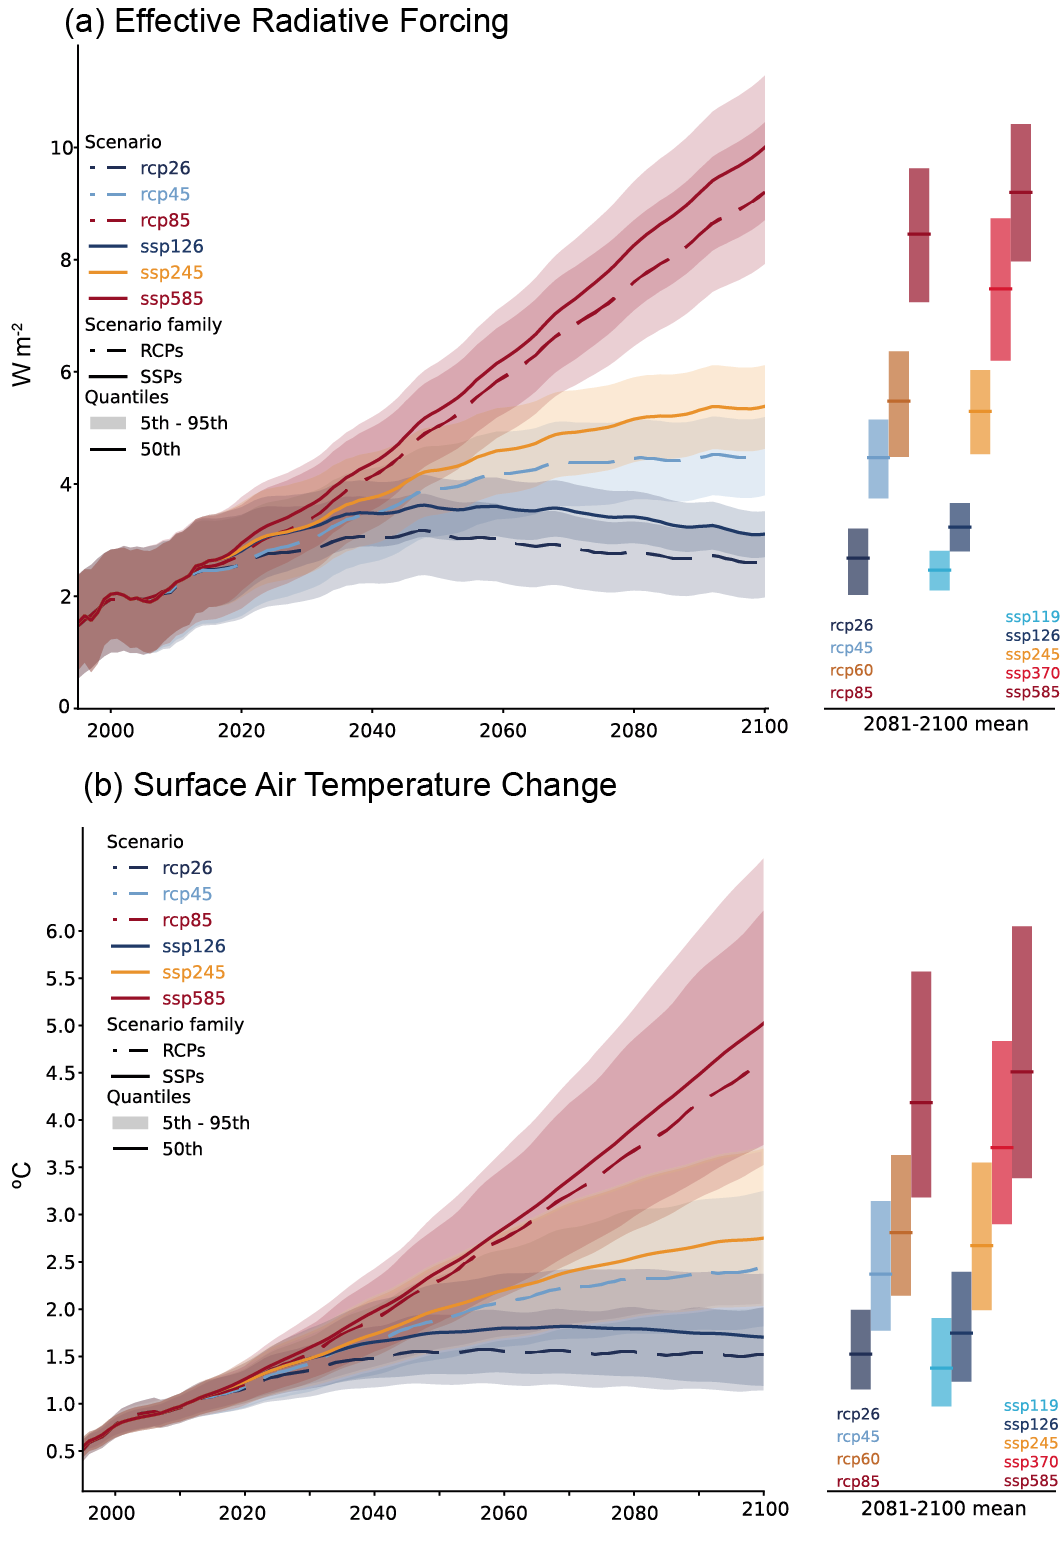
The IPCC appears to be downplaying the temperature rise in multiple ways, including by using linear trends, a late baseline and a low climate sensitivity, to give the false impression that polluters could continue to pollute for decades to come. 
 
The above images illustrate what the world would look like under a CMIP6 SSP5-8.5 scenario by February 2100, compared to 1891-1910. Obviously, such a rise would devastate sea ice and permafrost, triggering and accelerating numerous feedbacks, resulting in widespread forest fires and releases of greenhouse gases.


The 36-month running average for albedo (reflectivity) for May 2025 is down to a record low of 28.711%, as illustrated by the above Eliot Jacobson image.


The 36-month running mean for the Earth energy imbalance grew in May 2025 to 11.36 Hiroshimas per second. That's roughly 980,000 Hiroshimas per day in planetary warming, adds Eliot Jacobson.

As said, the IPCC keeps downplaying the potential impact of feedbacks such as changes to ocean currents, wind patterns, clouds and water vapor, and loss of sea ice and permafrost, thus failing to warn people about a near-future in which temperatures could rise strongly due to such feedbacks, especially during an El Niño, and due to further reduction of the aerosol masking effect, developments that could rapidly speed up existing feedbacks and trigger new feedbacks, resulting in more extreme weather events striking with a ferocity, frequency and ubiquity that keeps increasing at an accelerating pace.

   [ NOAA ENSO outlook ]
The updated ENSO outlook (CFSv2 ensemble mean, black dashed line, image on the right, adapted from NOAA) favors borderline La Niña during the Northern Hemisphere fall and early winter 2025-2026.

The image below illustrates the outlook of borderline La Niña for the Northern Hemisphere fall and early winter 2025-2026. On July 29, 2025, the average temperature in Niño 3.4, an area in the Pacific that is indicative for El Niño development (inset), had fallen to 26.7°C, an anomaly of -0.35°C from 1991-2020.


The current ENSO conditions make it even more significant that on July 14, 2025, the global temperature was 16.86°C, i.e. higher than the temperature was in 2023 or 2024 on this day, as illustrated by the image below, adapted from Climate Reanalyzer. 


The earlier image below shows a preliminary 16.85°C that was later upgraded to 16.86°C (final). The point is that this is a record high for that day and 0.3°C below the highest daily temperature on record (17.16°C) that was reached on July 22, 2024 (image adapted from Copernicus).

The image below shows monthly temperature anomalies through June 2025, based on ERA5 anomalies vs 1951-1980 from Jan 2014-June 2025 (red circles). 
In the above image, data are adjusted by 1°C to reflect a pre-industrial base (black circles). Cubic trends are added to show that 3°C could be crossed late 2028 (red) or early 2027 (black). 

The image below shows surface air temperature anomalies April 1, 2023, through July 14, 2025 (final), with a red trend added that warns about a potentially huge temperature rise later in 2025.


Furthermore, sea surface temperatures are on the rise again. The image below shows the global sea surface temperature through July 20, 2025 (60°S–60°N, 0–360°E).


How much could temperatures rise? The image below is a combination image. The top image shows a trend based on annual sea surface temperature anomalies in the Northern Hemisphere through 2022. The bottom image shows a trend based on annual sea surface temperature anomalies in the Northern Hemisphere through 2023. The trend in the bottom image shows an even steeper rise than the trend in the top image. This shows that a polynomial trend can sometimes be a good indicator of the rise to come.


The current ENSO conditions also make it even more significant that the global sea ice area anomaly was 2.56 million km² below the 1981-2010 mean on July 30, 2025, a standard deviation of -4.33σ from 1981-2010.
Global sea ice extent was 21.92 million km² on July 31, 2025, a deviation of -4.88σ, as illustrated by the image below. 


Arctic sea ice volume was at a record daily low on August 3, 2025, as it has been for more than a year, as illustrated by the image below.

The image below shows Arctic sea ice concentration on August 3, 2025.


Seafloor methane

As the temperature of the water of the Arctic Ocean rises, more ocean heat can penetrate sediments at the seafloor of the Arctic Ocean, which can destabilize methane hydrates contained in these sediments and cause eruptions of huge amounts of methane from the hydrates and from free gas kept underneath these hydrates.

The image below shows that methane concentrations as high as 2535 parts per billion (ppb) were recorded at a pressure level of 695.1 mb by the NOAA 20 satellite on July 30, 2025 AM. High concentrations of methane show up at latitudes higher than 30°N.


The image below shows hourly methane measurements taken at the Barrow Atmospheric Baseline Observatory (BRW), a NOAA facility located near Utqiaġvik (formerly Barrow), Alaska, at 71.32 degrees North.


The image below repeats the IPCC's response, or rather its failure to respond.


A 3°C rise constitutes an important threshold, since humans will likely go extinct with such a rise. As illustrated by the image below, we may already be more than 2°C above pre-industrial and face a potentially huge temperature rise over the next few years.

[ from the post When will humans go extinct? ]
   [ from: When Will We Die? ]
Recent research led by David Fastivich finds that, historically, vegetation responded at timescales from hundreds to tens of thousands of years, but not at timescales shorter than about 150 years. It takes centuries for tree populations to adapt - far too slow to keep pace with today’s rapidly warming world.

Note that vegetation depends on the presence of a lot of things including healthy soil, microbes, moisture, nutrients and habitat. 

A 2018 study by Strona & Bradshaw indicates that most life on Earth will disappear with a 5°C rise (see box on the right). Humans, who depend on a lot of other species, will likely go extinct with a 3°C, as discussed in the earlier post When Will We Die? 

Climate Emergency Declaration

The situation is dire and the precautionary principle calls for rapid, comprehensive and effective action to reduce the damage and to improve the situation, as described in this 2022 post, where needed in combination with a Climate Emergency Declaration, as discussed at this group.


Links

• Climate Reanalyzer
https://climatereanalyzer.org

• IPCC AR6 WG1 Figure 4.35 | Comparison of RCPs and SSPs
https://www.ipcc.ch/report/ar6/wg1/downloads/figures/IPCC_AR6_WGI_Figure_4_35.png
https://www.ipcc.ch/report/ar6/wg1/figures/chapter-4/figure-4-35

• Saltier water, less sea ice
https://arctic-news.blogspot.com/2025/07/saltier-water-less-sea-ice.html

• Nullschool.net
https://earth.nullschool.net

• Marine heatwaves as hot spots of climate change and impacts on biodiversity and ecosystem services - by Thomas Wernberg et al.
discussed on Facebook at: 
https://www.facebook.com/groups/arcticnews/posts/10162992131044679

• Copernicus
https://pulse.climate.copernicus.eu

• NASA - Ocean warming (December 2024) 
https://climate.nasa.gov/vital-signs/ocean-warming/?intent=121

• Arctic Blue Ocean Event 2025? (update June 2025)
https://arctic-news.blogspot.com/2025/06/arctic-blue-ocean-event-2025-update-June-2025.html

• A 485-million-year history of Earth’s surface temperature - by Emily Judd et al. (2024) 
https://www.science.org/doi/10.1126/science.adk3705
discussed on Facebook at: 
https://www.facebook.com/groups/arcticnews/posts/10161741588279679

• Global warming in the pipeline - by James Hansen et al. 
https://academic.oup.com/oocc/article/3/1/kgad008/7335889
discussed on Facebook at: 
https://www.facebook.com/groups/arcticnews/posts/10161110558744679


• Pre-industrial
https://arctic-news.blogspot.com/p/pre-industrial.html

• NOAA - Climate Prediction Center - ENSO: Recent Evolution, Current Status and Predictions
https://www.cpc.ncep.noaa.gov/products/analysis_monitoring/lanina/enso_evolution-status-fcsts-web.pdf

• When will humans go extinct? 

• Coupled, decoupled, and abrupt responses of vegetation to climate across timescales - by David Fastovich et al. (2025)
discussed on Facebook at: 

• Danish Meteorological Institute - sea ice thickness and volume
• University of Bremen
https://seaice.uni-bremen.de/start

• Kevin Pluck - sea ice visuals
https://seaice.visuals.earth

• NOAA - satellite methane measurements
https://www.ospo.noaa.gov/products/atmosphere/soundings/heap/nucaps/new/nucaps_products.html

• NOAA - flask and station methane measurements
https://gml.noaa.gov/dv/iadv/index.php

• When Will We Die?

• Transforming Society
https://arctic-news.blogspot.com/2022/10/transforming-society.html

• Climate Plan
https://arctic-news.blogspot.com/p/climateplan.html
• Climate Emergency Declaration
https://arctic-news.blogspot.com/p/climate-emergency-declaration.html