In the image below, created with NASA data, the decade from 1904 through 1913 is used as a custom base, illustrating that the temperature anomaly has been more than 1.5°C above this base for each of the past consecutive 22 months (July 2023 through April 2025), and even longer when compared to a pre-industrial base. The red line shows a trend (two-year Lowess Smoothing) that is pointing at 2°C above this base (1904-1913) getting crossed in the course of 2026.
 |
| [ trend points at 2°C above 1904-1913 getting crossed in 2026 ] |

The above image shows land only monthly temperature anomalies from 1880-1920, with the red line (2-year Lowess Smoothing trend) showing an acceleration in April 2022. If extended, the red line points at crossing 3°C in the course of 2026. Humans are likely to go extinct with a 3°C rise, as discussed in earlier posts such as this one.
An earlier analysis mentions that, when using 1750 as a base, this could add 0.3°C to the historic rise. The analysis adds that when using an even earlier base, even more could be added to the historic temperature rise.
Those who seek to delay or sabotage climate action typically call for use of a late base, in efforts to minimize the historic temperature rise. Using an earlier base can mean that temperatures are already higher than the thresholds that politicians at the adoption of the Paris Agreement pledged wouldn't be crossed, and it can also imply that the temperature rise is accelerating faster and further, due to stronger feedbacks such as more water vapor in the atmosphere and disappearance of lower clouds, all of which would constitute a stronger call for climate action.
The image below illustrates that air temperatures in the Northern Hemisphere have been very high over the past few months, at times reaching record high temperatures for the time of year, e.g. the temperature in the Northern Hemisphere was 10.08°C on May 14, 2025, the highest temperature on record for that day.
 |
| [ from earlier post, click on images to enlarge ] |


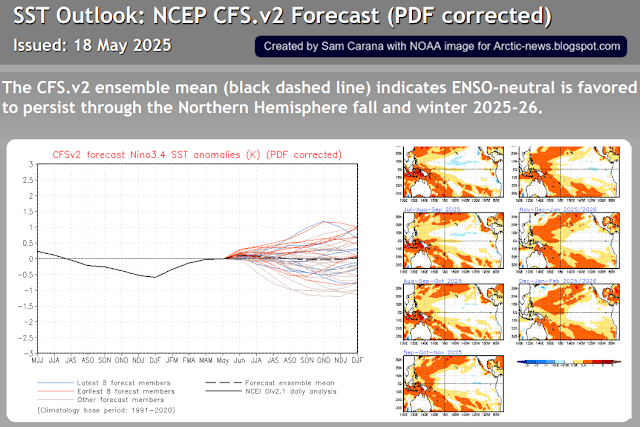
The ENSO outlook is dated May 18, 2025.


The images show that, when adjusting the data and using a genuinely pre-industrial base, the temperature rise may have already crossed both the 1.5°C and the 2°C thresholds that politicians at the 2015 Paris Agreement pledged shouldn't and wouldn't be crossed.
An additional way used by the IPCC to downplay the danger is to suggest there was a "carbon budget", as if there was an amount of carbon to be divided among polluters that could continue to be consumed for decades to come.
The image on the right, from a 2014 post, points at the fallacy and deceit that comes with a carbon budget, carbon credits, offsets and net-zero emission targets that would, according to the IPCC, accomplish and maintain a "balance" between sources and sinks.
Instead, comprehensive and effective action is needed on multiple lines of action, simultaneously yet separately.
Indeed, action is needed to reduce concentrations of carbon both in oceans and in the atmosphere, while on land, the soil carbon content needs to increase, which can best be achieved by methods such as pyrolysis of biowaste and adding the resulting biochar to the soil, to reduce emissions, reduce fire hazards, sequester carbon, support the presence of moisture & nutrients in the soil and thus support the health & growth of vegetation, as discussed at the Climate Plan group and the biochar group.
The IPCC has failed on at least three points:
1. failed to warn about the historic temperature rise and associated larger feedbacks
Slowing down of the Atlantic meridional overturning circulation (AMOC) can cause more heat to accumulate at the ocean surface. Higher sea surface temperatures also come with greater stratification (image below, from earlier post).
Stratification and further changes in oceans and in wind patterns can cause a freshwater lid to form on top of the ocean surface, enabling more hot & salty water to flow underneath this lid (feedback #28), contributing to calving of glaciers and destabilization of sediments at the seafloor.

Increases in water vapor in the atmosphere, loss of sea ice and loss of lower clouds are three self-amplifying feedbacks, i.e. as temperatures rise, such feedbacks will push temperature up even further and due to their self-amplification, the temperature rise will accelerate.
Sea ice loss
One feedback of high temperatures and high concentrations of greenhouse gases is loss of sea ice. Polar amplification of the temperature rise is hitting the Arctic hard, and is also causing dramatic loss of Antarctic sea ice. Global sea ice area has been very low for the past few years, as illustrated by the image below. This has caused a lot of sunlight that was previously reflected back into space, to instead get absorbed by the sea surface. On May 24, 2025, global sea ice area was 17.75 million km², lowest on record for the day.


As said, to see such high temperatures under ENSO-neutral conditions is significant, it indicates that feedbacks are stronger than many models have anticipated, which implies that feedbacks will continue to grow stronger, given the rapid temperature rise over the past few years (black trend). A new El Niño may develop soon, potentially in April 2026, as the red trend in the image below warns about. The result could be a huge rise in temperature over the course of 2026 (red trend).

As said, different bases can be used, e.g. in the above images anomalies are calculated versus bases such as 1904-1913, 1880-1920, 1991-2020 and 1901-2000. None of them is pre-industrial. So, what would the temperature anomaly look like when a genuinely pre-industrial base was used?
The image below, from an earlier post, uses NASA monthly data through March 2023. Data are first adjusted from NASA's default 1951-1980 base to an earlier 30-year base, i.e. a 1886-1915 base, and then further adjusted by 0.99°C to reflect ocean air temperatures, higher polar anomalies and a pre-industral base.

The image below is an update, the same adjustments are made to data through April 2025.

How the 0.99°C adjustment in the above images is calculated is shown in the bright yellow inset of the image below.
 |
| [ from April 2024 post, click on images to enlarge ] |
IPCC keeps downplaying the danger
The IPCC keeps downplaying the danger in many ways. One way the IPCC does this is by selecting a base that minimizes the temperature rise and then to keep making the claim that we're still well below the 1.5°C threshold. The above image, from an April 2024 post, shows that the February 2024 temperature was 1.76°C above 1885-1915, and potentially 2.75°C above pre-industrial (bright yellow inset right). The red line (a six-months Lowess smoothing trend) highlights the steep rise that had already taken place by then. Minimizing the temperature rise will also minimize feedbacks that come with the temperature rise, such as a rise in water vapor and loss of lower clouds, which are self-amplifying feedbacks that further accelerate the temperature rise. In other words, by minimizing the historic temperature rise, the IPCC also seeks to minimize the rise to come.
 |
| [ from a 2014 post, click on images to enlarge ] |
The image on the right, from a 2014 post, points at the fallacy and deceit that comes with a carbon budget, carbon credits, offsets and net-zero emission targets that would, according to the IPCC, accomplish and maintain a "balance" between sources and sinks.
Instead, comprehensive and effective action is needed on multiple lines of action, simultaneously yet separately.
Indeed, action is needed to reduce concentrations of carbon both in oceans and in the atmosphere, while on land, the soil carbon content needs to increase, which can best be achieved by methods such as pyrolysis of biowaste and adding the resulting biochar to the soil, to reduce emissions, reduce fire hazards, sequester carbon, support the presence of moisture & nutrients in the soil and thus support the health & growth of vegetation, as discussed at the Climate Plan group and the biochar group.
The IPCC has failed on at least three points:
1. failed to warn about the historic temperature rise and associated larger feedbacks
2. failed to warn about mechanisms that could cause further acceleration of temperature rise soon
3. failed to point at the best ways to combat climate change.
Higher temperatures come with feedbacks, as illustrated by the image below, from an earlier post.
The above image illustrates how feedbacks and crossing of tipping points can cause the temperature of the atmosphere to keep rising, even in the absence of further emissions, due to shrinking heat sinks (e.g. sea ice thickness loss and oceans taking up less heat).
The IPCC failed to warn about Antarctic sea ice decline, and - importantly - the amplifying impact of Antarctic sea ice decline on the global temperature rise. This was addressed in an earlier post as follows:
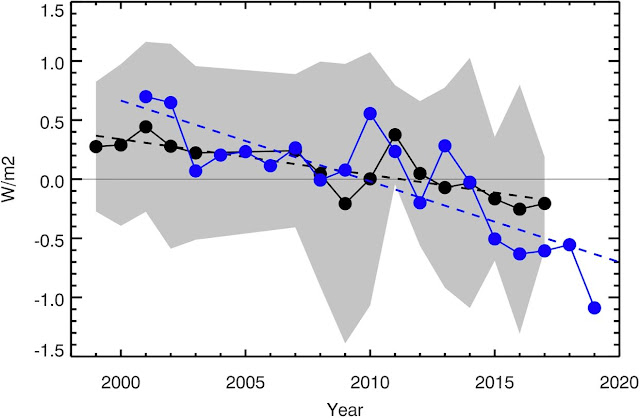
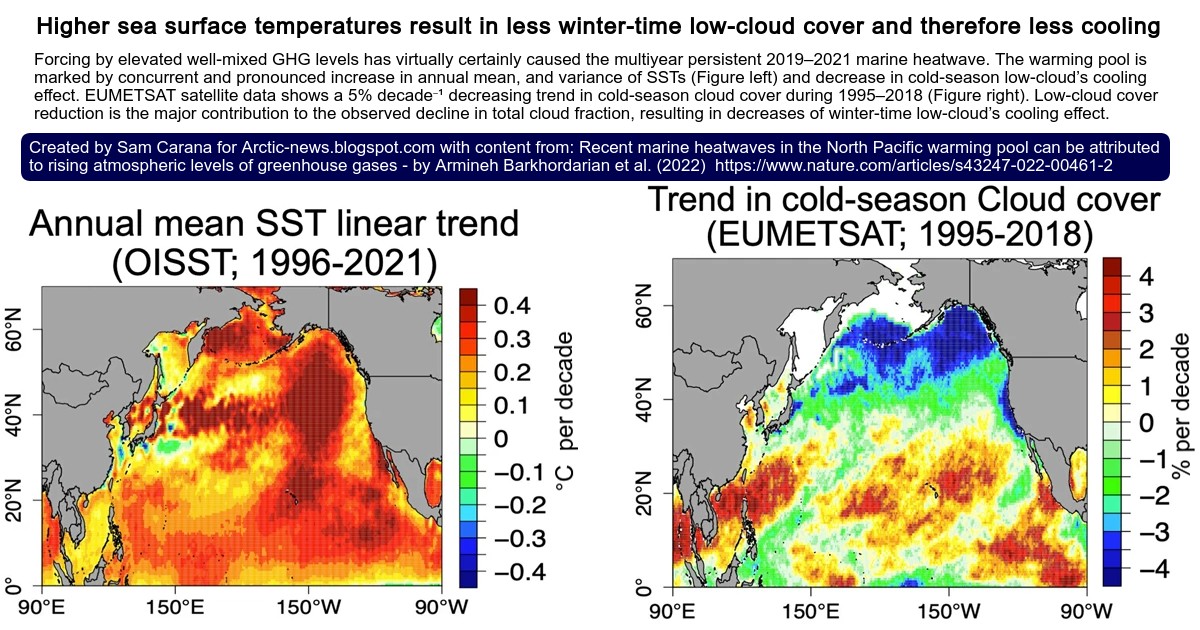
Sea ice loss results in less sunlight getting reflected back into space and instead getting absorbed by the ocean and the impact of Antarctic sea ice loss is even stronger than Arctic sea ice loss, as Antarctic sea ice is located closer to the Equator, as pointed out by Paul Beckwith in a video in an earlier post. A warmer Southern Ocean also comes with fewer bright clouds, further reducing albedo, as discussed here and here. For decades, there still were many lower clouds over the Southern Ocean, reflecting much sunlight back into space, but these lower clouds have been decreasing over time, further speeding up the amount of sunlight getting absorbed by the water of the Southern Ocean, and this 'pattern effect' could make a huge difference globally, as this study points out. Emissivity is a further factor; open oceans are less efficient than sea ice when it comes to emitting in the far-infrared region of the spectrum (feedback #23 on the feedbacks page).
Higher temperatures come with feedbacks, as illustrated by the image below, from an earlier post.
 |
| [ the temperature in the atmosphere can keep rising, even in the absence of further emissions ] |
The IPCC failed to warn about Antarctic sea ice decline, and - importantly - the amplifying impact of Antarctic sea ice decline on the global temperature rise. This was addressed in an earlier post as follows:
Sea ice loss results in less sunlight getting reflected back into space and instead getting absorbed by the ocean and the impact of Antarctic sea ice loss is even stronger than Arctic sea ice loss, as Antarctic sea ice is located closer to the Equator, as pointed out by Paul Beckwith in a video in an earlier post. A warmer Southern Ocean also comes with fewer bright clouds, further reducing albedo, as discussed here and here. For decades, there still were many lower clouds over the Southern Ocean, reflecting much sunlight back into space, but these lower clouds have been decreasing over time, further speeding up the amount of sunlight getting absorbed by the water of the Southern Ocean, and this 'pattern effect' could make a huge difference globally, as this study points out. Emissivity is a further factor; open oceans are less efficient than sea ice when it comes to emitting in the far-infrared region of the spectrum (feedback #23 on the feedbacks page).
A 2024 study led by Norman Loeb finds that large decreases in stratocumulus and middle clouds over the sub-tropics and decreases in low and middle clouds at mid-latitudes are the primary reasons for increasing absorbed solar radiation trends in the northern hemisphere.
Slowing down of the Atlantic meridional overturning circulation (AMOC) can cause more heat to accumulate at the ocean surface. Higher sea surface temperatures also come with greater stratification (image below, from earlier post).
Stratification and further changes in oceans and in wind patterns can cause a freshwater lid to form on top of the ocean surface, enabling more hot & salty water to flow underneath this lid (feedback #28), contributing to calving of glaciers and destabilization of sediments at the seafloor.

Increases in water vapor in the atmosphere, loss of sea ice and loss of lower clouds are three self-amplifying feedbacks, i.e. as temperatures rise, such feedbacks will push temperature up even further and due to their self-amplification, the temperature rise will accelerate.
One feedback of high temperatures and high concentrations of greenhouse gases is loss of sea ice. Polar amplification of the temperature rise is hitting the Arctic hard, and is also causing dramatic loss of Antarctic sea ice. Global sea ice area has been very low for the past few years, as illustrated by the image below. This has caused a lot of sunlight that was previously reflected back into space, to instead get absorbed by the sea surface. On May 24, 2025, global sea ice area was 17.75 million km², lowest on record for the day.

The image below, adapted from the Danish Metereological Institute, shows that Arctic sea ice volume on May 29, 2025, was at a record low for the time of year, as it has been for more than a year.

Sea ice is disappearing over large parts of the Arctic Ocean. The image below, adapted from the University of Bremen, shows sea ice concentration on May 29, 2025.

The screenshot below, from an earlier post, further illustrates the dangers that come with sea ice loss. Eruptions of methane from the seafloor of the Arctic Ocean is one of the most terrifying dangers.

Climate Emergency Declaration
The situation is dire and the precautionary principle calls for rapid, comprehensive and effective action to reduce the damage and to improve the situation, as described in this 2022 post, where needed in combination with a Climate Emergency Declaration, as discussed at this group.

Links
• NASA - datasets and images
https://data.giss.nasa.gov
• When Will We Die?
https://arctic-news.blogspot.com/2019/06/when-will-we-die.html
• Copernicus - Climate Pulse
https://pulse.climate.copernicus.eu
• Climate Reanalyzer
https://climatereanalyzer.org
• NOAA - Climate Prediction Center - ENSO: Recent Evolution, Current Status and Predictions
https://www.cpc.ncep.noaa.gov/products/analysis_monitoring/lanina/enso_evolution-status-fcsts-web.pdf
• NOAA - Climate Prediction Center - El Niño/Southern Oscillation (ENSO) Diagnostic Discussion


As the image below illustrates, some of the thickest sea ice disappears from the Arctic Ocean as it gets broken up by sea currents and the pieces get moved out along the edges of Greenland. The image shows how, on May 27, 2025, the sea ice gets broken up just north of Greenland, due to ocean currents that will also move the pieces to the south, alongside the edges of Greenland, toward the North Atlantic.
 |
| [ click on images to enlarge ] |
The situation is dire and the precautionary principle calls for rapid, comprehensive and effective action to reduce the damage and to improve the situation, as described in this 2022 post, where needed in combination with a Climate Emergency Declaration, as discussed at this group.

• NASA - datasets and images
https://data.giss.nasa.gov
• When Will We Die?
https://arctic-news.blogspot.com/2019/06/when-will-we-die.html
• Copernicus - Climate Pulse
https://pulse.climate.copernicus.eu
• Climate Reanalyzer
https://climatereanalyzer.org
• NOAA - Climate Prediction Center - ENSO: Recent Evolution, Current Status and Predictions
https://www.cpc.ncep.noaa.gov/products/analysis_monitoring/lanina/enso_evolution-status-fcsts-web.pdf
• NOAA - Climate Prediction Center - El Niño/Southern Oscillation (ENSO) Diagnostic Discussion
• Pre-industrial
https://arctic-news.blogspot.com/p/pre-industrial.html
• Feedbacks
https://arctic-news.blogspot.com/p/feedbacks.html
• NOAA - Office of Satellite And Product Operations - Sea Surface Temperatures
https://www.ospo.noaa.gov/products/ocean/sst/contour/index.html
• Nullschool.net
https://earth.nullschool.net
• Jet Stream
https://arctic-news.blogspot.com/p/jet-stream.html
• Cold freshwater lid on North Atlantic
https://arctic-news.blogspot.com/p/cold-freshwater-lid-on-north-atlantic.html
• Danish Meteorological Institute - Arctic sea ice volume and thickness
https://ocean.dmi.dk/arctic/icethickness/thk.uk.php
• University of Bremen
https://seaice.uni-bremen.de/start
• NASA - Worldview satellite images
https://worldview.earthdata.nasa.gov
• Transforming Society
https://arctic-news.blogspot.com/2022/10/transforming-society.html
• Climate Plan
https://arctic-news.blogspot.com/p/climateplan.html
• Climate Emergency Declaration
https://arctic-news.blogspot.com/p/climate-emergency-declaration.html