Monday, February 28, 2022

What the IPCC impacts report is hiding

[ click on images to enlarge ]

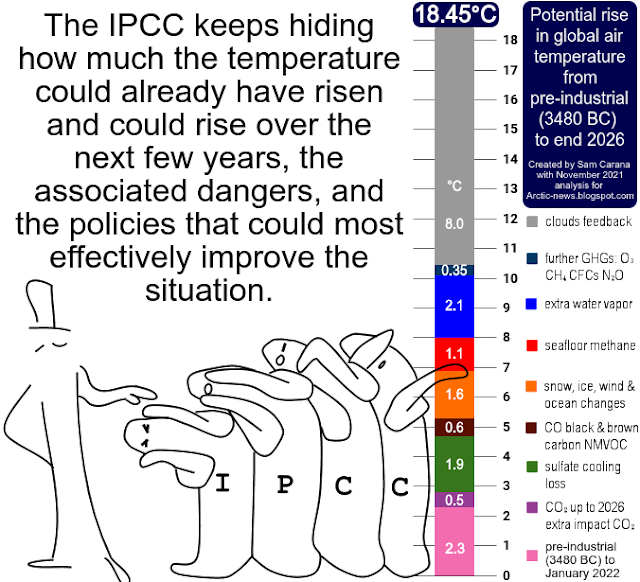
Above image is adapted from content by IPCC AR6 WGII and Peter Carter, expert IPCC reviewer and director of the Climate Emergency Institute

The IPCC keeps hiding how much the temperature could already have risen and could rise over the next few years, the associated dangers, and the policies that could most effectively improve the situation. 


1. Hiding the potential rise that has already unfolded
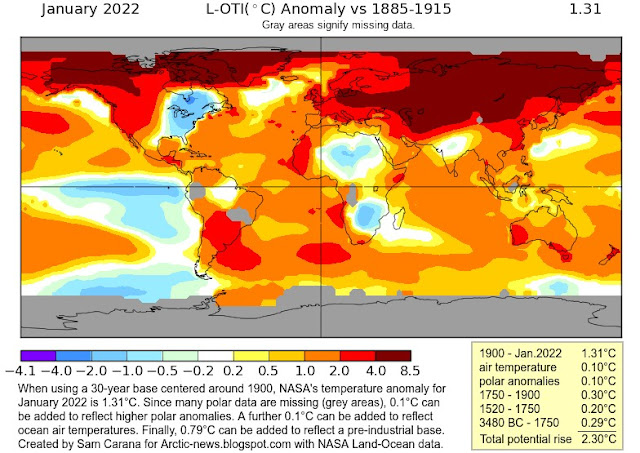
One of the first issues that springs to mind is the IPCC's use of 1850-1900 as a baseline, which isn't pre-industrial as the Paris Agreement called for.


Above image, adapted from a NASA image, shows a January 2022 temperature rise of 1.31°C versus 1885-1915. As the box underneath indicates, a further 0.1°C could be added for ocean air temperatures and another 0.1°C for higher polar anomalies. When calculating the temperature rise from pre-industrial, a further 0.79°C could be added for the period from 3480 BC to 1900, resulting in a total temperature rise from pre-industrial to January 2022 of 2.3°C.


2. Hiding the potential rise to come

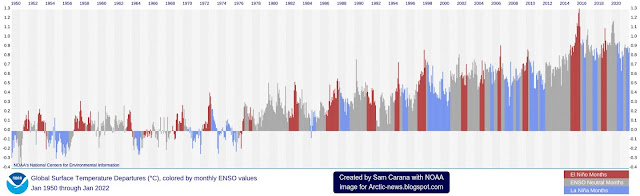
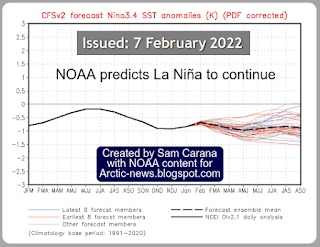
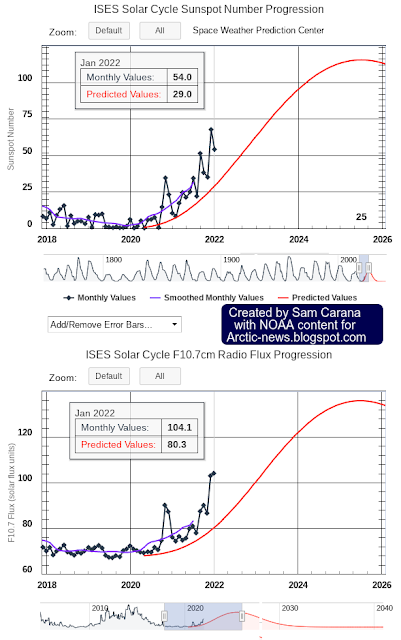
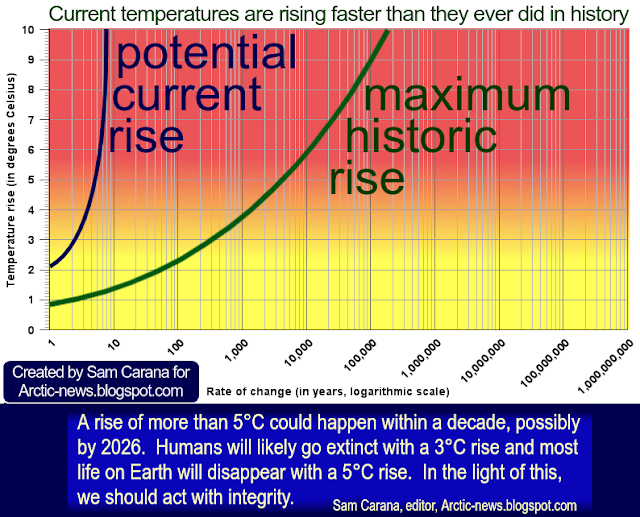
While a huge temperature rise has already unfolded, the rise is accelerating, as discussed at earlier posts such as this one and as illustrated by the image below, an example from an earlier post


In other words, an even larger temperature rise threatens to unfold soon, i.e. this could happen over the course of at few years, as illustrated by the stacked bar next to the cartoon above and as discussed at the extinction page.


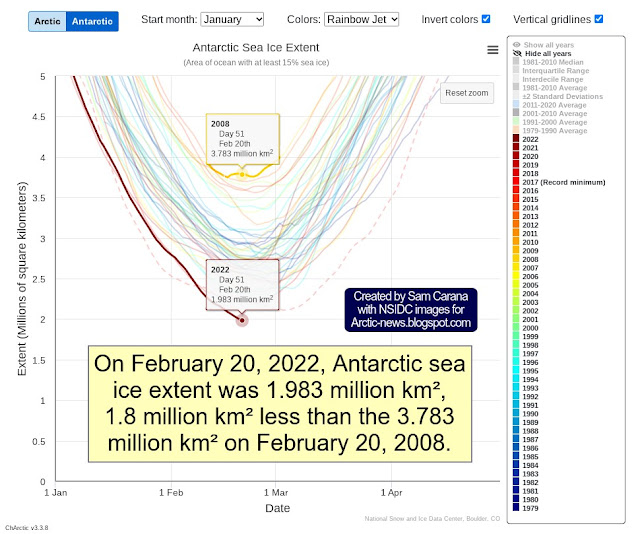
3. Hiding the largest dangers

The rise that has already unfolded, i.e. the rise from pre-industrial to 2020, could be as much as 2.3°C, as discussed above and at the pre-industrial page. Furthermore, the temperature rise is accelerating. In other words, Earth is already in the danger zone and the question remains what the implications are of a 3°C, 4°C and 5°C rise.


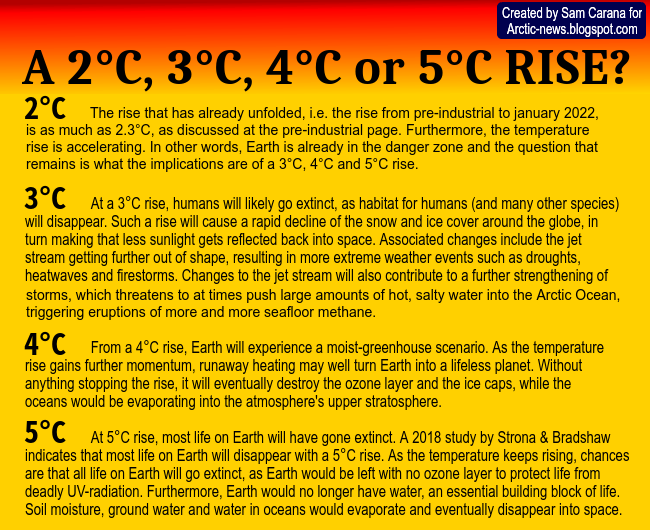
What would be the impact of a 3°C, a 4°C, or a 5°C rise? 

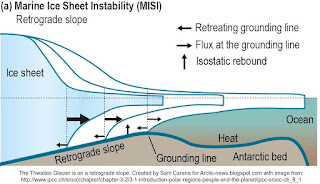
At a 3°C rise, humans will likely go extinct, as habitat for humans (and many other species) will disappear. Such a rise will cause a rapid decline of the snow and ice cover around the globe, in turn making that less sunlight gets reflected back into space. Associated changes are discussed in more detail at this page and this page, and include that the jet stream will further get out of shape, resulting in more extreme weather events such as droughts, heatwaves and firestorms. Changes to the jet stream will also contribute to a further strengthening of storms, which threatens to at times push large amounts of hot, salty water into the Arctic Ocean, triggering eruptions of more and more seafloor methane, as discussed in an earlier post.

[ from an earlier post  ]
From a 4°C rise, Earth will experience a moist-greenhouse scenario. As the temperature rise gains further momentum, runaway heating may well turn Earth into a lifeless planet, a danger that was discussed in this 2013 post, warning that, without anything stopping the rise, it will continue to eventually destroy the ozone layer and the ice caps, while the oceans would be evaporating into the atmosphere's upper stratosphere and eventually disappear into space.

At 5°C rise, most life on Earth will have gone extinct. A 2018 study by Strona & Bradshaw indicates that most life on Earth will disappear with a 5°C rise (see box on the right). As the temperature keeps rising, chances are that all life on Earth will go extinct, as Earth would be left with no ozone layer to protect life from deadly UV-radiation. Furthermore, Earth would no longer have water, an essential building block of life. Soil moisture, groundwater and water in oceans would evaporate and eventually disappear into space, as discussed in an earlier post.

Much of the above was discussed earlier at Most Important Message Ever.

[ from the post When will we die? ]

A rise of more than 5°C could happen within a decade, possibly by 2026. Humans will likely go extinct with a 3°C rise and most life on Earth will disappear with a 5°C rise. In the light of this, we should act with integrity.


4. Hiding the very policies that can most effectively improve the situation

The IPCC creates a perception that pollution can continue for decades to come. The IPCC does so by downplaying the size of the temperature rise and the threat of a huge rise within years. The IPCC promotes the idea that there was a “carbon budget” to be divided among polluters that would enable polluters to keep polluting for decades to come. Most importantly, the IPCC has once more failed to do what the Paris Agreement calls for, i.e. for the IPCC to specify the pathways that can best improve the situation, specifically the policies that are needed to facilitate a better future. 

The speed at which a huge temperature rise can unfold makes that many adaption efforts could be wasted or even counter-productive. A 2021 report by Neta Crawford estimates the budgetary costs and future obligations of the post-9/11 wars at about $8 trillion in 2021 dollars. Much of that money was spent on securing the supply and transport of fossil fuel. Governments spend $1.8tn a year on subsidies that harm the environment, a study by Doug Koplow et al. finds. Globally, fossil fuel subsidies were $5.9 trillion in 2020 or about 6.8% of GDP and are expected to rise to 7.4% of GDP in 2025, a 2021 IMF report finds. 

Perverse subsidies are even higher when also including money that now goes into constructing transport infrastructure such as roads, highways, tunnels, bridges, railways, airports, etc. Redirecting such funding could enable more people to work and study from home with time to spare and gardens to grow their own food, instead of commuting by car over roads to offices, schools, etc.

[ from earlier post ]
Electric VTOL air taxis can replace a huge part of the traffic that now demands expensive infrastructure such as roads, railways including service stations, parking buildings and strips, bridges, tunnels, etc. Air taxis can facilitate a dramatic reduction in the need for traffic infrastructure, which also includes space now used for garages and parking.

If much of this traffic instead takes place by air taxis, then urban design can have more space for outdoor dining, parks, markets, tree-lined footpaths, bike-tracks, etc. 

Furthermore, drones could be used for transport and delivery of cargo, pharmaceuticals, etc. In many places, cities can become more compact and buildings can be put closer together, thus reducing overall cost and enabling people to reach destinations quicker, either by walking or cycling. Air taxis can bring people to many destinations fast, while people can also using online facilities to further reduce the need for transport and travel infrastructure.

In other places, the space now used for roads and parking could instead be used to create urban forests, to extend gardens and to create community gardens and markets where people can get locally-produced vegan-organic food such as fruit and vegetables.

Much additional infrastructure can also change, such as traffic lights and road signs, streetlights and the electricity grid. Supply of natural gas could be replaced by electric devices such as heat-pumps, induction-cookers and electric water-heaters. Organic waste can be pyrolysed with the resulting biochar added to the soil.

For more on the Urban Heat Island effect, see:
https://www.facebook.com/groups/airtaxis/posts/419568755612304


For more on biochar and pyrolysis, see:
https://www.facebook.com/groups/biochar


Conclusion

The situation is dire and calls for the most comprehensive and effective action, as described at the Climate Plan.


Links

• IPCC AR6 WGII - Climate Change 2022: Impacts, Adaptation and Vulnerability

• Is the IPCC creating false perceptions, again?

• Human Extinction by 2022?

• NASA GISS Surface Temperature Analysis (v4)
• Pre-industrial
https://arctic-news.blogspot.com/p/pre-industrial.html

• Extinction
https://arctic-news.blogspot.com/p/extinction.html

• Aerosols
https://arctic-news.blogspot.com/p/aerosols.html

• Clouds feedback
https://arctic-news.blogspot.com/p/clouds-feedback.html

• When Will We Die?
https://arctic-news.blogspot.com/2019/06/when-will-we-die.html

• Could Earth go the same way as Venus?
• Accelerating Methane Rise
https://arctic-news.blogspot.com/2022/02/accelerating-methane-rise.html

• Protecting Nature by Reforming Environmentally Harmful Subsidies: The Role of Business Prepared - by Doug Koplow and Ronald Steenblik (2022) 
https://www.earthtrack.net/sites/default/files/documents/EHS_Reform_Background_Report_fin.pdf

• The U.S. Budgetary Costs of the Post-9/11 Wars - by Neta Crawford (2021)
https://watson.brown.edu/costsofwar/files/cow/imce/papers/2021/Costs%20of%20War_U.S.%20Budgetary%20Costs%20of%20Post-9%2011%20Wars_9.1.21.pdf

• IMF - Still Not Getting Energy Prices Right: A Global and Country Update of Fossil Fuel Subsidies
https://www.imf.org/en/Publications/WP/Issues/2021/09/23/Still-Not-Getting-Energy-Prices-Right-A-Global-and-Country-Update-of-Fossil-Fuel-Subsidies-466004

• Which policy can help EVs most?
• Climate Plan
https://arctic-news.blogspot.com/p/climateplan.html


Tuesday, February 22, 2022

Albedo loss in Antarctica


As above image shows, Antarctic sea ice extent was only 1.973 million km² on February 23, 2022, the lowest on record since satellite measurements began in 1979.


Earlier, on February 20, 2022, Antarctic sea ice extent was only 1.983 million km². On February 20, 2008, it was 3.783 million km². That's a difference of 1.8 million km², or some 0.36% of the total surface of Earth (which is 510,072,000 km²).


As illustrated by above image, adapted from IPCC AR5, incoming solar radiation at Top Of Atmosphere (TOA) is 340.4 W/m². This 340.4 W/m² is an average. The value varies depending on the seasons, i.e. the more the surface of Earth is facing the Sun, the higher this value will be (see image below, from the insolation page). 

                     The June Solstice in 2021 occurred on June 21, 2021.
Another variable is how many clouds and aerosols are in the sky. Much of this radiation can be reflected or absorbed by the atmosphere and some of the radiation that reaches the surface can also be reflected. Yet, on a cloud-free day, where the sky is clear from aerosols, much of the incoming solar radiation will reach the surface. It further depends on the albedo of the surface, how much will in the end be absorbed or reflected at the surface.

[ from the Albedo page ]

Albedo refers to the reflectivity of the surface. Earth average albedo is 0.3 or 30%. The albedo of sea ice can be as high as 0.9 (i.e. 90% when covered with fresh snow). Currently, albedo of the sea ice is about 0.6 (the sea ice is partly covered with melt pools). Open water has an albedo of 0.06. So, disappearance of the sea ice makes an albedo difference of at least 0.5.

So, when taking half of 340 W/m² and multiplying this by 0.36% (i.e. the part of Earth's surface), that gives a radiative forcing of 0.612 W/m². That would mean that some 0.612 W/m² that was previously reflected (Feb 20, 2008) is now instead absorbed by the ocean (on Feb 20, 2022). If Antarctic sea ice would disappear altogether, that would correspond to another loss of some 0.612 W/m², and together with the difference between 2008 and 2022, that would add up to a total radiative forcing of 1,224 W/m².

That's almost half as much as all human-caused global warming in 2019. As the image below shows, radiative forcing was 2.72 W/m² in 2019 relative to 1750, according to IPCC AR6


If anyone can add to or improve the above calculation, please add a comment (see box below). 

The situation is dire and calls for the most comprehensive and effective action, as described at the Climate Plan.


Links

• NSIDC - Charctic interactive Sea Ice Graph
https://nsidc.org/arcticseaicenews/charctic-interactive-sea-ice-graph

• Wikipedia - Earth
https://en.wikipedia.org/wiki/Earth

• IPCC - Figure 2.11 (AR5/WG1/Chapter 2)
https://www.ipcc.ch/report/ar5/wg1/observations-atmosphere-and-surface/fig2-11_orig-pptx-2

• The global energy balance from a surface perspective - by Martin Wild et al. (2012)

• NASA - Earth albedo

• Albedo

• Insolation

• IPCC AR6 WG1 SPM

• Climate Plan
https://arctic-news.blogspot.com/p/climateplan.html


Tuesday, February 15, 2022

Greenhouse gas levels keep rising at accelerating speed

Carbon dioxide

Carbon dioxide (CO₂) was 421.59 parts per million (ppm) at Mauna Lao, Hawaii, on February 14, 2022, a level unprecedented in millions of years. 

Carbon dioxide levels typically reach their annual maximum in May, so even higher levels can be expected over the next few months.


Carbon dioxide levels are even higher at high latitudes north. The image below shows that carbon dioxide levels are approaching 430 ppm at Barrow, Alaska.

Methane

NOAA's monthly global mean reading for October 2021 for methane (CH₄) is 1907.2 parts per billion (ppb), which is 17.1 ppb higher than the reading for October 2020. By comparison, NOAA's annual global mean methane increase of 15.74 ppb for 2020 was the highest on record at the time and the increase for 2021 looks to be even higher.
Keep in mind that NOAA's data are for marine surface measurements; more methane tends to accumulate at higher altitudes.

Furthermore, keep in mind that the above 1907.2 ppb reading is for October 2021; it now is February 2022.  The image below shows that recent methane levels are approaching 1940 ppb at Mauna Loa, Hawaii.

Similarly as carbon dioxide, methane levels are even higher at high latitudes north. Furthermore, the rise is accelerating strongly. At Barrow, Alaska, recent methane levels are approaching 2040 ppb. 


Nitrous oxide

The image below shows the annual increase in globally-averaged nitrous oxide (N₂O).

The top part of the combination image below shows IPCC scenarios for nitrous oxide, as discussed in an earlier post, with the bottom part showing recent NOAA observations (through to October 2022).


Clouds feedback

As discussed in an earlier post, just two greenhouse gases, carbon dioxide and methane, could abruptly cause the joint CO₂e to cross the 1200 ppm clouds tipping point, triggering a further 8°C global temperature rise, due to the clouds feedback.

Again, that could be the result of the climate forcing just of carbon dioxide and methane, without even adding further forcing such as by nitrous oxide. Meanwhile, as discussed, humans will likely go extinct with a 3°C rise, and a 5°C rise will likely end most life on Earth.


Conclusion

The situation is dire and calls for the most comprehensive and effective action, as described at the Climate Plan.


Links

• NOAA - Mauna Loa, Hawaii
https://gml.noaa.gov/dv/iadv/graph.php?code=MLO&program=ccgg&type=ts

• NOAA - Barrow, Alaska
https://gml.noaa.gov/dv/iadv/graph.php?code=BRW&program=ccgg&type=ts

• Terrifying Arctic greenhouse gas levels continue
• NOAA - Nitrous oxide trends
https://gml.noaa.gov/ccgg/trends_n2o

• NOAA - Globally averaged marine surface monthly mean nitrous oxide data

• Is the IPCC creating false perceptions, again?

• Accelerating Methane Rise

• Terrifying Arctic greenhouse gas levels continue
• When Will We Die?
https://arctic-news.blogspot.com/2019/06/when-will-we-die.html

Wednesday, February 9, 2022

Accelerating loss of global snow and ice cover


Ocean heat is at record levels. As a result, global sea ice extent was only 16.23 million km² on February 9, 2022, the third lowest extent on record. What makes this even more worrying is that we're currently in the depth of a persistent La Niña.


Antarctic sea ice at lowest extent on record since start satellite measurements

Ocean heat is a huge threat for Antarctica at the moment. The image below shows that Antarctic sea ice extent was only 2.091 million km² on February 16, 2022, the lowest on record since the start of satellite measurements.


Ocean heat is reducing the sea ice around Antarctica and is getting underneath floating sea ice. 

The Thwaites Glacier, which is on a retrograde slope, is especially vulnerable to collapse. 

The Thwaites Glacier contains enough ice to raise global sea levels by 65 cm (25.59 inches) if it were to completely collapse.

The animation on the right, created with images from Climate Reanalyzer, shows the retreat of the Antarctic snow and ice cover from January 5 to February 18, 2021. 

The animation underneath, by navy.mil, shows sea ice thickness over 30 days up to February 17, 2022 (with 8 days of forecasts added).

Another danger of a rapid loss of the snow and ice cover on Antarctica is release of methane. Jemma Wadham warned about this in a 2012 study, as discussed at the post methane hydrates. More recently, Jemma Wadham said: “We are sleepwalking into a catastrophe for humanity.

The Thwaites Glacier is often called the Doomsday Glacier because if it collapses it would lead to vast sea level rise, and scientists believe it is likely to fail within a few years, says Cliff Seruntine (the Naturalist) in the video below. 


A recent study concludes that mountain glaciers may hold less ice than previously thought. Their disappearance means less water for drinking and agriculture, and faster temperature rises due to albedo loss. While the study found that the Himalayas contain more water than thought, another recent study, Mt. Everest’s highest glacier is a sentinel for accelerating ice loss, describes how human-induced climate change has a huge impact on the highest reaches of the planet.

The outlook for the Arctic is most threatening, as the post methane hydrates also concluded back in 2013, as described in numerous post here at Arctic-news and as discussed in the video below by Jim Massa.


A huge temperature rise threatens to unfold soon


Above image indicates that the difference between the top of El Niño and the bottom of La Niña could be more than half a degree Celsius.

As said, we're currently in the depth of a persistent La Niña, which suppresses temperatures. As the temperature keeps rising, ever more frequent strong El Niño events are likely to occur, as discussed in an earlier post

A 2019 study analyzes how tipping the ENSO into a permanent El Niño can trigger state transitions in global terrestrial ecosystems.

Currently, the temperature rise is additionally suppressed by low sunspots. Within a few years time, sunspots can be expected to reach the peak of their current cycle and observed sunspots are looking stronger than predicted. 

In the image below on the right, adapted from NOAA, the solar cycle is represented as the number of sunspots (top) and F10.7cm radio flux (bottom). 

In a recent communication, James Hansen repeats that, as reductions take place in the sulfate aerosols that are currently co-emitted by traffic, transport and industry, this is causing the current temperature rise to accelerate and could cause further rapid global warming, referred to in a 2021 presentation as a termination shock.

Furthermore, in addition to a huge temperature rise resulting from sulfate aerosols falling away, there could be a further rise in temperature as a result of releases of other aerosols with a net warming impact, such as black and brown carbon, which can increase dramatically as more wood burning and forest fires take place.

In summary, while the temperatures are accelerating, we'll soon be moving into the next El Niño, with sunspots moving toward a peak, with sulfate aerosols causing a termination shock and with other aerosols further driving up the temperature rise. 

Stop the deception!

In a giant scheme of deception, the temperature rise is all too often presented with images of people playing on the beach on a 'warm' day, as if 'global warming' was making life more 'comfortable'. 

Forest fires are called 'wildfires', biomass burning and associated deforestation is referred to as 'renewable biofuel', fracking-induced earthquakes are called 'natural' disasters and methane eruptions are called seeps and bubbles of 'natural' gas from 'natural' sources such as wetlands. 

This gives the false impression that this was somehow 'natural' as if human activities had nothing to do with it, and as if owning beach-front property was becoming ever more attractive.


Let's stop this deception! In reality, human-caused emissions have a huge short-term impact on temperature and their combination with genuinely natural variability such as El Niño and sunspots can act as a catalyst, causing numerous feedbacks to kick in with ever greater ferocity. 

This can result in collapse of global sea ice and permafrost, resulting in albedo loss and eruption of huge quantities of carbon dioxide, methane and nitrous oxide, further driving up the temperature rise abruptly, as described at the extinction page. Further feedbacks are also described at the feedbacks page

Conclusion

The situation is dire and calls for the most comprehensive and effective action, as described at the Climate Plan.


Links

• Another Record: Ocean Warming Continues through 2021 despite La Niña Conditions - by Lijing Cheng et al. 
https://link.springer.com/article/10.1007%2Fs00376-022-1461-3

• Ocean heat is at record levels, with major consequences - by Kevin Trenberth

• Arctic Data archive System - Vishop extent

• NSIDC: Charctic Interactive Sea Ice Graph

• IPCC: Marine Ice Sheet Instability

• Climate Reanalyzer
https://climatereanalyzer.org/wx/DailySummary/#seaice-snowc-topo

• Antarctica CICE ice thickness

• Antarctica’s ‘doomsday’ glacier: how its collapse could trigger global floods and swallow islands 
https://theconversation.com/antarcticas-doomsday-glacier-how-its-collapse-could-trigger-global-floods-and-swallow-islands-173940

• Methane hydrates (2013)

• Potential methane reservoirs beneath Antarctica - by Jemma Wadham et al. (2012) 
https://www.nature.com/articles/nature11374

• A new frontier in climate change science: connections between ice sheets, carbon and food webs (2021) 

• Ice velocity and thickness of the world’s glaciers - by Romain Millan et al. 
https://www.nature.com/articles/s41561-021-00885-z

• Mountain glaciers may hold less ice than previously thought – here’s what that means for 2 billion downstream water users and sea level rise 
https://theconversation.com/mountain-glaciers-may-hold-less-ice-than-previously-thought-heres-what-that-means-for-2-billion-downstream-water-users-and-sea-level-rise-176514

• Mt. Everest’s highest glacier is a sentinel for accelerating ice loss - by Mariusz Potocki et al. 

• Human-induced climate change impacts the highest reaches of the planet — Mount Everest
• Ocean Heat Content Update 1 - 2022 - Science Talk with Jim Massa
https://www.youtube.com/watch?v=pctkg_LDqcU

• NOAA - ENSO: Recent Evolution, Current Status and Predictions
https://www.cpc.ncep.noaa.gov/products/analysis_monitoring/lanina/enso_evolution-status-fcsts-web.pdf

• NOAA - Monthly Temperature Anomalies Versus El Niño 
• Human Extinction by 2022? 

• Tipping the ENSO into a permanent El Niño can trigger state transitions in global terrestrial ecosystems - by Mateo Duque-Villegas et al. (2019) 
https://esd.copernicus.org/articles/10/631/2019

• James Hansen - The New Horse Race

• Climate Impact of Decreasing Atmospheric Sulphate Aerosols and the Risk of a Termination Shock - by Leon Simons, James Hansen and Yann duFournet (2021) 

• NOAA - Solar Cycle Progression

• Aerosols

• Feedbacks

• Extinction


Tuesday, February 8, 2022

Accelerating Methane Rise

NOAA's October 2021 global mean methane reading is 1907.2 parts per billion (ppb), which is 17.1 ppb higher than the reading for October 2020. By comparison, NOAA's annual global mean methane increase of 15.74 ppb for 2020 was at the time the highest on record.


Keep in mind that this 1907.2 ppb reading is for October 2021; it now is February 2022. Furthermore, NOAA's data are for marine surface measurements; more methane tends to accumulate at higher altitudes.

The  image below shows that the MetOp-B satellite recorded a peak methane level of 2904 ppb at 469 mb on February 4, 2022 am. 


Methane levels are very high over the Arctic. The image below shows high recent monthly average methane levels at Barrow, Alaska. 


Carbon dioxide levels over the Arctic are also very high. The image below shows high recent daily average carbon dioxide levels at Barrow, Alaska. 


The situation is dire and calls for the most comprehensive and effective action, as described at the Climate Plan.


Links

• NOAA - globally averaged marine surface monthly mean methane data
https://gml.noaa.gov/webdata/ccgg/trends/ch4/ch4_mm_gl.txt

• NOAA - globally averaged marine surface annual mean methane growth rates
https://gml.noaa.gov/webdata/ccgg/trends/ch4/ch4_gr_gl.txt

• NOAA - Infrared Atmospheric Sounding Interferometer (IASI) Sounding Products (MetOp)
https://www.ospo.noaa.gov/Products/atmosphere/soundings/iasi

• NOAA - Carbon Cycle Gases, Barrow Atmospheric Baseline Observatory, United States
https://gml.noaa.gov/dv/iadv/graph.php?code=BRW

• NOAA - Trends in Atmospheric Carbon Dioxide, Mauna Loa, Hawaii
https://gml.noaa.gov/ccgg/trends/graph.html

• Human Extinction by 2022?
https://arctic-news.blogspot.com/2021/11/human-extinction-by-2022.html

• Terrifying Arctic methane levels
https://arctic-news.blogspot.com/2021/12/terrifying-arctic-methane-levels.html

• Terrifying Arctic methane levels continue
https://arctic-news.blogspot.com/2022/01/terrifying-arctic-greenhouse-gas-levels-continue.html

• Climate Plan
https://arctic-news.blogspot.com/p/climateplan.html


Monday, February 7, 2022

Wake

by Malcolm Light

~ Wake represents the last chance for humanity to “Wake Up” to the extreme global extinction nightmare facing us; a Wake is also a Celtic “Death Watch” on our Planet Earth’s near term demise. ~


Above image shows the exponential increase of the Mean Global Atmospheric Temperature Anomaly in Degrees Celsius (Light 2021, Carana 2022, 2021; Carter, 2022) and the relative increase in Volume of Heat Transport and Temperature of the Gulf Stream–Svalbard Current into the Arctic Ocean (Smedsrud et al., 2021; Carter 2022). 

[ from earlier post ]
The Volume of Gulf Stream Heat Transport has increased by 30% in the last 100 years (Smedsrud et al., 2021) and is estimated to be some 33.6% larger by 2030.

The Gulf Stream Temperature–Heat Transport Volume Trend intersects the Mean Global Atmospheric Temperature Anomaly Trend at 2030 with an equal and combined Arctic Atmospheric and Ocean Temperature of 11.7°C.

By this time the sub-sea Arctic shelf edge methane hydrates will be exponentially destabilizing, releasing vast volumes of methane gas into the Arctic Ocean, and this will convert the sea into a ‘Methane Bubble Foam’, vastly increasing the rate of evaporation of Arctic Ocean water.

By the Northern Summer of 2035, the Arctic Ocean and Mean Global Atmospheric Temperature Anomaly will together have reached 107.5°C and will pass 117.4°C by the Northern Summer of 2036.

After 2035, the loss of the Planet's ocean water will occur at an exponential rate, as the Ocean and Mean Global Atmospheric Temperature Anomalies rise in unison and convert Earth into a high temperature, uninhabitable planet like Venus.

[ from earlier post ]

It is completely self-evident that if the Gulf Stream heat transport to the Arctic Ocean is not immediately stopped, it will cause a Catastrophic Arctic Atmospheric Global Extinction event starting in 2 to 5 years culminating around 2030 (8 Years hence) (Light 2021; Carana 2022, 2021; Carter 2022).

[ Created by Sam Carana with nullschool.net ]
Because of the very short time now left to the start of the Catastrophic Global Extinction Event, the Gulf Stream heat transport to the Arctic Ocean must be stopped.

The animation on the right shows that, on February 2, 2022, sea surface temperatures off the coast of North America were as much as 11.2°C higher than 1981-2011 (at green circle).

Present data indicates that the Mean Global Atmospheric Temperature Anomaly will have reached 5°C in the Summer of 2024 when massive Global extinction will begin in earnest. Therefore the latest date for effective action is the summer of 2023.


References

• Terrifying Arctic Methane Levels - by Sam Carana (2022)
https://arctic-news.blogspot.com/2021/12/terrifying-arctic-methane-levels.html

• Terrifying Arctic greenhouse gas levels continue - by Sam Carana (2022)
https://arctic-news.blogspot.com/2022/01/terrifying-arctic-greenhouse-gas-levels-continue.html

• Will COP26 in Glasgow deliver? - by Sam Carana (2021)

• Climate change: Satellites map huge methane plumes from oil and gas (BBC, 2022)

• Global assessment of oil and gas methane ultra-emitters - by Thomas Lauvaux et al. (2022)

• Nordic Seas Heat Loss, Atlantic Inflow, and Arctic Sea Ice Cover Over the Last Century - by Lars Smedsrud et al. (2021)
https://agupubs.onlinelibrary.wiley.com/doi/10.1029/2020RG000725

• The Gulf Stream has increased steadily over the last century - by University of Bergen (News Release associated with above study, 2022)
https://www.uib.no/en/climateenergy/150992/gulf-stream-has-increased-steadily-over-last-century

• Carter, Peter; 2022.
The 2021 Temperature Increase (1.1°C to 1.2°C) makes the Past Seven Years the Warmest on Record. Note Rapid Surface Heating of North America from Copernicus.

• Carter, Peter; 11 January 2022.
Arctic Sea Surface Temperature is Increasing at a Rate Far Above the Very Worst Case. 

• Carter, Peter; 5 January 2022. 
Through 2021 Global Warming Atmospheric Greenhouse Gases have the Planet Headed to Catastrophic Heating. 

• Hampton, Steve 2021. 
Modern climate change is 10x faster than historic global warming mass extinction events

• Light M.P.R., 2021. 
Planetary Extinction due to Arctic Atmospheric Methane Veil

• Light M.P.R., 2015. 
Planetary Genocide - Ecocide between 2023 and 2031
https://arctic-news.blogspot.com/2015/01/planetary-genocide-ecocide-between-2023-and-2031.html

• Light M.P.R., Hensel H. and Carana S., 2014. 
Arctic Atmospheric Methane Global Warming Veil

• Light M.P.R., 2013. 
Act now on methane (extract)
Act now on methane (full version)
https://sites.google.com/site/runawayglobalwarming/the-non-disclosed-extreme-arctic-methane-threat

• Light M.P.R., 2012. 
Global extinction within one human lifetime as a result of a spreading atmospheric methane heatwave and surface firestorm 
https://arctic-news.blogspot.com/p/global-extinction-within-one-human.html

• Light M.P.R., 2012. Edited by Sam Carana. 
How much time is there left to act, before methane hydrate releases will lead to human extinction?

• Light M.P.R., 2011. Edited by Sam Carana. 
Use of beamed interfering radio frequency transmissions to decompose Arctic atmospheric methane clouds. 

• Light M.P.R., 2011. 
Stratospheric methane global warming veil

• Light M.P.R. and Solana C., 2002. 
Arctic Methane Hydrates: A Potential Greenhouse Gas Hazard

• Light M.P.R. and Solana C., 2002. 
Arctic methane hydrates - Mapping a potential greenhouse gas hazard. Abstract and Poster, EGS, Nice. In: Light, M.P.R. and Carana, S., 2011. Methane linked to Seismic Activity in the Arctic

• Light M.P.R. and Posey, H.H., 1992. 
Chapter 10 Diagenesis and its Relation to Mineralization and Hydrocarbon Reservoir Development: Gulf Coast and North sea Basins

• Light M.P.R., Posey, H.H., Kyle, J.R., and Price P.E., 1987. 
Integrated hydrothermal model for the Texas Gulf Coast Basin; origins of geopressured brines and lead-zinc, uranium, hydrocarbon, and cap rock deposits

• Light M.P.R., Posey, H.H., Kyle, J.R., and Price P.E., 1987. 
Model for the origins of geopressured brines, hydrocarbons, cap rocks and metallic mineral deposits: Gulf Coast, U.S.A.. In: Lerch, Ian, and O'Brien, J.J., Dynamical geology of salt and related structures: Orlando, Florida, Academic Press, pp. 787-830

• Light M.P.R., 1985. 
Structure, facies, continuity and internal properties of the Frio "A" sandstone, N.E. Hitchcock Field, Galveston County, Texas. In: Dorfman, M.H. and Morton, R.A. eds., Geopressured-Geothermal Energy, Proceedings of the Sixth U.S. Gulf Coast Geopressured-Geothermal Energy Conference: Pergamon, p. 229 - 238.


Saturday, February 5, 2022

When will humans go extinct?

In a recent paper, Guy McPherson, Beril Sirmacek and Ricardo Vinuesa discuss Environmental thresholds for mass-extinction events. Authors point at an image by Song et al. (2021) that shows how major mass extinctions over the past 541 million years (the Phanerozoic) are linked to temperature rises higher than 5.2°C and rates of change higher than 10°C/Myr.


Earlier, a 2018 study by Strona & Bradshaw found that at 5°C rise, most life on Earth will be extinct (see box below on the right, from an earlier post).
 
In the video below, authors Guy McPherson, Beril Sirmacek and Ricardo Vinuesa discuss their analysis 'Environmental thresholds for mass extinction events'.

Authors point out that, next to temperature rise and rates of change, there are further variables such as rates of deforestation, ocean acidification and spreading of toxic substances that can additionally contribute to cause species to disappear.

Accordingly,  many species are likely to go extinct at rises much lower than 5°C. 

Humans - who depend on many species - could go extinct with a 3°C rise, as the above-mentioned earlier post concluded.

This makes it even more critical to assess how much the temperature has already risen from pre-industrial. As illustrated by the image below, we may already be more than 2°C above pre-industrial and face a potentially huge temperature rise over the next few years.


Below, the video associated with the analysis Environmental thresholds for mass-extinction events.


The situation is dire and calls for comprehensive and effective action, as described in the Climate Plan.


Links

• Environmental thresholds for mass-extinction events - by Guy McPherson, Beril Sirmacek and Ricardo Vinuesa (2022)
https://arxiv.org/abs/2108.08933

• Thresholds of temperature change for mass extinctions - by Haijun Song et al. (2021)
https://www.nature.com/articles/s41467-021-25019-2

• Co-extinctions annihilate planetary life during extreme environmental change - by Giovanni Strona and Corey Bradshaw (2018)
https://www.ncbi.nlm.nih.gov/pmc/articles/PMC6233172

• When Will We Die?
https://arctic-news.blogspot.com/2019/06/when-will-we-die.html

• Pre-industrial
https://arctic-news.blogspot.com/p/pre-industrial.html

• Climate Plan
https://arctic-news.blogspot.com/p/climateplan.html