
Changes in clouds The high impact that changes in clouds have on the global temperature is becoming more and more clear as more scientific studies appear. Nonetheless, many people keep their heads in the clouds and act as if nothing is changing.
 |
| [ James Hasen et al. Earth’s albedo (reflectivity, in percent), seasonality removed ] |
 |
| [ James Hansen: Inferred contributions to reduced Earth albedo ] |
There are many reasons for this apathy. Loss of albedo due to loss of lower clouds, loss of sea ice and loss of the aerosol masking effect are all concepts that can be hard to grasp. As an example, the aerosol masking effect is getting progressively reduced, e.g. due to tightening shipping emissions regulations. The image above and on the right are by Hansen et al.
For the average person, many effects of the temperature rise are also hard to notice, such as stronger ocean stratification and stronger wind.
Feedbacks can be complex, e.g. decline of Arctic snow and ice comes with albedo loss as well as loss of the latent heat buffer, while Arctic amplification of the temperature rise can lead to changes in ocean currents and deformation of the Jet Stream. Compound impacts threaten to occur, such as formation of a lid at the surface of the North Atlantic Ocean enabling more heat to move to the Arctic Ocean, in turn causing huge amounts of methane to erupt from the seafloor, thus further contributing to the danger that the 1,200 ppm CO₂e cloud tipping point will get crossed that causes an extra 8°C rise, which this 2019 post warned about.
It is hard to reduce greenhouse gas emissions and to remove greenhouse gases from the atmosphere, while there also is a lag between carbon dioxide (CO₂) emissions and their maximum impact and a “lag time” between climate action and an actual decrease in CO₂ levels, due to transient growth as a result of delayed feedback. “It’s like trying to slow down an enormous train – you can’t stop it all at once, there will be a delay between applying the brakes and the train coming to a halt. And in talking about CO₂ levels, this could have catastrophic consequences,” explains Mahommad Farazmand, warning that even if CO₂ emissions decreased, transient growth would still push the climate into a tipping point, resulting in a temperature increase of 6°C.
One of the biggest causes why climate action is delayed, if not sabotaged, is the way climate change is or rather isn't reported in the media. In the video below, Paul Beckwith discusses the analysis by Hansen et al.
Further below, this post looks at two conditions that enable loss of lower clouds, i.e. high concentrations of greenhouse gases that result in higher temperatures and loss of sea ice. A daily CO₂ concentration of 431.25 ppm was recorded on May 10, 2025, at Mauna Loa, Hawaii, the highest daily average on record. One has to go back millions of years in time to find CO₂ concentrations this high, while the impact of high CO₂ concentrations back in history was lower due to lower solar output and while the rate of change was also much slower, as also discussed in an earlier post.
The image below shows monthly CO₂ concentrations at Mauna Loa, Hawaii.

 Moreover, the clouds tipping point is actually at 1200 ppm CO₂e (carbon dioxide equivalent), so when taking into account the impact of growth of other greenhouse gases and further mechanisms, the tipping point could be crossed much earlier than in 2030. The clouds tipping point is also discussed in the section at the end of this post.
One of the biggest causes why climate action is delayed, if not sabotaged, is the way climate change is or rather isn't reported in the media. In the video below, Paul Beckwith discusses the analysis by Hansen et al.
Further below, this post looks at two conditions that enable loss of lower clouds, i.e. high concentrations of greenhouse gases that result in higher temperatures and loss of sea ice.
High concentrations of greenhouse gases
Daily CO₂ concentrations have been below 430 parts per million (ppm) only once over the past 31 days at Mauna Loa, Hawaii, as illustrated by the image below, which shows CO₂ through May 20, 2025. The image also shows one recent hourly measurement approaching 440 ppm (arrow).
The image below shows monthly CO₂ concentrations at Mauna Loa, Hawaii.

High concentrations of greenhouse gases lead to high temperatures and the temperature rise itself comes with many feedbacks including more water vapor in the atmosphere, loss of sea ice and loss of lower clouds.
In the image below, a value of 430 ppm CO₂ has been manually added as a potential value for 2025 (blue circle), but this value is not included in the calculation of the trend, which is based only on 2019 through 2024 data (red circles). The trend points at the clouds tipping point at 1200 ppm CO₂ getting crossed in 2030. Crossing this tipping point could - on its own - push temperatures up by 8°C globally, in addition to the temperature rise caused by the extra CO₂ to reach the tipping point.

Temperature


One feedback of high temperatures and high concentrations of greenhouse gases is loss of sea ice. Polar amplification of the temperature rise is hitting the Arctic hard, and is also causing dramatic loss of Antarctic sea ice. Global sea ice area has been very low for the past few years, as illustrated by the image below. This has caused a lot of sunlight that was previously reflected back into space, to instead get absorbed by the sea surface. On May 20, 2025, global sea ice area was 17.6 million km², lowest on record for the day. Over the past few days, Arctic sea ice area has been second lowest for the time of year, Arctic sea ice area was only lower around this time of year in 2016, a strong El Niño year, as illustrated by the image below.
The image on the right is adapted from NASA and shows anomalies versus 1951-1980 of up to almost 4°C. The image also shows that the Arctic is heating up much faster than the rest of the world, a phenomenon also known as accelerated Arctic temperature rise.
The next image on the right illustrates how two of these feedbacks contribute to the accelerated Arctic temperature rise:
Feedback #1: albedo loss as sea ice melts away and as it gets covered by soot, dust, algae, meltpools and rainwater pools;
Feedback #19: distortion of the Jet Stream as the temperature difference narrows between the Arctic and the Tropics, in turn causing further feedbacks to kick in stronger, such as hot air moving into the Arctic and cold air moving out, and more extreme weather events bringing heavier rain and more intense heatwaves, droughts and forest fires that cause black carbon to settle on the sea ice.
Arctic sea ice volume has been at a record low for more than a year, as illustrated by the image below.
A 2024 study led by Norman Loeb finds that large decreases in stratocumulus and middle clouds over the sub-tropics and decreases in low and middle clouds at mid-latitudes are the primary reasons for increasing absorbed solar radiation trends in the northern hemisphere.
For years studies have pointed at the danger that, as temperatures rise, the rise itself can cause a reduction in lower clouds. Since lower clouds reflect a lot of sunlight back into space, their decrease is in turn pushing up and accelerating the temperature rise.
Earlier studies include this 2015 study, this 2017 study and this 2022 study. The image below is from a 2021 study led by Goode that warns that warming oceans cause fewer bright clouds to reflect sunlight back into space, resulting in the Earth's surface absorbing more energy instead.
 The white band around -60° (South) indicates that the Southern Ocean has not yet caught up with global warming, featuring low-level clouds that reflect a lot of sunlight back into space. Over time, these low clouds will decrease, resulting in more sunlight getting absorbed by the Earth's surface and causing additional global warming. A 2021 study led by Zhou finds that, after this 'pattern effect' is accounted for, committed global warming at present-day forcing rises by 0.7°C.
 What makes loss of lower clouds so dangerous is that it can continue, even if emissions remain constant. So, where loss of sea ice continues while emissions remain constant, the temperature can keep rising, and as the temperature rise results in further loss of lower clouds, this will accelerating the temperature rise.
The above image also illustrates how the temperature of the atmosphere can keep rising, even in the absence of further emissions, due to shrinking of heat sinks, such as loss of sea ice thickness or oceans taking up less heat, or as certain thresholds or tipping points get crossed.
Clouds Tipping Point
The clouds tipping point refers to abrupt disappearance of lower clouds, more specifically the stratocumulus decks. Stratus cloud decks cover about 20% of subtropical oceans and are prevalent in the eastern portions of those oceans—for example, off the coasts of California or Peru. The clouds cool and shade Earth as they reflect the sunlight that hits them back into space. Tapio Schneider et al. (2019) calculate that these clouds begin to break up when carbon dioxide equivalent (CO₂e) levels rise above the tipping point of 1,200 ppm.
Disappearance of these clouds will make the temperatures go up strongly and rather abruptly. By the time CO₂e levels will have risen to this clouds tipping point of 1,200 ppm CO₂e, temperatures will already have gone up a lot in line with the warming from rising CO₂e levels and feedbacks. On top of this, the clouds feedback itself triggers an additional surface warming of some 8°C globally, which is a tipping point and once crossed, it's very hard to revert, i.e. CO₂e would have to fall by a huge amount for lower clouds to reappear.
The image below illustrates that air temperatures in the Northern Hemisphere have been very high for the past few months, at times reaching record high temperatures for the time of year, e.g. the temperature in the Northern Hemisphere was 10.08°C on May 14, 2025, the highest temperature on record for that day.

These record high temperatures are the more significant as they were reached under ENSO-neutral conditions, as illustrated by the image below. On May 20, 2025, the sea surface temperature was 27.65°C, 0.19°C below 1991-2020, in Niño 3.4, an area in the Pacific (inset) that is critical to the development of El Niño.

Loss of sea ice
One feedback of high temperatures and high concentrations of greenhouse gases is loss of sea ice. Polar amplification of the temperature rise is hitting the Arctic hard, and is also causing dramatic loss of Antarctic sea ice. Global sea ice area has been very low for the past few years, as illustrated by the image below. This has caused a lot of sunlight that was previously reflected back into space, to instead get absorbed by the sea surface. On May 20, 2025, global sea ice area was 17.6 million km², lowest on record for the day.


The above image also shows that Arctic sea ice area around this time of year was much lower than it was in 2012, the year when Arctic sea ice would reach a record low later that year (2.24 million km² on September 12, 2012).
 |
| [ click on images to enlarge ] |
The next image on the right illustrates how two of these feedbacks contribute to the accelerated Arctic temperature rise:
 |
| [ Two out of numerous feedbacks ] |
Feedback #19: distortion of the Jet Stream as the temperature difference narrows between the Arctic and the Tropics, in turn causing further feedbacks to kick in stronger, such as hot air moving into the Arctic and cold air moving out, and more extreme weather events bringing heavier rain and more intense heatwaves, droughts and forest fires that cause black carbon to settle on the sea ice.

Loss of sea ice and loss of lower clouds are self-amplifying feedbacks, i.e. as temperatures rise, there is loss that accelerates the temperature rise, which in turn causes even more loss, etc. Due to this self-amplification, the temperature rise can accelerate. For more, also have a look at the Feedback section of this 2024 post, the Feedbacks page, and the section below.
Loss of lower clouds
Earlier studies include this 2015 study, this 2017 study and this 2022 study. The image below is from a 2021 study led by Goode that warns that warming oceans cause fewer bright clouds to reflect sunlight back into space, resulting in the Earth's surface absorbing more energy instead.
The image below shows the Pattern Effect, illustrating the danger that oceans are becoming less able to take up heat, thus leaving more heat in the atmosphere, which will in turn result in loss of lower clouds.

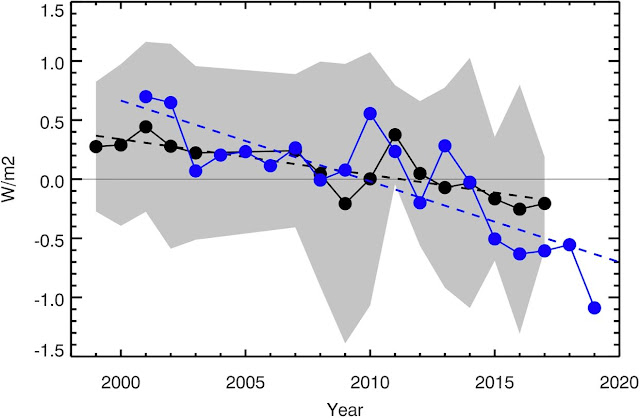
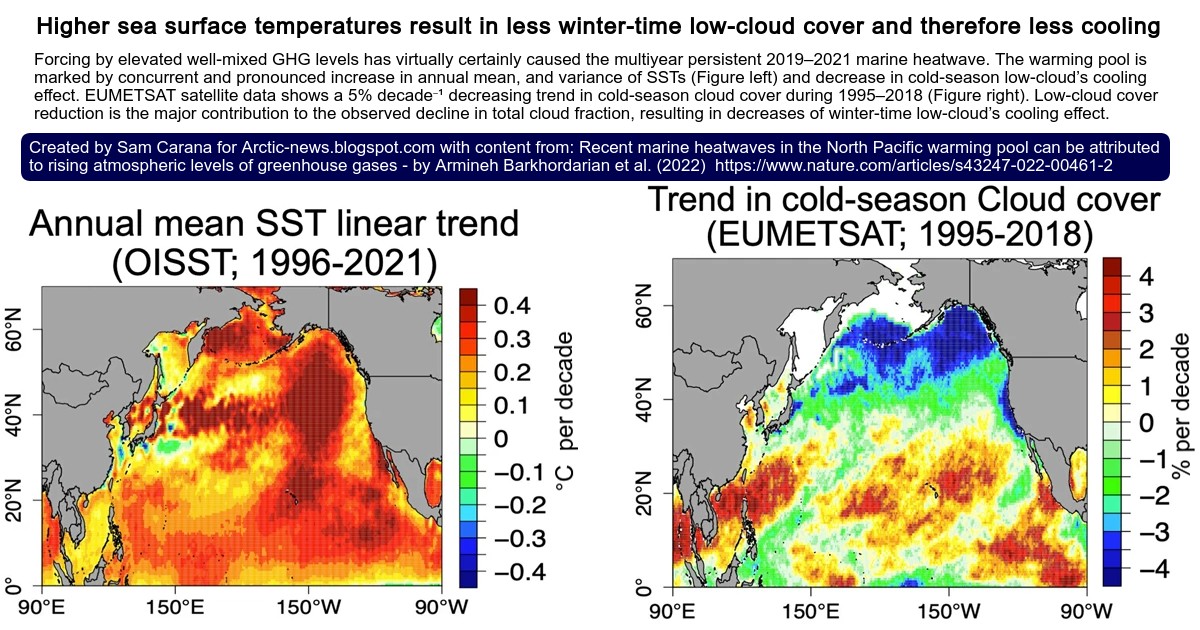
The combination image below is from a 2022 study led by Barkhordarian. Forcing by elevated well-mixed GHG levels has virtually certainly caused the multiyear persistent 2019–2021 marine heatwave. The warming pool is marked by concurrent and pronounced increase in annual mean, and variance of SSTs (Figure below left) and decrease in cold-season low-cloud’s cooling effect. EUMETSAT satellite data shows a 5% decade⁻¹ decreasing trend in cold-season cloud cover during 1995–2018 (Figure below right). Low-cloud cover reduction is the major contribution to the observed decline in total cloud fraction, resulting in decreases of winter-time low-cloud’s cooling effect.
 |
| [ the temperature in the atmosphere can keep rising, even in the absence of further emissions ] |
The clouds tipping point refers to abrupt disappearance of lower clouds, more specifically the stratocumulus decks. Stratus cloud decks cover about 20% of subtropical oceans and are prevalent in the eastern portions of those oceans—for example, off the coasts of California or Peru. The clouds cool and shade Earth as they reflect the sunlight that hits them back into space. Tapio Schneider et al. (2019) calculate that these clouds begin to break up when carbon dioxide equivalent (CO₂e) levels rise above the tipping point of 1,200 ppm.
Disappearance of these clouds will make the temperatures go up strongly and rather abruptly. By the time CO₂e levels will have risen to this clouds tipping point of 1,200 ppm CO₂e, temperatures will already have gone up a lot in line with the warming from rising CO₂e levels and feedbacks. On top of this, the clouds feedback itself triggers an additional surface warming of some 8°C globally, which is a tipping point and once crossed, it's very hard to revert, i.e. CO₂e would have to fall by a huge amount for lower clouds to reappear.
Climate Emergency Declaration
The situation is dire and the precautionary principle calls for rapid, comprehensive and effective action to reduce the damage and to improve the situation, as described in this 2022 post, where needed in combination with a Climate Emergency Declaration, as also discussed at this group.

The situation is dire and the precautionary principle calls for rapid, comprehensive and effective action to reduce the damage and to improve the situation, as described in this 2022 post, where needed in combination with a Climate Emergency Declaration, as also discussed at this group.

Links
• Large Cloud Feedback Confirms High Climate Sensitivity - by James Hansen et al. (2025)
• Maximum warming occurs about one decade after a carbon dioxide emission - by Katharine Ricke et al. (2014)
https://iopscience.iop.org/article/10.1088/1748-9326/9/12/124002
https://iopscience.iop.org/article/10.1088/1748-9326/9/12/124002
• News release: Time Lag Between Intervention and Actual CO2 Decrease Could Still Lead to Climate Tipping Point (2021)
https://news.ncsu.edu/2021/12/time-lag-could-still-lead-to-climate-tipping-point
• Study: Investigating climate tipping points under various emission reduction and carbon capture scenarios with a stochastic climate model - by Alexander Mendez et al. (2021)
https://royalsocietypublishing.org/doi/10.1098/rspa.2021.0697
discussed on facebook at:
https://www.facebook.com/groups/arcticnews/posts/10159745007124679
• NOAA - Daily Average Mauna Loa CO2
https://gml.noaa.gov/ccgg/trends/monthly.html
• NOAA - Mauna Loa - Carbon Cycle Gases
https://seaice.visuals.earth
https://link.springer.com/article/10.1007/s10712-024-09838-8
discussed on facebook at:
https://www.facebook.com/groups/arcticnews/posts/10161449934634679
• News release: Systematic warming pool discovered in the Pacific due to human activities
https://www.cliccs.uni-hamburg.de/about-cliccs/news/2022-news/2022-06-21-pm-marine-heat-waves.html
• Study: Recent marine heatwaves in the North Pacific warming pool can be attributed to rising atmospheric levels of greenhouse gases - by Armineh Barkhordarian et al. (2022)
https://www.nature.com/articles/s43247-022-00461-2
discussed on facebook at:
https://www.facebook.com/groups/arcticnews/posts/10160085259739679
Possible climate transitions from breakup of stratocumulus decks under greenhouse warming - by Tapio Schneider et al. (2019)
https://www.nature.com/articles/s41561-019-0310-1
• Transforming Society
https://arctic-news.blogspot.com/2022/10/transforming-society.html
• Climate Plan
https://arctic-news.blogspot.com/p/climateplan.html
• Climate Emergency Declaration
https://arctic-news.blogspot.com/p/climate-emergency-declaration.html
https://www.facebook.com/groups/arcticnews/posts/10161449934634679
• Positive tropical marine low-cloud cover feedback inferred from cloud-controlling factors - by Xin Qu et al. (2015)
https://agupubs.onlinelibrary.wiley.com/doi/epdf/10.1002/2015GL065627
• Interpretation of Factors Controlling Low Cloud Cover and Low Cloud Feedback Using a Unified Predictive Index - by Hideaki Kawai et al. (2017)
https://journals.ametsoc.org/view/journals/clim/30/22/jcli-d-16-0825.1.xml
• Estimated cloud-top entrainment index explains positive low-cloud-cover feedback - by Tsuyoshi Koshiro et al. (2022)
https://www.pnas.org/doi/10.1073/pnas.2200635119
• News release: Earth is dimming due to climate change
Warming oceans cause fewer bright clouds to reflect sunlight into space, admitting even more energy into earth's climate system
https://news.agu.org/press-release/earth-is-dimming-due-to-climate-change
• Study: Earth's Albedo 1998–2017 as Measured From Earthshine - by Philip Goode et al. (2021)
https://agupubs.onlinelibrary.wiley.com/doi/10.1029/2021GL094888
discussed on facebook at:
https://www.facebook.com/groups/arcticnews/posts/10159604016414679
• News release: Paying for emissions we’ve already released
https://www.llnl.gov/news/paying-emissions-weve-already-released
• Study: Greater committed warming after accounting for the pattern effect - by Chen Zhou et al. (2021)
https://www.nature.com/articles/s41558-020-00955-x
discussed on facebook at:
https://www.facebook.com/groups/arcticnews/posts/10159009753799679
and at:
https://www.facebook.com/SamCarana/posts/10164808484750161
and in the post at:
https://arctic-news.blogspot.com/2021/01/2020-hottest-year-on-record.html
https://www.cliccs.uni-hamburg.de/about-cliccs/news/2022-news/2022-06-21-pm-marine-heat-waves.html
• Study: Recent marine heatwaves in the North Pacific warming pool can be attributed to rising atmospheric levels of greenhouse gases - by Armineh Barkhordarian et al. (2022)
https://www.nature.com/articles/s43247-022-00461-2
discussed on facebook at:
https://www.facebook.com/groups/arcticnews/posts/10160085259739679
and in the post at:
https://arctic-news.blogspot.com/2023/05/will-there-be-arctic-sea-ice-left-in-september-2023.html
https://arctic-news.blogspot.com/2023/05/will-there-be-arctic-sea-ice-left-in-september-2023.html
https://www.nature.com/articles/s41561-019-0310-1
https://arctic-news.blogspot.com/2022/10/transforming-society.html
• Climate Plan
https://arctic-news.blogspot.com/p/climateplan.html
• Climate Emergency Declaration
https://arctic-news.blogspot.com/p/climate-emergency-declaration.html


