But while “leaders” fail to protect the people from global warming and nuclear war, they have succeeded splendidly in hiding the truth through the denial of climate change, accounting tricks and claims of reduction in domestic emissions, while in fact opening new coal mines, oil wells and fracked coal seams, exporting hydrocarbons through the entire global atmosphere.
As mean global temperatures, storms and sea level rise keep rising toward uninhabitable conditions in many parts of the world and thousands of nuclear missiles are aimed to be triggered by accident or design is it too early or already too late for Nuremberg-type trials for those responsible for the ongoing greenhouse gas saturation of the atmosphere and the creation of a doomsday machine?
Principle II. Internal law do not relieve the person who committed the act from responsibility under international law.
Principle III. A person who commits a crime under international law, as a Head of State or responsible governmentofficial, is not relieved from responsibility under international law.
Principle IV. An act under the order of Government or of a superior does not relieve a person from responsibility under international law. It is not an acceptable excuse to say 'I was just following my superior's orders'.
Principle V. Any person charged with a crime under international law has the right to a fair trial on the facts and law.
Principle VI. The crimes hereinafter set out are punishable as crimes under international law: Planning, preparation, initiation or waging of a war of aggression or a war in violation of international treaties, agreements or assurances; Leaders, organizers, instigators and accomplices participating in the formulation or execution of a common plan or conspiracy to commit any of the foregoing crimes are responsible for all acts performed by any persons in execution of such plan.
Principle VII. Complicity in the commission of a crime against peace, a war crime, or a crime against humanity as set forth in Principle VI is a crime under international law.
Since World war II every one of these principles has been and continues to be violated by the superpowers of the world, in particular principle VI, where “Leaders, organizers, instigators and accomplices participating in the formulation or execution of a common plan or conspiracy to commit any of the foregoing crimes are responsible for all acts performed by any persons in execution of such plan”.
None of these infringements falls within the category of ordinary human offences, rather their consequences for the Earth’s life support system are orders of magnitude larger than even their perpetrators could imagine, namely a major mass extinction of species analogous to the end-Ordovician (86% species extinguished), Permian-Triassic (96 Species extinguished) and Cretaceous-Tertiary (76% species extinguished) (Figure 1A) consequent on carbon emission rates some 9–10 times higher than those during onset of the Palaeocene-Eocene Thermal Maximum.
End Cretaceous (65 my) – the event that killed off the dinosaurs.
Palaeocene-Eocene thermal maximum
The current rise in atmospheric greenhouse gas levels at a rate faster than any of the previous mass extinction (Figure 1B) of species, including the K-T event and the Palaeocene-Eocene Thermal Peak (PETM), the latter roughly 55 million years ago lasting approximately 100,000 years.
The termination of the last glacial maximum (17.5–10 kyr ago) when the CO₂ rise rate was ~0.010 ppm CO₂/year and temperature ~0.00046°C/year as compared to the extreme modern rates during 1750-2020 of 0.0074°C/year and 0.04 ppm CO₂/year.
The coating of the Earth biosphere with the toxic residues of buried hydrocarbon and their processed plastic products in the form of carbon particles, oil spills, methane and carbon gases, microplastics and related rise in temperatures are threatening the fate of species, including human civilization.
Taking no heed of this warning, the species Homo “sapiens” has perfected a virtual doomsday machine under which it is living on borrowed time. Believing it is a ‘chosen species’ sapiens has rarely asked itself what has it been chosen for?
Leaders, so-called, forcing the atmosphere into a >4 degrees Celsius-high radioactive hell, including corporate chiefs, top executives, billionaires and their conscious-free political mouthpieces, members of parliaments, ministers and presidents, will be recorded in history as first in line to hell, driving the innocent hapless masses into oblivion.
But if “leaders” failed to protect the people from global warming and nuclear war, they succeeded splendidly in hiding the truth, starting with climate change denial, proceeding with accounting tricks and with claims of domestic emission reduction, while at the same time opening new coal mines, oil wells and coal seam gas fracking, exporting the hydrocarbons throughout the atmosphere.
These people know who they are, even if they do not fully understand the monstrous consequences of what they are doing or avoiding doing!
But if Nuremberg Trials are not conducted now, then when?
Andrew Glikson
A/Prof. Andrew Y Glikson Earth and Paleo-climate scientist
Heat stored in the Earth system 1960–2020: where does the energy go?
The above image is from a recent analysis by Karina von Schuckmann et al. and shows that the Earth is heating up, as outgoing radiation is suppressed. More and more extra heat is kept captive on Earth and gets stored mainly in oceans (89%), with smaller proportions getting stored on land (6-5%), in the cryosphere (4%) and in the atmosphere (1-2%). The above image also shows that, for the period going back to 1971, 1% more heat gets stored in the atmosphere, while 1% less gets stored on land, compared to the period going back to 2006. The image below takes a closer look at that.
Huge amounts of heat go into the ground (90%), with inland water bodies accounting for 0.7% and permafrost thawing accounting for 9%. At the same time, even more energy goes into evaporation from land and lakes, and into thawing permaforst. Water that previously remained present in the ground, is increasingly moving up into the atmosphere, since a warming atmosphere holds more water vapor (7% more water vapor for every 1°C warming) and thus sucks up increasingly more water. More energy gets consumed in the process of evaporation from land and from lakes, and in the process of thawing permafrost, but these are finite resources. Indeed, as land dries out, lakes dry up and permafrost shrinks, these resources dwindle. There is a point where there is no more water available in the soil, in lakes and in permafrost, and the heat previously consumed by evaporation and thawing will instead remain in the atmosphere. More water vapor in the atmosphere further amplifies the temperature rise, since water vapor is a potent greenhouse gas, and this also contributes to speeding up the temperature rise of the atmosphere.
An atmosphere that sucks up more water vapor increases the atmospheric vapor pressure deficit (VPD). A 2019 study warns that increased VPD reduces global vegetation growth:
"VPD greatly limits land evapotranspiration in many biomes by altering the behavior of plant stomata. Increased VPD may trigger stomatal closure to avoid excess water loss due to the high evaporative demand of the air. In addition, reduced soil water supply coupled with high evaporative demand causes xylem conduits and the rhizosphere to cavitate (become air-filled), stopping the flow of water, desiccating plant tissues, and leading to plant death. Previous studies reported that increased VPD explained 82% of the warm season drought stress in the southwestern United States, which correlated to changes of forest productivity and mortality. In addition, enhanced VPD limits tree growth even before soil moisture begins to be limiting."
The Land Evaporation Tipping Point can get crossed locally when water is no longer available locally for further evapotranspiration from the soil and vegetation, with the rise in land surface temperatures accelerating accordingly.
[ click on images to enlarge ]
An earlier post discussed the Terrestrial Biosphere Temperature Tipping Point, coined in a recent study that finds that at higher temperatures, respiration rates continue to rise in contrast to sharply declining rates of photosynthesis, which under business-as-usual emissions would nearly halve the land sink strength by as early as 2040.
Loss of ice could cause several other tipping points to be crossed soon. About a quarter of the 4% heat consumed by the cryosphere goes into melting glaciers. Disappearance of glaciers could be coined the Glaciers Tipping Point, since from that point heat can no longer go into melting the glacier and will instead go elsewhere.
Similarly, about a quarter of the 4% heat consumed by the cryosphere goes into melting Arctic sea ice. Loss of Arctic sea ice thus could cause several tipping points to get crossed, i.e. the latent heat tipping point (heat that now goes into converting ice into water) and the albedo feedback (sunlight that was previously reflected back into space), and all further incoming heat will from that point on instead go into heating up the Arctic.
So, will there be Arctic sea ice left in September 2023? Current conditions make that the outlook is grim, as sea surface temperatures and greenhouse gas levels are even higher than in previous years.
Surface temperatures
The image below, from an earlier post, illustrates the threat that the temperature rise may exceed 3°C. The blue trend, based on January 1880 to March 2023 data, shows how 3°C could be crossed in 2036. The magenta trend, based on January 2010 to March 2023 data, better reflects relatively short-term variables such as El Niño and illustrates how 3°C could be crossed as early as in 2025.
[ click on images to enlarge ]
The above image uses monthly NASA Land+Ocean temperature anomalies versus 1886-1915 that are further adjusted by 0.99°C to reflect ocean air temperatures, higher polar anomalies and a pre-industral base, as also discussed in the earlier post. The highest peaks (2016 and 2020) occurred during El Niño events and a new El Niño is now emerging.
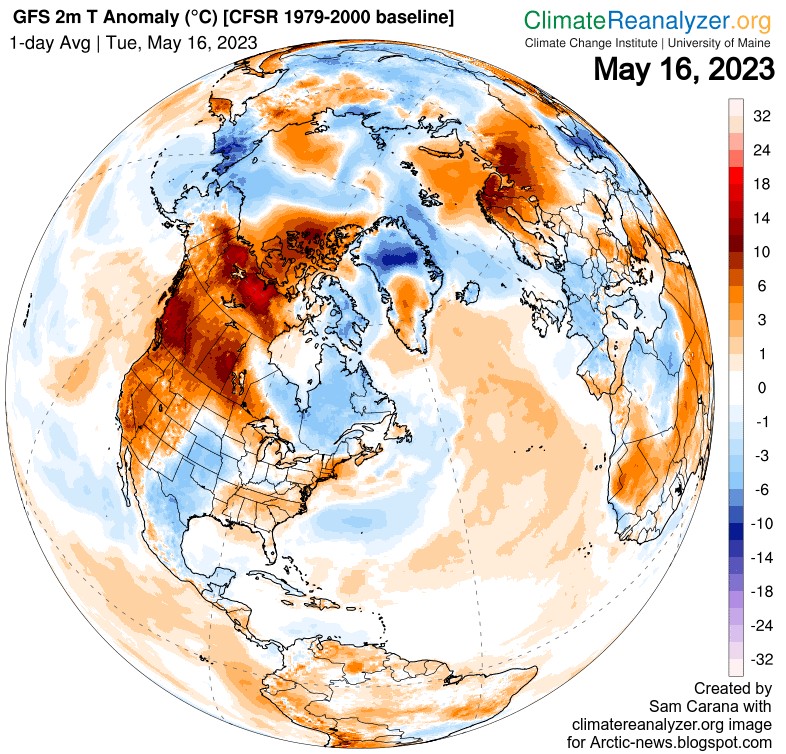
The image on the right shows high temperature anomalies on May 16, 2023, over the Canadian Arctic Archipelago. Such high anomalies occur with increasing frequency and intensity as the Jet Stream gets more and more distorted, as a result of the narrowing temperature difference between the North Pole and the Equator. This is just one out of numerous feedbacks that contribute to accelerate the temperature rise in the Arctic.
[ click on images to enlarge ]
The image on the right is adapted from NASA and shows anomalies versus 1951-1980 of up to 4.79°C. The image also shows that the Arctic is heating up much faster than the rest of the world, a phenomenon known as accelerated Arctic temperature rise.
The next image on the right illustrates how two of these feedbacks contribute to the accelerated Arctic temperature rise:
Feedback #1: albedo loss as sea ice melts away and as it gets covered by soot, dust, algae, meltpools and rainwater pools;
Feedback #19: distortion of the Jet Stream as the temperature difference narrows between the Arctic and the Tropics, in turn causing further feedbacks to kick in stronger, such as hot air moving into the Arctic and cold air moving out, and more extreme weather events bringing heavier rain and more intense heatwaves, droughts and forest fires that cause black carbon to settle on the sea ice.
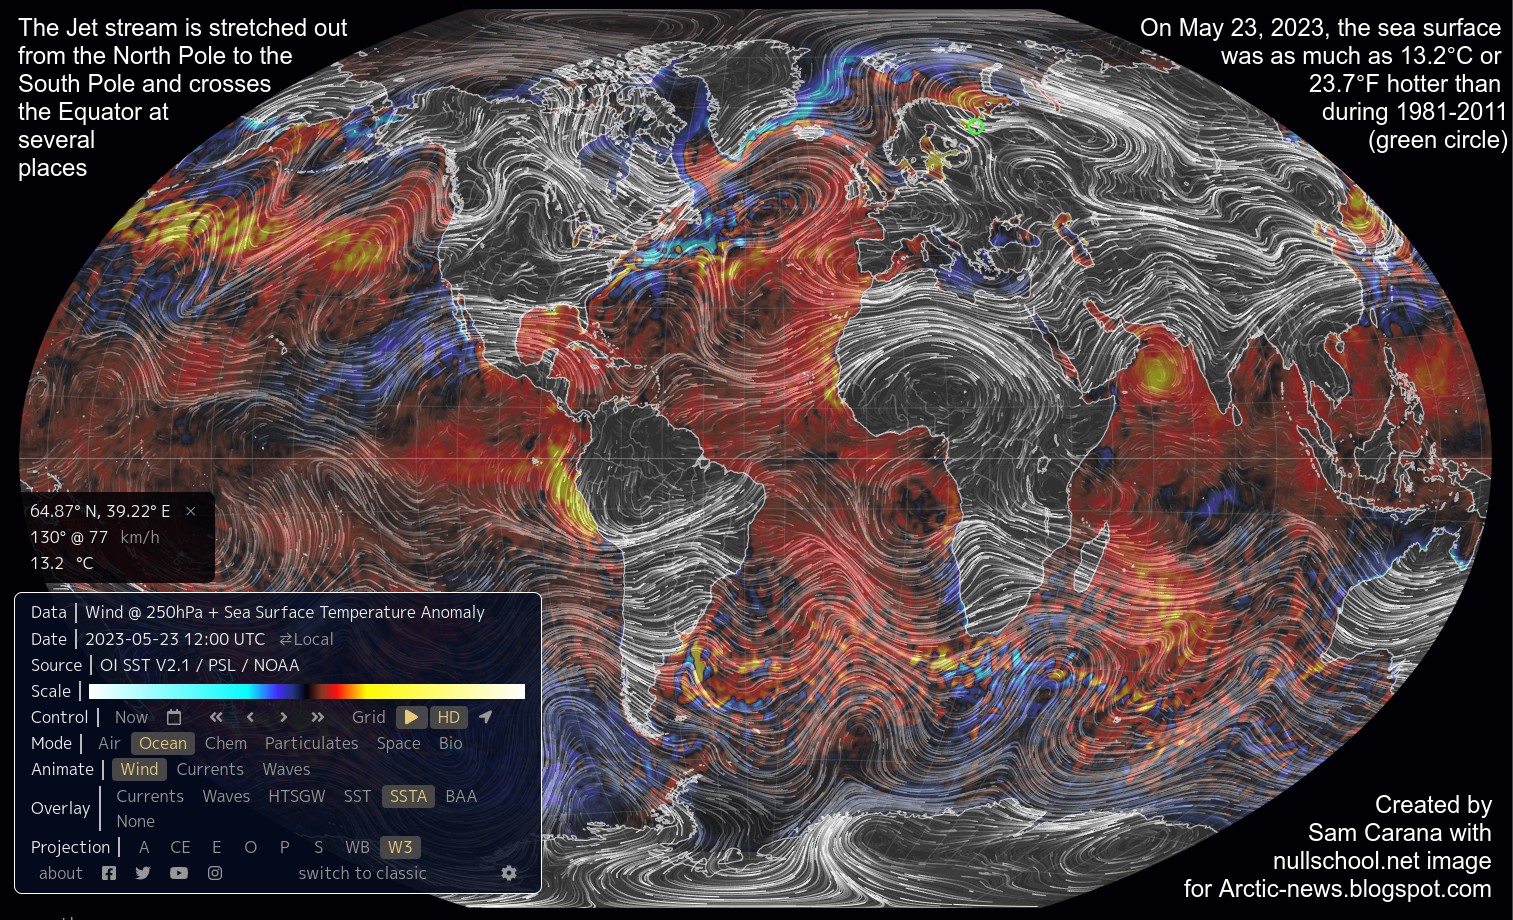
The above image shows the Jet Stream, deformed and stretched out from the North Pole to the South Pole, while crossing the Equator over the Pacific at several places on May 20, 2023.
The above image shows the Jet Stream, stretched out from the North Pole to the South Pole, crossing the Equator at several places on May 23, 2023, while the sea surface was as much as 13.2°C or 23.7°F hotter than during 1981-2022, more specifically, north of Russia, where the Jet Stream goes circular.
The image on the right shows that maximum temperatures were high in Russia up onto the Arctic on May, 24, 2023. This causes the water of rivers to heat up, resulting in high sea surface temperature anomalies in the Barents Sea. This hot river water contains less salt than ocean water, so the outflow from rivers tends to spread out over the surface of the Arctic Ocean.
[ click on images to enlarge ]
The image on the right shows a forecast for May 26, 2023. Very high temperature anomalies show up over North Russia, while heat extends over much of the Arctic Ocean.
Heatwaves threaten to cause rapid thawing of permafrost and the heat can extend from land to far over the Arctic Ocean, threatening to cause melting of Arctic sea ice from above.
Heatwaves also cause hot water from rivers to flow into the Arctic Ocean, threatening to cause melting of Arctic sea ice from the side.
Meanwhile, vast amounts of ocean heat are pushed by strong wind from the North Pacific and the North Atlantic into the Arctic Ocean, threatening to cause melting of Arctic sea ice from below.
The image on the right, adapted from NOAA, shows ocean heat moving toward the Arctic along the path of the Gulf Stream on May 24, 2023, with sea surface temperatures as high as 32.1°C.
As discussed in a recent post, the world sea surface temperature (between 60°South and 60°North) has been at 21°C or higher for as many as 38 days. Such temperatures are unprecedented in the NOAA record that goes back to 1981.
The image below shows that, at the end of May 2023, the temperature of the World sea surface (between 60°S and 60°N) was 20.9°C, much higher than it was in 2022 at that time of year (2022: orange, 2023: black).
The sea surface temperature on the North Atlantic (SST NA) is critical in regard to melting of the Arctic sea ice, which typically reaches its minimum annual extent in September. As the image below shows, SST NA was 21.5°C on May 17, 2023 (black line), half a degree Celsius higher than the 21°C reached on May 17, 2022 (orange). The outlook for Arctic sea ice is grim, as SST NA reached a record high of 24.9°C in early September 2022, when temperatures were suppressed by a La Niño. This time, an El Niño is on the way.
On May 11, 2023, the sea surface off the North American coast was as much as 10.7°C or 19.2°F (green circle) hotter than 1981-2011, as illustrated by the above image. A distorted Jet Stream is stretched out from pole to pole (wind at 250 hPa). The blue colors reflect melting of sea ice and runoff from land, as well as strong wind in the path of the Jet Stream. The high temperatures of the North Atlantic make the outlook for Arctic sea ice grim and the blue colors on the map could soon be overwhelmed by ocean heat.
Forcing by elevated well-mixed GHG levels has virtually certainly caused the multiyear persistent 2019–2021 marine heatwave. The warming pool is marked by concurrent and pronounced increase in annual mean, and variance of SSTs (Figure below left) and decrease in cold-season low-cloud’s cooling effect. EUMETSAT satellite data shows a 5% decade⁻¹ decreasing trend in cold-season cloud cover during 1995–2018 (Figure below right). Low-cloud cover reduction is the major contribution to the observed decline in total cloud fraction, resulting in decreases of winter-time low-cloud’s cooling effect.
Greenhouse gases levels
As the temperature rises at the surface as a result of emissions by people, more water vapor enters the atmosphere.
[ Click on images to enlarge ]
The IPCC says: "Water vapour feedback acting alone approximately doubles the warming from what it would be for fixed water vapour. Furthermore, water vapour feedback acts to amplify other feedbacks in models, such as cloud feedback and ice albedo feedback. If cloud feedback is strongly positive, the water vapour feedback can lead to 3.5 times as much warming as would be the case if water vapour concentration were held fixed".
The temperature rise due to extra water vapor works immediately, i.e. it goes hand in hand with rises due to other warming elements. Research indicates that, if the temperature of Earth rises by 1°C, the associated increase in water vapor will trap an extra 2 Watts of energy per m².
NASA explains that cloud formation depends on both water vapor and air temperatures. The colder the air, the more readily any water vapor in the air will condense into clouds.
As illustrated by the image on the right, a carbon dioxide level as high as around 427 ppm was recorded recently at Mauna Loa, Hawaii. This constitutes an increase of over 100 ppm since flask records started in 1969, as illustrated by the image below.
Politicians have forfeited the chance to influence the process and must from now on be kept as much as possible out of the climate picture. We, the people, must now support a Climate Emergency Declaration and support communities seeking effective climate action.
Hourly carbon dioxide (CO₂) levels as high as around 430 ppm were recorded at Mauna Loa recently, as illustrated by the above image. CO₂ typically reaches its annual high in May or June, so even higher levels could be reached in 2023.
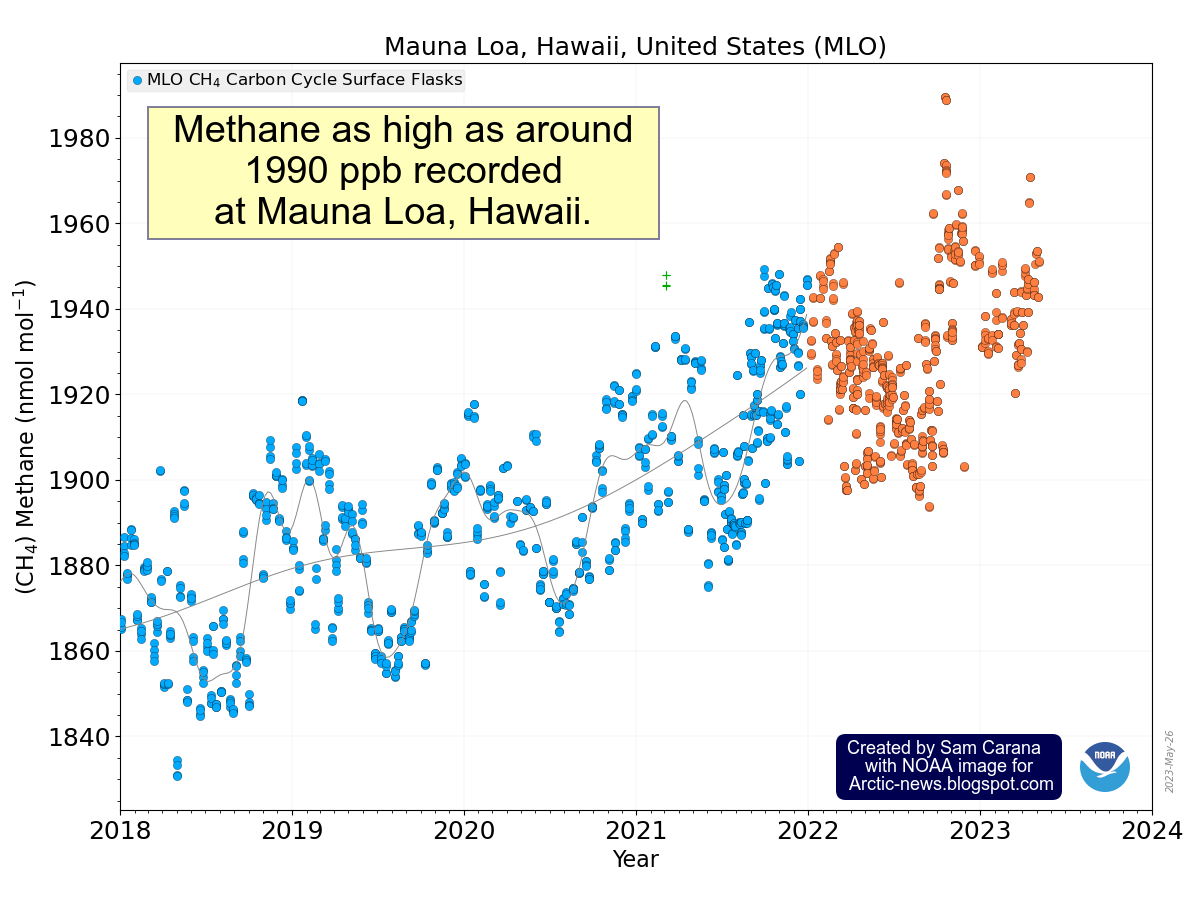
Even more crucially, methane emissions should be cut rapidly and dramatically, as discussed in an earlier post. The image on the right shows methane levels as high as around 1990 ppb recorded at Mauna Loa, Hawaii.
If a trend such as the one in the above image continues, the Clouds Tipping Point could be crossed as early as in 2027 due to forcing caused by the rise in methane alone.
Crossing the Clouds Tipping point, at 1200 ppm CO₂e, could on its own cause a further rise of 8°C and this could happen even earlier than in 2027 when further forcing other than just the forcing from methane is taken into account.
The above image uses NOAA's global marine surface data. Methane at higher altitude can reach even higher levels. As illustrated by an image in an earlier post, monthly methane recently rose to above 1950 ppb at Mauna Loa, Hawaii.
The above 1990 ppb peak methane measurement translates into 398 ppm CO₂e when using a 1-year GWP of 200 for methane. Adding this 398 ppm CO₂e to the above 427 ppm CO₂ would leave just 375 ppm CO₂e for further forcing.
[ click on images to enlarge ]
Part of that 375 ppm CO₂e for further forcing will be taken up by nitrous oxide (N₂O). NOAA registered 336.45 ppb for N₂O for January 2023, which at a GWP of 273 could translate into 91.85 ppm CO₂e. Further drivers of climate change are CFCs, HCFCs and HFCs, which NOAA gives about twice as much radiative forcing as N₂O.
As concentrations of greenhouse gases keep rising, when could the clouds tipping point be reached and to what extent could the rise in water vapor contribute to the tipping point of 1200 ppm CO₂e to get crossed? What is the influence of water vapor?
When averaged over the globe, increased water vapor does cause the temperature to rise, but this rise is often regarded to be outweighed by an increase in low cloud cover that causes more sunlight to be reflected back into space, and that thus causes cooling.
Even so, the situation is different at higher latitudes, where there is less sunlight, particularly during Winter. Furthermore, many feedbacks particularly affect the Arctic, resulting in acceleration of the temperature rise in the Arctic.
The danger is that, as temperatures rise, low cloud cover will decrease strongly at higher latitudes, and this will cause the rise in water vapor to be felt more strongly at higher latitudes, thus constituting another feedback that is felt particularly strongly at higher latitudes, contributing further to amplification of the temperature rise at higher latitudes.
In conclusion, the joint forcing of greenhouse gases is threatening to cause the Clouds Tipping Point at 1200 ppm CO₂e to get crossed. While it can get complicated when adding up the impact of the various drivers, the above calculations should act as a warning. The upcoming El Nino will cause a temperature rise that can additionally act as a trigger to unleash and accelerate further developments, such as caused by sea ice loss and changes in aerosols that can abruptly speed up the temperature rise, and thus also further raise the concentration of greenhouse gases including water vapor in the atmosphere and thus also further raise CO₂e levels.
Sea ice
Global sea ice extent is at a record low for the time of year again (20.99 million km² on May 30, 2023), following the record low extent of 15.5 million km² on February 11, 2023, as illustrated by the above image.
Rising temperatures in the Arctic threaten to trigger massive loss of Arctic sea ice within months.
While Arctic sea ice is still extensive, sea ice concentration is already getting lower in many places and there is open water in parts of the Beaufort Sea and Baffin Bay, as illustrated by the Uni of Bremen image on the right.
The image on the right, from DMI.dk shows Arctic sea ice volume getting very low on May 30, 2023, lower than any of the four previous years for the time of year.
The satellite images below, adapted from NASA Worldview, show that the sea ice had many cracks early May 2023.
The image below also shows that there was a lot of open water in the Beaufort Sea on May 7, 2023.
[ click on images to enlarge ]
The satellite image on the right shows many cracks in the sea ice just north of the northern tip of Greenland on May 3, 2023, further evidence that the sea ice is very vulnerable. Over the years, multi-year sea ice has fallen dramatically, raising the question whether there will be Arctic sea ice left in September 2023.
El Niño and further variables
Ominously, November 2023 temperature anomalies are forecast to be at the top end of the scale for a large part of the Arctic Ocean, as illustrated by the tropicaltidbits.com image below.
Note the high temperature anomalies forecast on the image below for the equatorial Pacific, indicative of an El Niño.
The image on the right, adapted from NOAA, shows a greater than 90% chance of El Niño persisting into the Northern Hemisphere winter.
Furthermore, sunspots are higher than predicted and the Tonga submarine volcano did add large amounts of water vapor high into the atmosphere.
Conditions and outlook
In summary, conditions are dire, i.e. emissions are high, greenhouse gases are at record high levels, temperatures are high, and sea surface temperatures are very high. Meanwhile, an El Niño is on the way and, combined with other variables, this could raise temperatures significantly.
All this could combine to cause massive loss of Arctic sea ice. Loss of Arctic sea ice comes with loss of the latent heat buffer and loss of albedo that threaten to trigger subsequent eruptions of methane from the seafloor of the Arctic Ocean, as has been described many times before, such as in this post, in this post and in this post.
In addition, there are further events and developments that could unfold and make things even worse, as described in more detail below. In short, a huge temperature rise threatens to unfold soon.
Climate Tipping Points and further Events and Developments
A 2021 study on oceans finds that, with increased stratification, heat from climate warming less effectively penetrates into the deep ocean, which contributes to further surface warming, while it also reduces the capability of the ocean to store carbon, exacerbating global surface warming. An earlier analysis warns about growth of a layer of fresh water at the surface of the North Atlantic resulting in more ocean heat reaching the Arctic Ocean and the atmosphere over the Arctic, while a 2023 study finds that growth of a layer of fresh water decreases its alkalinity and thus its ability to take up CO₂, a feedback referred to as the Ocean Surface Tipping Point.
The above image depicts only one sequence of events, or one scenario out of many. Things may eventuate in different orders and occur simultaneously, i.e. instead of one domino tipping over the next one sequentially, many events may occur simultaneously and reinforce each other. Further events and developments can be added to the list, such as ocean stratification and stronger storms that can push large amounts of warm salty water into the Arctic Ocean.
Loss of Arctic sea ice can be described as a tipping point as it accelerates heating up of the Arctic through albedo loss and comes with loss of the latent heat buffer, while loss of Permafrost in Siberia and North America can furthermore be regarded as a tipping point. Jointly, they can cause a huge temperature rise and trigger huge emissions of greenhouse gases, including vast amounts of methane. Similarly, loss of Antarctic sea ice, loss of the snow and ice cover on Greenland, on Antarctica and on mountaintops such as the Tibetan Plateau can each be seen as tipping points.
In conclusion, and as discussed in various earlier posts, there are many tipping points that could get crossed soon, including:
Few people wanted to accept that the temperature could rise by 20°C within decades, when the above image was made back in 2013, now almost a decade ago. To his great credit, Guy McPherson used the graph in several of his presentations (inset). Sadly, little or nothing has been done since to combat the temperature rise, and in hindsight, the speed at which the temperature rise could unfold and the resulting number of deaths may have been too conservative. In the May 2023 video below, Guy McPherson gives his views.
Links
• Heat stored in the Earth system 1960–2020: where does the energy go? - by Karina von schuckmann et al.