 |
| [ from earlier post ] |
At the Paris Agreement, adopted in 2015, nations pledged to limit the temperature rise to well below 2°C above pre-industrial levels, with efforts taken to limit it to 1.5°C above pre-industrial levels.

What is pre-industrial?
The Paris Agreement called for a special report by the IPCC on the impacts of global warming of 1.5°C above pre-industrial levels and related global greenhouse gas emission pathways. In the report, the IPCC first defines pre-industrial as "the multi-century period prior to the onset of large-scale industrial activity around 1750". Yet, the IPCC then proceeds to use the period 1850-1900 to "approximate" pre-industrial. This raises the questions, has the IPCC been downplaying the temperature rise and is this continuing?
When did the temperature start rising?
Oceans and the snow & ice cover have been acting as a buffer
While temperatures rose rapidly in the past, especially during the period leading up to the insolation peak, the speed at which temperatures did rise was moderated by oceans and by the snow and ice cover, in a number of ways:
In other words, much heat is taken up both by the oceans and by the snow and ice cover and this acts as a buffer, moderating the global temperature rise. Oceans absorb huge amounts of heat and due to the large mass of water, the temperature of the water in oceans is rising slower than the temperature of the atmosphere.
In 2020, the temperature anomaly on land was 1.58°C. In 1884, the temperature anomaly on land was -0.84°C. That's 2.42°C difference, for the anomaly from 1951-80, according to NASA data. The difference is even more pronounced when comparing the temperature rise over land (near surface) with the temperature rise of the water deeper in oceans.
As permafrost thaws and the snow and ice declines, huge amounts of energy are consumed in the process of melting. While the snow and ice cover has declined over time, it is still exercising this moderating effect today, be it that the speed at which this buffer is reducing in size is accelerating.
The rise in ocean temperature is further illustrated by the image below, showing the rise of the sea surface temperature on the Northern Hemisphere.
Emissions by people
While emission by people did accelerate since the start of the Industrial Revolution and even more recently, the rise in emission by people had already started thousands of years ago with the rise in modern agriculture and associated deforestation, as illustrated by the image below, based on Ruddiman et al. (2015).

The temperature has risen accordingly since those times. In the year 1520, temperatures had risen by 0.29°C, compared to some 5000 years earlier. When also taking into account that the temperature would have fallen naturally (i.e. in the absence of these emissions), the early temperature rise caused by people may well be twice as much.
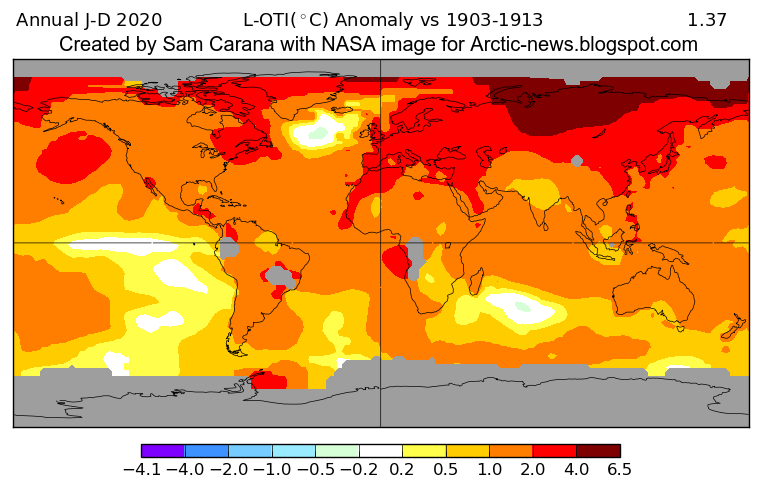
When changing the baseline to a decade centered around end 1920, the anomaly is 1.3°C.

 When using NASA data, starting from 2020, and looking back at the anomaly 100 years earlier, the above image show a difference of 1.30°C (see also debate and the image on the right which shows an even higher anomaly for a different baseline).
To assess the rise of Arctic temperatures over the years can be challenging.
 The temperature of the Arctic Ocean may have risen a lot over the years, but this rise may be missed when only taking measurements of the sea ice on top of the water. Areas covered by sea ice in the past may also have turned into open waters over the years. There may be little data available on how strong temperature rise was in the Arctic, especially when going back to before 1900.
This is illustrated by the image on the right, where the grey areas signify missing data.
 A lack of data can lead to the polar rise getting omitted and be replaced by, e.g., estimates that are based on global averages.
It's important to incorporate polar anomalies, given their strong rise. This is illustrated by the surface-air temperature anomaly WMO image on the right.
Temperatures have risen more in the Arctic than in the rest of the world, so it's important that especially Arctic temperatures are included in the global temperature rise.
Early temperature data for the Arctic Ocean is often missing, and this area is actually heating up faster than anywhere else on Earth, as illustrated by the image on the right. So, replacing missing data by global averages would severely downplay the temperature rise in the Arctic.
On land, what is referred to as the surface temperature is not the temperature of the surface (the soil or rock under people's feet). No, surface temperature is typically measured in the air 2 meters above the surface. After all, the air just above the ground is the space where people are present.
When using air temperatures over oceans, instead of sea surface temperatures, current temperatures could be some 0.1°C higher, as a 2018 study concludes.
Air temperatures over oceans are higher, as also illustrated by the image on the right, from a 2019 study, which shows the difference between using surface air temperature globally (black line), versus when sea surface temperature are used for oceans (dark blue line) and in case of incomplete coverage (light blue line).
The period from 1750 to the early 1900s

That still leaves the rise over the period from 1520 to 1750, for which another 0.2°C could be added. Remember that the IPCC defines the pre-industrial baseline as the multi-century period prior to 1750, i.e. as a period, and not as the endpoint of this period. So, how many centuries did the pre-industrial period cover? How much is multi? Is it 8, or perhaps 18? Merely going back about 2.3 centuries from 1750 to 1520 wouldn't do justice to the word 'multi' in multi-century. So, how much further should we go back than 1520?
3480 BC to 1520
As discussed at the top, the rise from 3480 BC to 1520 is 0.29°C. The most significant marker in the pre-industrial period is the year 3480 BC, since emissions by people from that time have been higher than the amount to negate the natural trend for the temperature to fall. From 3480 BC, forcing by agriculture and deforestation due to activities by people was stronger than the natural fall in temperature that would have eventuated in the absence of such activities. This makes the year 3480 BC most significant as a climate marker, so it makes sense to regard this as the base year for pre-industrial.
Total rise from pre-industrial to 2020
Adding up the different elements thus gives a total rise from pre-industrial that could be as high as 1.30°C + 0.1°C + 0.1°C + 0.3°C + 0.2°C + 0.29°C = 2.29°C.
Part of global warming caused by people is currently masked (∆M) due to aerosols, mainly sulfates from burning of fossil fuel. There's no doubt that such emissions should be reduced, but the point is that the temperature rise looks set to increase substantially as this masking effect disappears. The unmasked rise (∆U) is the temperature rise that we face as the necessary transition to clean, renewable energy take place, and it is the sum of the observed rise and the rise that is currently masked, i.e. ∆U = ∆O + ∆M.
The temperature rise that occurs as sulfate cooling falls away is only part of the rise to come in the relatively near future (∆F). Black carbon aerosols have a net heating effect and they could increase as people start burning more wood and as forest fires increase. The impact of CO₂ emissions reaches its peak only a decade after emission. Some changes can over time become more manifest, such as decline of the snow and ice cover. There could be non-linear changes due to feedbacks that are only now starting to kick in. Each of these elements can contribute significantly to the future temperature rise (∆F). In other words, ∆O + ∆F may well exceed 3°C soon.
For thousands of years, people have been causing emissions that made the temperature rise. About 3480 BC, the forcing of these emissions became even stronger than the natural trend for temperatures to come down, in line with decreasing Summer insolation on the Northern Hemisphere. The term "natural" can be ambiguous, as forest fires and albedo changes are often regarded as "natural forcing", but of course the deliberate acts of peat burning and cutting down trees can hardly be regarded as 'natural'.
Anyway, the net effect was that the temperature started to rise from 3480 BC, so it makes sense to calculate temperature anomalies versus that year as pre-industrial base. The rise from pre-industrial to 2020 could thus be as much as 2.29°C, which would mean that the thresholds set at the Paris Agreement have already been crossed and the rise from pre-industrial may well exceed 3°C soon, in turn effectively making 3°C the (new) threshold that should not be crossed, the more so since humans will likely go extinct with a 3°C rise.
Links
• Paris Agreement (adopted 2015)
https://unfccc.int/sites/default/files/resource/docs/2015/cop21/eng/l09r01.pdf
https://arctic-news.blogspot.com/2015/12/paris-agreement.html
• Geographical Distribution of Thermometers Gives the Appearance of Lower Historical Global Warming - by R. E. Benestad et al. (2019)
• Interpretations of the Paris climate target - by A. P. Schurer et al. (2018)
• Is the IPCC creating false perceptions, again?
The Paris Agreement called for a special report by the IPCC on the impacts of global warming of 1.5°C above pre-industrial levels and related global greenhouse gas emission pathways. In the report, the IPCC first defines pre-industrial as "the multi-century period prior to the onset of large-scale industrial activity around 1750". Yet, the IPCC then proceeds to use the period 1850-1900 to "approximate" pre-industrial. This raises the questions, has the IPCC been downplaying the temperature rise and is this continuing?
 |
| [ from earlier post ] |
When did the temperature start rising?
Orbital changes are responsible for Milankovitch cycles that make Earth move in and out of periods of glaciation, or Ice Ages. Summer insolation on the Northern Hemisphere reached a peak some 10,500 years ago, in line with the Milankovitch cycles, and insolation has since gradually decreased.
 |
| Summer insolation on the Northern Hemisphere in red and in langleys
per day (left axis, adapted from Walker, 2008). One langley is 1 cal/cm² (thermochemical calorie per square centimeter), or 41840 J/m² (joules per square meter), or about 11.622 Wh/m² (watt-hours per square meter). In blue is the mean annual sea surface temperature, given as the difference from the temperature over the last 1000 years (right axis, from Bova, 2021). |
The reason why the temperature didn't reach a peak at the same time of the peak in insolation some 10,500 years ago, is that oceans and remnants of glaciation acted as a buffer, moderating the temperature rise.
While temperatures rose rapidly in the past, especially during the period leading up to the insolation peak, the speed at which temperatures did rise was moderated by oceans and by the snow and ice cover, in a number of ways:
- snow and ice reflect much sunlight back into space
- energy from sunlight is consumed in the process of melting snow and ice, and thawing permafrost
- meltwater from sea ice and runoff from melting glaciers and thawing permafrost cools the oceans
- oceans take up more than 90% of the heat added by global warming
 |
| [ from earlier post ] |
 |
| [ The temperature rises faster over land than over oceans ] |
In 2020, the temperature anomaly on land was 1.58°C. In 1884, the temperature anomaly on land was -0.84°C. That's 2.42°C difference, for the anomaly from 1951-80, according to NASA data. The difference is even more pronounced when comparing the temperature rise over land (near surface) with the temperature rise of the water deeper in oceans.
The rise in ocean temperature is further illustrated by the image below, showing the rise of the sea surface temperature on the Northern Hemisphere.
 |
| [ from earlier post ] |
While emission by people did accelerate since the start of the Industrial Revolution and even more recently, the rise in emission by people had already started thousands of years ago with the rise in modern agriculture and associated deforestation, as illustrated by the image below, based on Ruddiman et al. (2015).

The temperature has risen accordingly since those times. In the year 1520, temperatures had risen by 0.29°C, compared to some 5000 years earlier. When also taking into account that the temperature would have fallen naturally (i.e. in the absence of these emissions), the early temperature rise caused by people may well be twice as much.
Calculating the total rise - 1920 to 2020
To calculate how much the temperature has risen since pre-industrial, let's start at 2020 and go back one century. The image below shows the rise between 1920 and 2020 compared to 1951-1980.
 |
| [ from earlier post ] |
When changing the baseline to a decade centered around end 1920, the anomaly is 1.3°C.

Compensating for missing data for polar anomalies
When going back to the early 1900s, there will be many areas for which data are missing, as indicated by the grey areas on the image on the right.
To assess the rise of Arctic temperatures over the years can be challenging.
 The temperature of the Arctic Ocean may have risen a lot over the years, but this rise may be missed when only taking measurements of the sea ice on top of the water. Areas covered by sea ice in the past may also have turned into open waters over the years. There may be little data available on how strong temperature rise was in the Arctic, especially when going back to before 1900.
This is illustrated by the image on the right, where the grey areas signify missing data.

It's important to incorporate polar anomalies, given their strong rise. This is illustrated by the surface-air temperature anomaly WMO image on the right.
Temperatures have risen more in the Arctic than in the rest of the world, so it's important that especially Arctic temperatures are included in the global temperature rise.
 |
| [ from earlier post ] |
Compensating for omissions by using higher polar anomalies thus may make sense, and 0.1°C is added to compensate for this.
Ocean air temperatures
To get global air temperature anomalies, another 0.1°C is therefore added; rather than using sea surface water temperatures, it makes sense to instead use air temperature above the water of the oceans.
For more on this, also see this 2019 study that concludes that missing data have been responsible for an underestimation of global warming by 0.1°C.
In other words, incorporation of the full polar temperature rise can mean that the global temperature rise requires an adjustment of some 0.1°C.
In other words, incorporation of the full polar temperature rise can mean that the global temperature rise requires an adjustment of some 0.1°C.
 |
| [ from earlier post ] |
Furthermore, the NASA data for oceans are sea surface temperatures, rather than air temperatures over oceans.
 |
| [ from earlier post ] |
When using air temperatures over oceans, instead of sea surface temperatures, current temperatures could be some 0.1°C higher, as a 2018 study concludes.
Air temperatures over oceans are higher, as also illustrated by the image on the right, from a 2019 study, which shows the difference between using surface air temperature globally (black line), versus when sea surface temperature are used for oceans (dark blue line) and in case of incomplete coverage (light blue line).

Another 0.3°C could be added for the rise for the period from 1750 to the early 1900s. The fact that humans did cause substantial warming between 1800 and 1900 is illustrated by the image on the right, from a post by Michael Mann, who adds that some 0.3°C greenhouse warming had already taken place between the year 1800 and the year 1900.
Rise from 1520 to 1750
That still leaves the rise over the period from 1520 to 1750, for which another 0.2°C could be added. Remember that the IPCC defines the pre-industrial baseline as the multi-century period prior to 1750, i.e. as a period, and not as the endpoint of this period. So, how many centuries did the pre-industrial period cover? How much is multi? Is it 8, or perhaps 18? Merely going back about 2.3 centuries from 1750 to 1520 wouldn't do justice to the word 'multi' in multi-century. So, how much further should we go back than 1520?
3480 BC to 1520
As discussed at the top, the rise from 3480 BC to 1520 is 0.29°C. The most significant marker in the pre-industrial period is the year 3480 BC, since emissions by people from that time have been higher than the amount to negate the natural trend for the temperature to fall. From 3480 BC, forcing by agriculture and deforestation due to activities by people was stronger than the natural fall in temperature that would have eventuated in the absence of such activities. This makes the year 3480 BC most significant as a climate marker, so it makes sense to regard this as the base year for pre-industrial.
Total rise from pre-industrial to 2020
Adding up the different elements thus gives a total rise from pre-industrial that could be as high as 1.30°C + 0.1°C + 0.1°C + 0.3°C + 0.2°C + 0.29°C = 2.29°C.
Full impact of human emissions and the rise to come
This 2.29°C is the observed temperature rise from pre-industrial (∆O), i.e. when extending pre-industrial back to 3480 BC. This ∆O is only part of the full impact of human activities. Without emissions by humans, temperatures would have fallen since 3480 BC, and they would have kept falling in line with the natural fall in Summer insolation on the Northern Hemisphere. The heating needed to negate or overcome this natural fall from 3480 BC could be symbolized as ∆N. Accordingly, the full heating impact due to human emissions from pre-industrial is ∆E = ∆O + ∆N.
The temperature rise that occurs as sulfate cooling falls away is only part of the rise to come in the relatively near future (∆F). Black carbon aerosols have a net heating effect and they could increase as people start burning more wood and as forest fires increase. The impact of CO₂ emissions reaches its peak only a decade after emission. Some changes can over time become more manifest, such as decline of the snow and ice cover. There could be non-linear changes due to feedbacks that are only now starting to kick in. Each of these elements can contribute significantly to the future temperature rise (∆F). In other words, ∆O + ∆F may well exceed 3°C soon.
Conclusion
For thousands of years, people have been causing emissions that made the temperature rise. About 3480 BC, the forcing of these emissions became even stronger than the natural trend for temperatures to come down, in line with decreasing Summer insolation on the Northern Hemisphere. The term "natural" can be ambiguous, as forest fires and albedo changes are often regarded as "natural forcing", but of course the deliberate acts of peat burning and cutting down trees can hardly be regarded as 'natural'.
Anyway, the net effect was that the temperature started to rise from 3480 BC, so it makes sense to calculate temperature anomalies versus that year as pre-industrial base. The rise from pre-industrial to 2020 could thus be as much as 2.29°C, which would mean that the thresholds set at the Paris Agreement have already been crossed and the rise from pre-industrial may well exceed 3°C soon, in turn effectively making 3°C the (new) threshold that should not be crossed, the more so since humans will likely go extinct with a 3°C rise.
Links
• Paris Agreement (adopted 2015)
https://unfccc.int/sites/default/files/resource/docs/2015/cop21/eng/l09r01.pdf
https://arctic-news.blogspot.com/2015/12/paris-agreement.html
• IPCC special report on the impacts of global warming of 1.5 °C above pre-industrial levels and related global greenhouse gas emission pathways (2018)
https://report.ipcc.ch/sr15/
• Late Holocene climate: Natural or anthropogenic? - by William Ruddiman et al. (2015)
https://report.ipcc.ch/sr15/
• Late Holocene climate: Natural or anthropogenic? - by William Ruddiman et al. (2015)
https://data.giss.nasa.gov/gistemp/maps/index_v4.html
• WMO
https://library.wmo.int/doc_num.php?explnum_id=10211
• Seasonal origin of the thermal maxima at the Holocene and the last interglacial - by Samantha Bova et al. (2021)
https://www.nature.com/articles/s41586-020-03155-x
• WMO
https://library.wmo.int/doc_num.php?explnum_id=10211
• Seasonal origin of the thermal maxima at the Holocene and the last interglacial - by Samantha Bova et al. (2021)
https://www.nature.com/articles/s41586-020-03155-x
• Estimating and tracking the remaining carbon budget for stringent climate targets - by Joeri Rogelj et al. (2019)
• Interpretations of the Paris climate target - by A. P. Schurer et al. (2018)
• IPCC keeps feeding the addiction
• Could temperatures keep rising?
• What Carbon Budget?
• What Carbon Budget?
• Most Important Message Ever
• How much warming have humans caused?
https://arctic-news.blogspot.com/2016/05/how-much-warming-have-humans-caused.html
• April 2020 temperatures very high
https://arctic-news.blogspot.com/2020/05/april-2020-temperatures-very-high.html
• Arctic Ocean invaded by hot salty water
https://arctic-news.blogspot.com/2021/05/arctic-ocean-invaded-by-hot-salty-water.html
• Heatwaves and the danger of the Arctic Ocean heating up
https://arctic-news.blogspot.com/2021/06/heatwaves-and-the-danger-of-the-arctic-ocean-heating-up.html
• Crossing the Paris Agreement thresholds
• Crossing the Paris Agreement thresholds
https://arctic-news.blogspot.com/p/crossing.html
• Climate Plan
https://arctic-news.blogspot.com/p/climateplan.html
• Climate Plan
https://arctic-news.blogspot.com/p/climateplan.html