Temperature rise
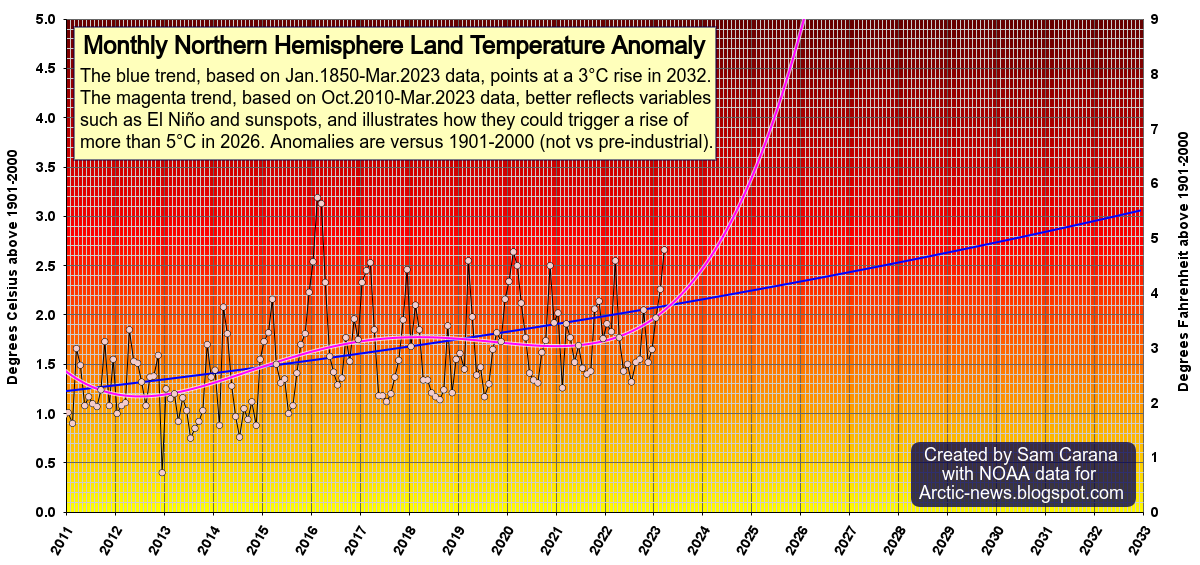
For many years, alarms have been raised about the temperature rise. Forest fires and methane releases in the Arctic contribute strongly to the temperature rise and to the danger of the clouds tipping point getting crossed, as discussed in an earlier post.
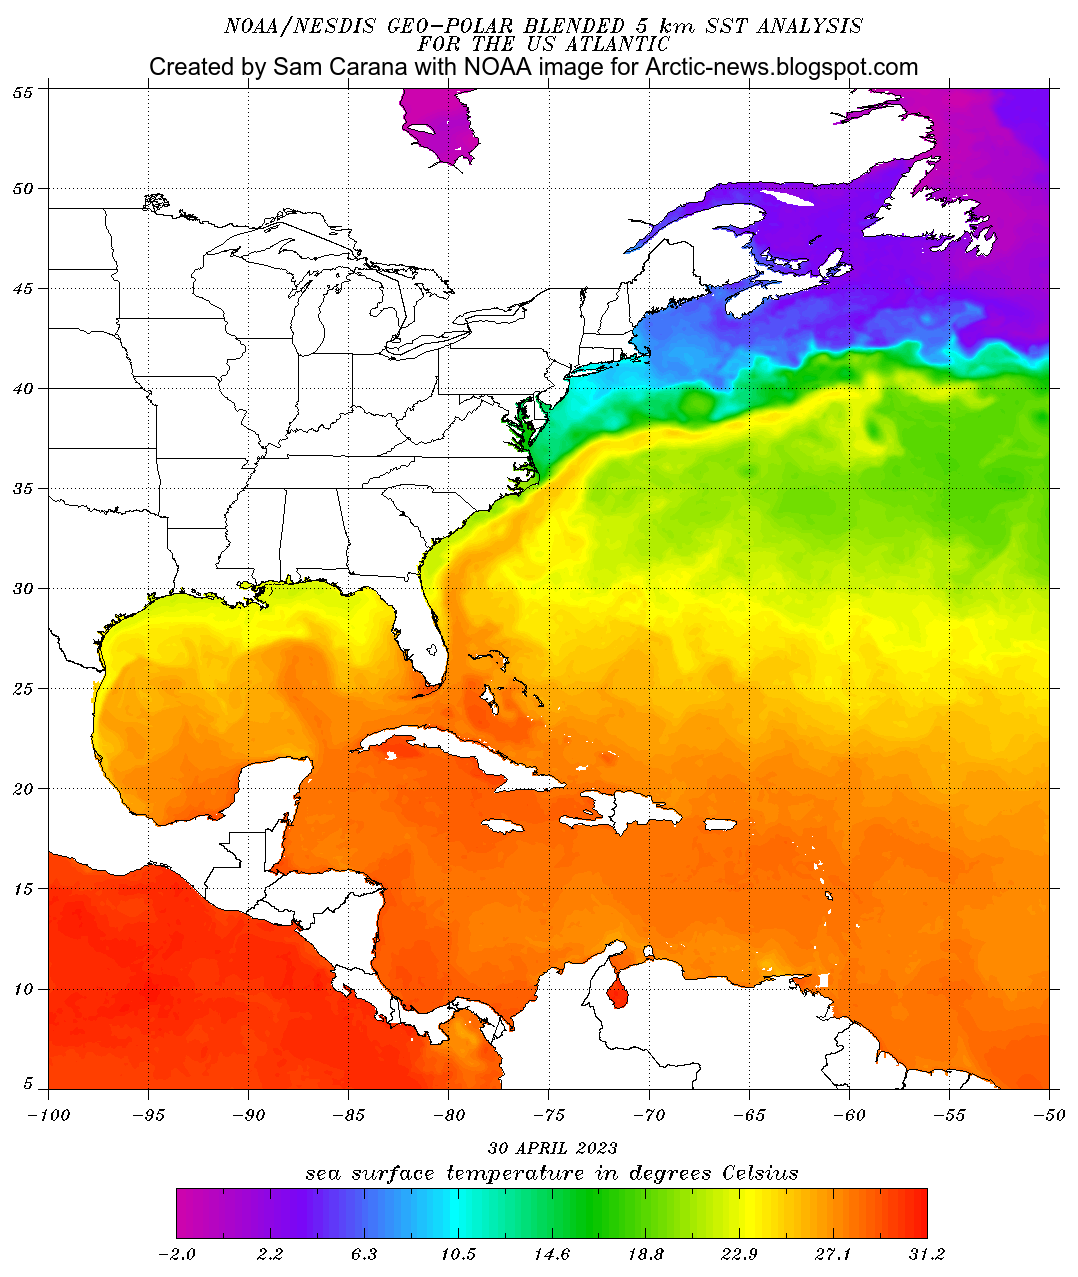
On July 21, 2026, the world (60°S–60°N, 0–360°E) sea surface temperature was 21.11°C, a record high temperature for the time of year and 0.92°C higher than 1982-2010, the highest anomaly versus 1982-2010 on record. The globe (inset top right) shows sea surface temperature anomalies versus 1991-2020 on July 21, 2026.

Ocean heat constitutes the primary cause of sea ice decline, as discussed in earlier post such as this one. In a publication issued July 13, 2026, NOAA announced El Niño to be present, adding that the 2026 El Niño will strengthen through the end of the year. The 2026 El Niño thus threatens to contribute to loss of virtually all Arctic sea ice in September 2026, as well as loss of virtually all Antarctic sea ice in early 2027, as also illustrated by the sea surface temperature anomaly forecast below for January 2027, a time of very rapid melting of Antarctic sea ice.
 |
| [ image from earlier post ] |
Clearly, politicians must take drastic action that includes action to increase resilience and action to reduce emissions caused by people. Yet, is effective action being taken? Sadly, it appears that politicians are not taking the necessary action and that - as a result - emissions are rising.
 |
| [ from earlier post, discussed on facebook ] |
Greenhouse gases rising
Greenhouse gas concentrations have been rising since 1750, as illustrated by the image on the right. Carbon dioxide and nitrous oxide have been rising rapidly, while methane has been rising even more rapidly.
More methane threatens to erupt from the seafloor, as discussed in earlier posts such as this one and this one.
The 2026 El Niño is strengthening and sea surface temperatures are already at a record high for the time of year, as illustrated by the image below.
Ocean heat threatens to destabilize sediments at the seafloor of the Arctic Ocean, causing massive eruptions of methane contained in those sediments in the form of methane hydrates and free gas held underneath these hydrates.
Ocean heat threatens to destabilize sediments at the seafloor of the Arctic Ocean, causing massive eruptions of methane contained in those sediments in the form of methane hydrates and free gas held underneath these hydrates.
Concentrations of gases

The image below, dated July 21, 2026, shows carbon monoxide concentrations at Mauna Loa, Hawaii. There is a huge spread in recent readings, which may reflect forest fires.

The image below, dated July 21, 2026, shows hourly average methane concentrations at Utqiaġvik, formerly known as Barrow, Alaska.

The image below, dated July 21, 2026, shows hourly average nitrous oxide concentrations at Utqiaġvik, formerly known as Barrow, Alaska.

Sadly, the images indicate that concentrations of greenhouse gases are not falling, they are rising instead. Forest fires are striking across the globe, which contributes to forests turning from carbon sinks into carbon sources, as discussed in posts such as this one. Furthermore, forest fires come with huge releases of carbon monoxide that deplete hydroxyl, in turn extending the lifetime of methane, as discussed in an earlier post.
Fossil fuel subsidies and investments

Meanwhile, fossil fuel companies are planning to extract more natural gas. The IEA estimates that around $1.2 trillion is set to be invested in oil, natural gas and coal in 2026. Natural gas investment is projected to rise to $330 billion, the highest level in a decade.
The IMF describes two different types of fossil fuel subsidies. Explicit subsidies (when the retail price is below a fuel’s supply cost) and implicit subsidies (when the retail price fails to include external costs, inclusive of the standard consumption tax). External costs include contributions to climate change through greenhouse gas emissions, local health damages (primarily premature deaths) through the release of harmful local pollutants like fine particulates, and traffic congestion, accident, and road damage externalities associated with the use of road fuels.

Conclusion
The situation is dire and unacceptably dangerous, and the precautionary principle necessitates the danger to be acknowledged, while facilitating rapid, comprehensive and effective action to reduce the damage and to improve the outlook, where needed in combination with a Climate Emergency Declaration, as described in posts such as in this 2022 post and this 2025 post, and as discussed in the Climate Plan group.

• NOAA - ENSO: Recent Evolution, Current Status and Predictions (issued July 13, 2026)
• Climate Reanalyzer
https://climatereanalyzer.org
https://www.imf.org/en/topics/climate-change/energy-subsidies
• IEA - World Energy Investment report 2026
https://www.iea.org/news/impacts-of-middle-east-conflict-set-to-reshape-energy-investment-plans-as-disruptions-put-focus-on-security (text)
• NOAA - Global Monitoring Laboratory - data viewer
https://gml.noaa.gov/dv/iadv
• Transforming Society
https://arctic-news.blogspot.com/2022/10/transforming-society.html
• Climate Plan
https://arctic-news.blogspot.com/p/climateplan.html
• Climate Emergency Declaration
https://arctic-news.blogspot.com/p/climate-emergency-declaration.html
https://gml.noaa.gov/dv/iadv
https://arctic-news.blogspot.com/2022/10/transforming-society.html
https://arctic-news.blogspot.com/p/climateplan.html
https://arctic-news.blogspot.com/p/climate-emergency-declaration.html