 |
| [ discussed at facebook ] |
Deformation of the Jet Stream
As the temperature rises, the Jet Stream is getting increasingly deformed in a number of ways:
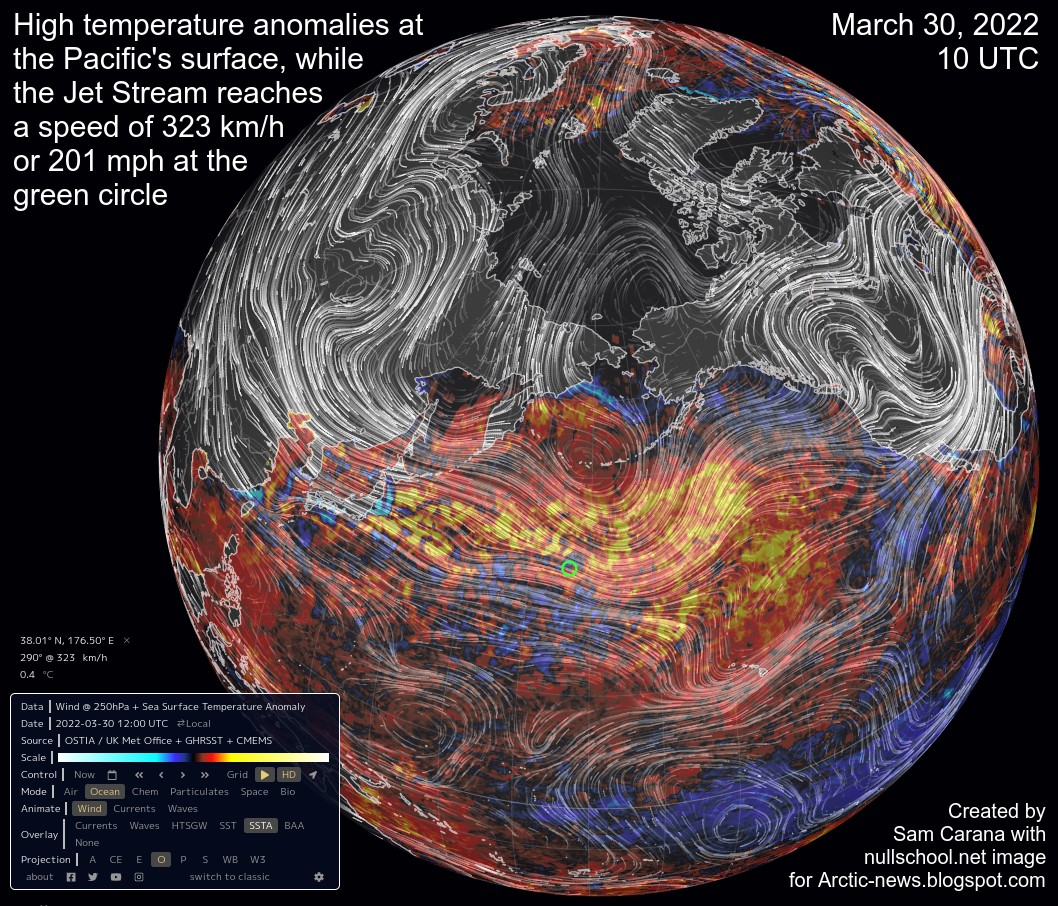
• Emissions by people heat up the air and oceans and make winds stronger, as discussed in an earlier post. This is illustrated by above image showing high temperature anomalies at the sea surface of the North Pacific on March 30, 2022 10 UTC, with the Jet Stream (at 250 hPa) reaching speeds as high as 323 km/h or 201 mph (green circle).
• Another mechanism affecting the Jet Stream is that, as oceans heat up, the temperature difference between land and oceans can widen and this can cause the Jet Stream to divert from the path it used to follow, as discussed in an earlier post.

The Jet Stream is then confronted with much different conditions over North America that make the Jet Stream branch out widely (white arrows), with one branch moving north and going circular over the Arctic Ocean, while at the other end a branch can be seen dipping below the Equator.
 |
| [ Arctic Ocean hit most strongly by temperature rise ] |
.• The Arctic gets hit hard by temperature rises, as illustrated by the image on the right, created with a NASA image that shows the highest temperature anomalies (of up to 3.86°C versus 1951-1980) over the Arctic Ocean, in particular during El Niño periods. This narrows the temperature difference between the North Pole and the Equator, slowing down the Jet Stream; this can prolong and amplify extreme weather events in the Northern Hemisphere.
Jet Stream goes vertical and circular
In extreme cases, the Jet Stream can go vertical and circular.


The above image shows the Jet Stream forming Omega patterns on the Northern Hemisphere, going circular over the Arctic Ocean and crossing the Equator.
The image on the right shows a sea surface temperature anomaly of 9.7°C (from 1981-2011) in the North Pacific, with the Jet Stream forming many circular patterns on July 25, 2021. The image also shows high sea surface temperature anomalies in the Arctic Ocean.
The image below shows how the Jet Stream on May 20, 2023, is stretched out from pole to pole, and is crossing the Equator at several places, where it is reaching speeds as high as 101 km/h or 63 mph (at the green circle).

The image at the top further illustrates this, showing the Jet Stream (on March 30, 2022) stretched out vertically, roughly along the International Date Line, 180° longitude, moving north from approximately latitude 20°S, close to Fiji, and crossing the Equator, pushed by circular wind patterns.
 |
| [ World climate zones ] |
How it used to be
 |
| Polar Jet Stream and Subtropical Jet Stream - NOAA image |
The Jet Stream used to circumnavigate the globe in narrow and straight bands, following a predominantly east-west path in line with its strength and with the deflection caused at specific latitudes by the Coriolis force.
 |
| Polar Jet Stream (blue) and Subtropical Jet Stream (red) - NOAA image |
For many years, Jennifer Francis et al. has been warning that deformation of the Jet Sytream will cause more extreme weather in mid latitudes. Over the years, Arctic-News has described this in a number of posts, such as Deformation of the Jet Stream and Opening the Doorways to Doom, as one of the feedbacks (#10) of accelerated Arctic warming.
Deformed Jet Stream causes havoc on the Northern Hemisphere
As a result of deformation of the Jet Stream, extreme weather events are striking with ever greater frequency and intensity. The Northern Hemisphere has been particularly hit by stronger heatwaves, forest fires, storms and flooding.
The image below, from NOAA, shows that in 2023, in the U.S. alone, a record number of 28 weather and climate disaster events took place that each caused damage of more than 1 billion dollar.

Over the last seven years (2016-2022), 122 separate billion-dollar disasters have killed at least 5,000 people and cost more than $1 trillion in damage.
For more, see also the Extreme Weather page.
Heat domes over the United States
As the image below shows, temperatures are forecast to be as high as 110.4°F or 43.6°C on July 27, 2021, at 23:00 UTC (in South Dakota at green circle).

The image below shows how temperatures rise due to deformation of the Jet Stream.
The image below shows the Jet Stream and the Misery Index (indicating the 'feels like' temperature).
As the image below shows, temperatures are forecast to be as high as 110.4°F or 43.6°C on July 27, 2021, at 23:00 UTC (in South Dakota at green circle).

The image below shows how temperatures rise due to deformation of the Jet Stream.
 |
The image below shows the Jet Stream and the Misery Index (indicating the 'feels like' temperature).

The image below shows the global picture, the Jet Streams and the Misery Index.

The image below shows the global picture, with the Jet Streams forming 'Omega Patterns'.

Impact of Jet Stream deformation on the Arctic
The Arctic Ocean is heating up as a result of increases in ocean heat and air temperatures. As sea ice melts away, feedbacks such as albedo changes further speed up the temperature rise. The Arctic Ocean is also heating up due to higher temperatures of river water.
The image below shows the situation on August 2, 2024, when sea surface temperatures were as much as 15.8°C or 28.4°F higher than 1981-2011 where water of the Ob River is flowing into the Arctic Ocean (green circle). The image also shows wind at 250 hPa, illustrating deformation of the Jet Stream, with many circular wind patterns, another feedback of the temperature rise.
Permafrost decline results in more meltwater entering the Arctic Ocean from rivers. Deformation of the Jet Stream can strengthen heatwaves that heat up river water, causing a lot more heat to enter the Arctic Ocean. A deformed Jet Stream can also strengthen storms and rainfall, further speeding up the thawing of permafrost and resulting in more run-off of water into the Arctic Ocean. Furthermore, deformation of the Jet Stream can at times strengthen wind patterns that speed up the flow of rivers and ocean currents, speeding up disintegration of sea ice and resulting in more heat getting abruptly pushed into the Arctic Ocean.
In conclusion, deformation of the Jet Stream can contribute to higher temperatures by strengthening extreme weather events such as circular wind patterns, heatwaves, fires, storms, lightning and rainfall, i.e. by strengthening their intensity, frequency, duration and area covered, as also discussed and illustrated in earlier posts such as this one.
 |
| [ from the post: Thickest sea ice breaking away from Greenland ] |
Permafrost decline results in more meltwater entering the Arctic Ocean from rivers. Deformation of the Jet Stream can strengthen heatwaves that heat up river water, causing a lot more heat to enter the Arctic Ocean. A deformed Jet Stream can also strengthen storms and rainfall, further speeding up the thawing of permafrost and resulting in more run-off of water into the Arctic Ocean. Furthermore, deformation of the Jet Stream can at times strengthen wind patterns that speed up the flow of rivers and ocean currents, speeding up disintegration of sea ice and resulting in more heat getting abruptly pushed into the Arctic Ocean.
In conclusion, deformation of the Jet Stream can contribute to higher temperatures by strengthening extreme weather events such as circular wind patterns, heatwaves, fires, storms, lightning and rainfall, i.e. by strengthening their intensity, frequency, duration and area covered, as also discussed and illustrated in earlier posts such as this one.
Further events and developments
Changes to the Jet Stream are part of developments associated with demise of the snow and ice cover in the Arctic that could jointly push up the temperature rise by as much 1.6°C and that could, in combination with further events and developments, result in a temperature rise by 2026 of as much as 18.43°C above pre-industrial, as illustrated by the image below.
 |
| [ from the Extinction page ] |
In the video below, Jim Massa discusses the Jet Stream and Polar Vortex.
• Heatwaves and the danger of the Arctic Ocean heating up
https://arctic-news.blogspot.com/2021/06/heatwaves-and-the-danger-of-the-arctic-ocean-heating-up.html
• More Extreme Weather
• NOAA: Billion-Dollar Weather and Climate Disasters• 2022 U.S. billion-dollar weather and climate disasters in historical context
• Blue Ocean Event
https://arctic-news.blogspot.com/p/blue-ocean-event.html
• Climate Plan
https://arctic-news.blogspot.com/p/climateplan.html
• Feedbacks
• Climate Plan
https://arctic-news.blogspot.com/p/climateplan.html
• Feedbacks
https://arctic-news.blogspot.com/p/feedbacks.html
• Albedo
https://arctic-news.blogspot.com/p/albedo.html
• Latent Heat
https://arctic-news.blogspot.com/p/latent-heat.html
• Cold freshwater lid on North Atlantic
https://arctic-news.blogspot.com/p/cold-freshwater-lid-on-north-atlantic.html
• Thickest sea ice breaking away from Greenland
• Albedo
https://arctic-news.blogspot.com/p/albedo.html
• Latent Heat
https://arctic-news.blogspot.com/p/latent-heat.html
• Cold freshwater lid on North Atlantic
https://arctic-news.blogspot.com/p/cold-freshwater-lid-on-north-atlantic.html
• Thickest sea ice breaking away from Greenland
https://arctic-news.blogspot.com/2024/07/thickest-sea-ice-breaking-away-from-greenland.html
• Jet Stream (this page)
https://arctic-news.blogspot.com/p/jet-stream.html
• Extreme Weather
• Jet Stream (this page)
https://arctic-news.blogspot.com/p/jet-stream.html
• Extreme Weather
https://arctic-news.blogspot.com/p/extreme-weather.html
• Insolation
https://arctic-news.blogspot.com/p/insolation.html
• Extinction
https://arctic-news.blogspot.com/p/extinction.html
• Clouds feedback
https://arctic-news.blogspot.com/p/clouds-feedback.html
• Insolation
https://arctic-news.blogspot.com/p/insolation.html
• Extinction
https://arctic-news.blogspot.com/p/extinction.html
• Clouds feedback
https://arctic-news.blogspot.com/p/clouds-feedback.html