

The above combination image shows the difference between June 11 and June 20, 2021.

The above combination image shows the difference between June 1 and June 30, 2022.

The left panel shows the depth of the Arctic Ocean, with darker blue indicating greater depth.
In the right panel, the light blue, green and yellow colors indicate the thickest ice, located in the shallow waters off the coasts of North America and Greenland. The darker blue colors indicate where much of the sea ice has melted away, from below, as also illustrated by the one-month animation below showing sea ice thickness up to June 22, 2022, with an added 8 days of forecasts. The white color indicates where the sea ice has melted away entirely, e.g. in the Bering Strait and north of Siberia, mainly due to warm water from rivers entering the Arctic Ocean.
 |
| [ feedback #14: Latent Heat ] |
The above 2014 image shows a number of feedbacks that are accelerating warming in the Arctic. Feedback #1 is the albedo feedback. Feedback #14 refers to the heat that is (less and less) going into melting the sea ice. The reason this heat is called latent (hidden) heat, is that it doesn't raise the temperature of the water, but instead gets consumed in the process of melting the ice.
Thinner Sea Ice
There is virtually no latent heat buffer left to consume further heat that is flowing from the Atlantic Ocean and the Pacific Ocean into the Arctic Ocean and that is melting the sea ice from below.
Loss of the Latent Heat Buffer is a self-reinforcing feedback loop, i.e. as the sea ice gets thinner every year, an increasing proportion of this heat is no longer consumed by melting the ice, but will instead get absorbed by the water and will thus contribute to an accelerating increase of the temperature of the water of the Arctic Ocean.

As illustrated by above combination image, the thickness of the sea ice is now substantially less than it used to be. The image compares June 1, 2021 (left), with June 1, 2015 (right).
The navy.mil animation below was run on September 15, 2020, and shows Arctic sea ice thickness over 30 days (last 8 frames are forecasts for September 16 - September 23, 2020).

The navy.mil animation below was run on June 19, 2021, and shows Arctic sea ice thickness over 30 days (last 8 frames are forecasts for June 20 - June 28, 2020).

Sea ice volume

The image on the right shows a trend based on PIOMAS data. The trend points at zero Arctic sea ice volume by September 2027. Note that the volume data in the image are averages for the month September — the minimum for each year is even lower.
A Blue Ocean Event occurs when virtually all sea ice disappears and the surface color changes from white (sea ice) to blue (ocean).
Many regard a Blue Ocean Event to have started once Arctic sea ice extent falls below 1 million km², and since zero volume implies zero extent, the image on the right indicates that a Blue Ocean Event could happen well before 2027.

The image on the right shows multiyear ice in the Arctic as of week 31 (July 30 to August 5) of the 2021 melt season, comparing this year to the same week in previous years of the satellite record that began in 1979.
On the image below, the upper left map shows sea ice age distribution toward the end of the melt season for 1985 and the upper right map shows the end of the 2020 melt season. The bottom time series of different age categories shows the minimum extent for 1985 to 2020.

Latent Heat Tipping Point
There is a point where the ice gets so thin that, instead of consuming most heat, it will consume virtually no heat anymore, so from that point, most further heat that is flowing from the Atlantic and Pacific Oceans into the Arctic Ocean will go into raising the temperature of the water.
As long as there is sea ice in the water, this sea ice will keep absorbing heat as it melts, so the temperature will not rise at the sea surface and remain at zero°C. The amount of energy that is consumed in the process of melting the ice is as much as it takes to heat an equivalent mass of water from zero°C to 80°C.

The video below, created by Stuart Trupp, shows how added heat at first (A) goes mainly into warming up water that contains ice cubes. From about 38 seconds into the movie, all heat starts going into the transformation of the ice cubes into water, while the temperature of the water doesn't rise (B). More than a minute later, as the ice cubes have melted (C), the temperature of the water starts rising rapidly again.
Ocean Heat
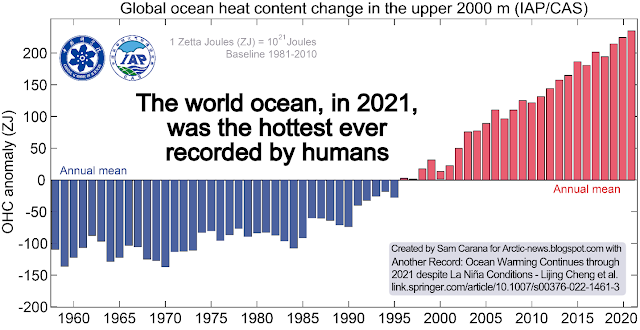
Ocean heat keeps rising; in 2021, despite La Niña conditions, ocean heat reached yet another record high, as illustrated by the above image, from an earlier post.
A 2019 analysis concludes that the latent heat tipping point gets crossed when the sea surface temperature anomaly on the Northern Hemisphere gets higher than 1°C above 20th century's temperature and when there is little or no thick sea ice left. As the image below indicates, the temperature anomaly of 1°C above the 20th century average looks set to be crossed in the course of the year 2021.
 |
| [ from the post Arctic Ocean invaded by hot, salty water ] |
Let's take a look at where global heating is going. Oceans are absorbing over 90% of global heating, as illustrated by the image below, and over the decade from 1993 to 2003, Arctic sea ice consumed 0.8% of global heating. As the amount of heat that is entering the Arctic Ocean is increasing, and as the sea ice is getting thinner each year, the tipping point is getting ever closer each year.

As the Latent Heat Tipping Point gets crossed, there may still be a thin layer of ice at the surface, at least as long as air temperatures are low enough to keep it frozen and as long as strong winds haven't pushed the sea ice out of the Arctic Ocean. This thin layer of ice will still consume some ocean heat below the surface, but at the same time it acts as a seal, preventing heat from the Arctic Ocean to enter the atmosphere. Once the tipping point is crossed, the bulk of the heat from the influx of warm water will go into heating up the water of the Arctic Ocean, with the danger that more heat will reach sediments that are located at the seafloor of the Arctic Ocean and that contain vast amounts of methane.
As illustrated by the image below by Nico Sun, the accumulation of energy going into melting the sea ice was at record high for the time of year on June 8, 2021.

In the video below, Guy McPherson discusses latent heat.
Two Tipping Points that are linked
With further melting of sea ice and thawing of permafrost, the Arctic Ocean can be expected to receive more heat over the next few years, more heat from direct sunlight, more heat from rivers, more heat from heatwaves and more ocean heat from the Atlantic Ocean and the Pacific Ocean.
Loss of the latent heat buffer is a tipping point that is linked to the subsequent destabilization of methane hydrates. So, there are two tipping points that are linked, and the latent heat tipping point gets crossed before the seafloor methane tipping point gets reached.
The latent heat tipping point is the point where sea ice loss is such that further incoming ocean heat that previously was consumed as Arctic sea ice melted, instead gets absorbed by the Arctic Ocean. This tipping point is estimated to correspond with a Northern Hemisphere ocean temperature anomaly of 1°C above the 20th century average.
The second tipping point occurs as more heat reaches the seafloor where it destabilizes hydrates contained in sediments at the seafloor. This tipping point comes with multiple self-reinforcing feedback loops such as explosive growth in methane volume setting off further destabilization. This tipping point will occur later, so it corresponds with a higher Northern Hemisphere ocean temperature anomaly.
 |
| [ from the post Sea surface temperature at record high ] |
As discussed in a 2020 post, loss of subsurface sea ice is only one of multiple tipping points hitting the Arctic. Once this Latent Heat Tipping Point is crossed and as the temperature of the oceans keeps rising, more heat will reach sediments that are located at the seafloor of the Arctic Ocean and that contain vast amounts of methane, as discussed in this page and this post.
The danger is that further heat will destabilize hydrates in these sediments, leading to explosive eruptions of methane, as its volume increases 160 to 180-fold when leaving the hydrates, and resulting in huge eruptions of methane both from the destabilizing hydrates and from methane that is present in the form of free gas underneath the hydrates.
The methane hydrates tipping point is estimated to get crossed as Northern Hemisphere ocean temperature anomaly goes beyond 1.35°C above the 20th century average.
