Thursday, January 28, 2021

What Carbon Budget?


Orbital changes are responsible for the Milankovitch cycles that make Earth move in and out of periods of glaciation, or Ice Ages. In line with these cycles, July insolation has slowly decreased over the last 12,000 years. While insolation was at a peak some 12,000 years ago, temperatures rose only slowly at first, as the ice receded that was formed during the most recent Ice Age.

Some previous temperature reconstructions did suggest that a peak on temperature was reached around 6,000 to 7,000 years ago, followed by a decrease in temperature that continued until the industrial age. However, Samantha Bova and colleagues found that most of the records used in such reconstructions represented seasonal temperatures rather than annual ones.

They developed a method of evaluating individual records for seasonal bias and after adjusting for this, they found that the mean annual sea surface temperature has been rising steadily for the past 12,000 years, due to retreating ice sheets during the period from 12,000 to 6,500 years ago and, more recently, due to the increase in greenhouse gas emissions.

Paris Agreement

The Paris Agreement calls for a global average temperature well below 2°C above pre-industrial levels, with efforts taken to ensure that the temperature doesn't exceed 1.5°C above pre-industrial levels.

So, what are pre-industrial levels? The 'pre-' in pre-industrial means before, suggesting that pre-industrial levels refers to levels as they were in times before the Industrial Revolution started.

While emission of greenhouse gases did rise strongly since the start of the Industrial Revolution, the rise in emission of greenhouse gases by people had already started some 7,000 years ago with the rise in modern agriculture and associated deforestation. As this new study shows, the temperature has risen steadily since.

A recent post confirms earlier warnings that the temperature may already have risen by more than 2°C, and it looks even more that way when moving the baseline back 7,000 years. Moreover, this recent post again warns that the temperature rise is accelerating as tipping points are getting crossed, feedbacks are growing stronger and further heating elements are kicking, all interacting in non-linear ways to speed up the temperature rise.

So, where are those efforts that politicians pledged they would be taking?

What Carbon Budget?

Instead of making a genuine effort, most politicians and mainstream media keep telling people that there was a carbon budget to be divided among polluters, as if people should happily continue to consume the polluting products that are pushed by advertisers, for decades to come.

In reality, however, there is no carbon budget, there is no pollution budget. Instead, there is just a huge pollution debt to be paid and every minute of delay causes exponential growth of this debt and of the prospect of rapid human extinction and ultimately extinction of all life on Earth.


Carbon dioxide levels

[ click on images to enlarge ]
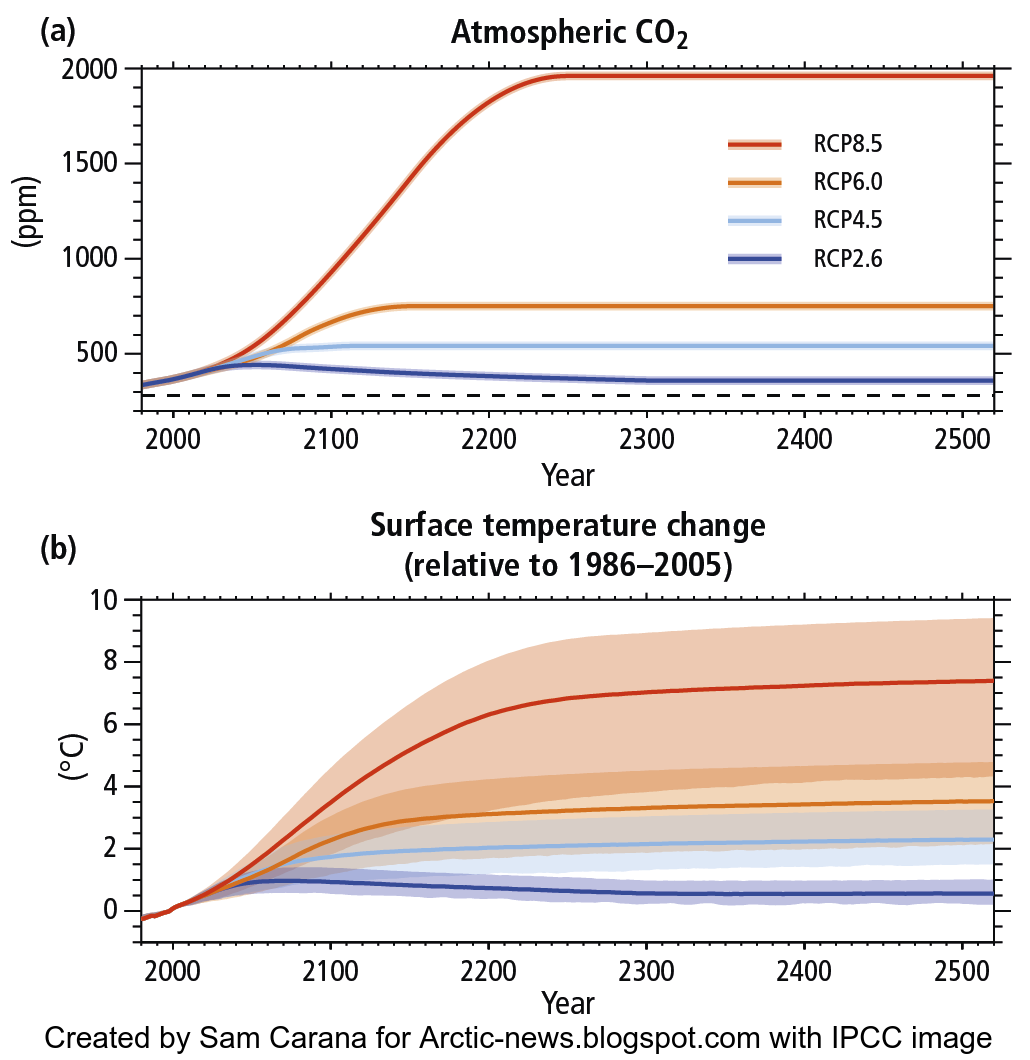
The IPCC image on the right shows CO₂ concentrations (up to 2000 ppm) and, underneath, the temperature rise (relative to 1986-2005) for the various RCPs.

What is RCP2.6? As the IPCC described in AR5, the temperature does not rise above 1.5°C (relative to 1850-1900) under the RCP2.6 scenario, and CO₂ concentrations do not rise above 421 ppm.

It looks like CO₂ concentrations will soon cross this 421 ppm threshold, given that the average daily CO₂ level recorded at Mauna Loa, Hawaii, was 419.12 ppm on February 4, 2021, a record high. The next day, February 5, 2021, the daily level was even higher, 419.45 ppm. The annual peak is typically reached in May, so levels can be expected to rise further over the next few months and cross the 421 ppm threshold soon.
 
Crossing the 421 ppm threshold implies that the RCP2.6 scenario is no longer applicable and that politicians won't be able to honour the pledges made at the Paris Agreement without geoengineering.

How much could temperatures rise? The IPCC image shows that the IPCC at the time when AR5 was written expected the temperature to rise by 3.7°C (with a range of 2.6°C to 4.8°C) under RCP8.5 by 2081–2100 relative to 1986–2005, and to keep rising beyond 2100 and reach 7.4°C and possibly 9.4°C relative to 1986–2005 over time.

The IPCC adds that, by 2100, CO₂ concentrations would reach 936 ppm under RCP 8.5., but when also (next to CO₂ concentrations) including the prescribed concentrations of CH₄ and N₂O, the combined CO₂-equivalent concentrations for RCP8.5 is expected to rise to 1313 ppm by the year 2100.

Meanwhile, a study discussed in an earlier post found that when the 1200 ppm CO₂-e gets crossed, the clouds feedback starts to kick in that can push the temperature up by an additional 8°C.

In line with IPCC AR5 figures, methane's Global Warming Potential (GWP) over a few years is 150.

Since AR5 was published, a study found methane's 100 year GWP to be 14% higher than the IPCC value. When applying an extra 14% to methane's short-term GWP of 150, it rises to 171.

Let's take the above (February 5, 2021) CO₂ level of 419.45 ppm and add the WMO 2019 level of methane of 1877 ppb, which with a short-term GWP of 171 translates into heating equivalent of 320.967 ppm CO₂.

Together, the existing CO₂ and methane add up to 740.417 ppm CO₂e, which is 459.583 ppm CO₂e away from the 1200 ppm CO₂e cloud tipping point.

In other words, a methane burst alone could drive up the methane level in the atmosphere by 2688 ppb, resulting in the cloud feedback tipping point to get crossed and the temperature to rise by an additional 8°C. Alternatively, the 1200 ppm CO₂e tipping point could get crossed due to a combination of warming elements, as depicted in the chart below, from a recent post, which would result in a total rise of 18°C when the cloud feedback is added on top. 


Methane

A reduction in carbon dioxide levels in the atmosphere isn't the only thing that's needed to avoid the worst of the looming temperature rise. There are many further lines of action that need to be implemented urgently, including efforts to reduce methane levels. 

Ominously, high methane levels were recorded by the N20 satellite on the morning of January 20, 2021. The combination image below shows levels as high as 2636 ppb at 695 mb (panel left) and 2806 ppb at 487 mb (panel right).


High methane levels were also recorded on January 30, 2021 pm. The combination image below shows that the SNPP satellite recorded levels as high as 2704 ppb at 487 mb (panel left), while the MetOp-2 satellite recorded levels as high as 2344 ppb at 469 mb (panel right). 


On February 4, 2021 pm, the MetOp-1 satellite recorded methane levels of 3071 ppb at 469 mb, as illustrated by the image in the right.

High peak methane levels are very worrying; what makes it even more threatening is that so much of the Arctic Ocean on above images is showing to be covered by high methane levels. 

This supports fears expressed earlier, such as in this recent post, about methane's present and future role in accelerating the temperature rise. 

Nitrous oxide

The image on the right shows nitrous oxide levels at Barrow, Alaska, over the past few years. 

Clearly, action to avoid nitrous oxide releases is also needed urgently.  

Conclusion

The situation is dire and calls for immediate, comprehensive and effective action as described in the Climate Plan.


Links

• Seasonal origin of the thermal maxima at the Holocene and the last interglacial - by Samantha Bova et al.
https://www.nature.com/articles/s41586-020-03155-x

• Palaeoclimate puzzle explained by seasonal variation
https://www.nature.com/articles/d41586-021-00115-x

• Important Climate Change Mystery Solved by Scientists
https://www.rutgers.edu/news/important-climate-change-mystery-solved-scientists

• Milankovitch (Orbital) Cycles and Their Role in Earth's Climate - by Alan Buis (NASA news, 2020)
https://climate.nasa.gov/news/2948/milankovitch-orbital-cycles-and-their-role-in-earths-climate

• Milankovitch cycles - Wikipedia
https://en.wikipedia.org/wiki/Milankovitch_cycles

• Insolation changes
https://energyeducation.ca/encyclopedia/Insolation
http://www.geo.umass.edu/faculty/bradley/bradley2003x.pdf

• Paris Agreement
https://unfccc.int/process-and-meetings/the-paris-agreement/the-paris-agreement
https://unfccc.int/sites/default/files/english_paris_agreement.pdf

• IPCC AR5 Synthesis Report — Figure 2.8

• IPCC AR5 Report, Summary For Policymakers

• Most Important Message Ever
https://arctic-news.blogspot.com/2019/07/most-important-message-ever.html

• Radiative forcing of carbon dioxide, methane, and nitrous oxide: A significant revision of the methane radiative forcing - by M. Etminan et al. 

• Possible climate transitions from breakup of stratocumulus decks under greenhouse warming - by Tapio Schneider et al.
https://www.nature.com/articles/s41561-019-0310-1

• A World Without Clouds

Thursday, January 21, 2021

The peril of high atmospheric methane levels

by Andrew Glikson

It is hard to think of a more Orwellian expression than that describing the increase in toxic atmospheric methane gas as “gas-led recovery.”

Several of the large mass extinctions of species in the geological past are attributed to an increase in atmospheric methane (CH₄), raising the temperature of the atmosphere and depriving the oceans from oxygen. Nowadays a serious danger to the atmosphere and for the life support systems ensues from the accelerated release of methane from melting Arctic permafrost, leaks from ocean sediments and from bogs, triggered by global warming. As if this was not dangerous enough, now methane is extracted as coal-seam-gas (CSG) by fracking (hydraulic fracturing) of coal and oil shale in the US, Canada, Australia and elsewhere.

Methane-bearing formations, located about 300m-1000m underground, are fracked using a mixture of water, sand, chemicals and explosives injected into the rock at high pressure, triggering significant amounts of methane leaks into the overlying formations and escaping into the atmosphere (Figure 1).

Figure 1. Schematic illustration of coal-seam-gas fracking (R. Morrison, by permission).

CSG is made primarily of about 95-97% methane, which possesses a radiative greenhouse potential close to X80 times that of carbon dioxide (CO₂). The radiative greenhouse effect of 1 kg methane is equivalent to releasing 84 kg of CO₂ and decreases to 20 and 34 times stronger than CO₂ over a 100-year period.

Global methane deposits (Figure 2) and Australian methane-bearing basins (Figure 3) are proliferating. Fugitive emissions from CSG are already enhancing the concentration of atmospheric methane above drill sites and range from 1 to 9 percent during the total life cycle emissions. The venting of methane from underground coal mines in the Hunter region of New South Wales has led to an atmospheric level in the region of 3,000 parts per billion, with methane levels of 2,000 ppb (parts per billion) extending to some 50 km away from the mines. Peak readings in excess of 3000 ppb represent an amalgamation of plumes from 17 sources. The median concentration within this section was 1820 ppb, with a peak reading of 2110 ppb. Compare this with mean methane values at Mouna Loa, Hawaii, of 1884 ppb.

Figure 2. Global gas hydrate potential regions.

Fugitive methane emissions from natural, urban, agricultural, and energy-production landscapes of eastern Australia. The chemical signature of methane released from fracking is found in the atmosphere points to shale gas operations as the source.


Figure 3. Australian basins, oil and gas resources.

The accumulation of many hundreds of billions tons of unoxidized methane-rich organic matter in Arctic permafrost, methane hydrates in shallow Arctic lakes and seas, bogs, and as emanated from cattle and sheep, has already enhanced global methane growth over the last 40 years at rates up to 14 ppb/year (Figure 4).


Figure 4. Growth of atmospheric methane, Mouna Loa, Hawaii,
between 1980-2020 and 2017-2020. NOAA.

The current methane level of 1884 ppb, ~2.5 times the <800 ppb level in 1840AD, indicating a mean growth rate of ~7 ppb/year (Figure 4), is attributable to in part to animal husbandry, permafrost melting, release from marine hydrates and bogs, and in part emissions from shale gas and fracking. as in the United States and Canada.

High levels of methane reduce the amount of oxygen breathed from the air, with health consequences. The toxicity of methane is corroborated in a 2018 study in Pennsylvania showing children born within a mile or two of a gas well were likely to be smaller and less healthy. New York State, Maryland, and Vermont have banned fracking, as have France and Germany.

According to Hansen (2018) reserves of unconventional gas exceed 10,000 GtC (billion tons carbon). Given the scale of methane hydrate deposits around the world (Figure 5), sufficient deposits exist to perpetrate a global mass extinction of species on a geological scale.¹ 

Figure 5. Estimates of methane held in hydrates worldwide. Estimates of the Methane Held in Hydrates Worldwide. Early estimates for marine hydrates (encompassed by the green region), made before hydrate had been recovered in the marine environment, are high because they assume gas hydrates exist in essentially all the world’s oceanic sediments. Subsequent estimates are lower, but remain widely scattered (encompassed by the blue region) because of continued uncertainty in the non-uniform, heterogeneous distribution of organic carbon from which the methane in hydrate is generated, as well as uncertainties in the efficiency with which that methane is produced and then captured in gas hydrate. Nonetheless, marine hydrates are expected to contain one to two orders of magnitude more methane than exists in natural gas reserves worldwide (brown square) (U.S. Energy Information Administration 2010). Continental hydrate mass estimates (encompassed by the pink region) tend to be about 1 per cent of the marine estimates.


¹ For 2.12 billion ton of carbon (GtC) raising atmospheric CO₂ by 1ppm, and assuming about 50% of CO₂ remaining in the atmosphere, future drilling and fracking could in principle raise atmospheric CO₂ level to about or more than 2000 ppm.


Andrew Glikson

Dr Andrew Glikson
Earth and Paleo-climate scientist
ANU Climate Science Institute
ANU Planetary Science Institute
Canberra, Australia


Books:
The Asteroid Impact Connection of Planetary Evolution
http://www.springer.com/gp/book/9789400763272
The Archaean: Geological and Geochemical Windows into the Early Earth
http://www.springer.com/gp/book/9783319079073
Climate, Fire and Human Evolution: The Deep Time Dimensions of the Anthropocene
http://www.springer.com/gp/book/9783319225111
The Plutocene: Blueprints for a Post-Anthropocene Greenhouse Earth
http://www.springer.com/gp/book/9783319572369
Evolution of the Atmosphere, Fire and the Anthropocene Climate Event Horizon
http://www.springer.com/gp/book/9789400773318
From Stars to Brains: Milestones in the Planetary Evolution of Life and Intelligence
https://www.springer.com/us/book/9783030106027
Asteroids Impacts, Crustal Evolution and Related Mineral Systems with Special Reference to Australia
http://www.springer.com/us/book/9783319745442


Friday, January 15, 2021

2020: Hottest Year On Record

NASA data show that 2020 was the hottest year on record.


The image below shows that high temperature in 2020 hit Siberia and the Arctic Ocean.

In above images, the temperature anomaly is compared to 1951-1980, NASA's default baseline. When using an earlier baseline, the data need to be adjusted. The image below shows a trendline pointing at an 0.31°C adjustment for a 1900 baseline. 


Additional adjustment is needed when using a 1750 baseline, while it also makes sense to add further adjustment for higher polar anomalies and for air temperatures over oceans, rather than sea surface water temperatures. In total, a 0.78°C adjustment seems appropriate, as has been applied before, such as in this analysis. For the year 2020, this translates in a temperature rise of 1.8029°C versus the year 1750.

Three trends: blue, purple and red

Will the global temperature rise to 3°C above 1750 by 2026? The blue trend below is based on 1880-2020 NASA Land+Ocean data and adjusted by 0.78°C to reflect a 1750 baseline, ocean air temperatures and higher polar anomalies, and it crosses a 3°C rise in 2026.


The trend shows a temperature for 2020 that is slightly higher than indicated by the data. This is in line with the fact that we're currently in a La Niña period and that we're also at a low point in the sunspot cycle, as discussed in an earlier post. The blue trend also shows that the 1.5°C treshold was already crossed even before the Paris Agreement was accepted. 


The second (purple) trend is based on a shorter period, i.e. 2006-2020 NASA land+ocean (LOTI) data, again adjusted by 0.78°C to reflect a 1750 baseline, ocean air temperatures and higher polar anomalies. The trend approaches 10°C above 1750 by 2026. The trend is based on 15 years of data, making it span a 30-year period centered around end 2020 when extended into the future for a similar 15 year period. The trend approaches 10°C above 1750 in 2026.

The trend is displayed on the backdrop of an image from an earlier post, showing how a 10°C rise could eventuate by 2026 when adding up the impact of warming elements and their interaction.


The stacked bars are somewhat higher than the trend. Keep in mind that the stacked bars are for the month February, when anomalies can be significantly higher than the annual average.

Temperature rise for February 2016 versus 1900.
In the NASA image on the right, the February 2016 temperature was 1.70°C above 1900 (i.e. 1885-1914). In the stacked-bar analysis, the February 2016 rise from 1900 was conservately given a value of 1.62°C, which was extended into the future, while an additional 0.3°C was added for temperature rise from pre-industrial to 1900.

Later analyses such as this one also added a further 0.2°C to the temperature rise, to reflect ocean air temperatures (rather than water temperatures) and higher polar anomalies (note the grey areas on the image in the right).

Anyway, the image shows two types of analysis on top of each other, one analysis based on trend analysis and another analysis based on a model using high values for the various warming elements. The stacked-bar analysis actually doesn't reflect the worst-case scenario, an even faster rise is illustrated by the next trend, the red line.

The third (red) trend suggests that we may have crossed the 2°C treshold in the year 2020. The trend is based on a recent period (2009-2020) of the NASA land+ocean data, again adjusted by 0.78°C to reflect a 1750 baseline, ocean air temperatures and higher polar anomalies.


Where do we go from here? 

It's important to acknowledge the danger of acceleration of the temperature rise over the next few years. The threat is illustrated by the image below and shows up most prominently in the red trend. 


Of the three trends, the red trend is based on the shortest period, and it does indicate that we have aready crossed the 2°C treshold and we could be facing an even steeper temperature rise over the next few years.

We're in a La Niña period and we're also at a low point in the sunspot cycle. This suppresses the temperature somewhat, so the 2020 temperature should actually be adjusted upward to compensate for such variables. Importantly, while such variables do show up more when basing trends on shorter periods, the data have not be adjusted for this in this case, so the situation could actually be even worse. 

At a 3°C rise, humans will likely go extinct, while most life on Earth will disappear with a 5°C rise, and as the temperature keeps rising, oceans will evaporate and Earth will go the same way as Venus, a 2019 analysis warned. 

Dangerous acceleration of the temperature rise 

There are many potential causes behind the acceleration of the temperature rise, such as the fact that the strongest impact of carbon dioxide is felt ten years after emission, so we are yet to experience the full wrath of the carbon dioxide emitted over the past decade. However, this doesn't explain why 2020 turned out to be the hottest year on record, as opposed to - say - 2019, given that in 2020 carbon dioxide emissions were 7% lower than in 2019.

James Hansen confirms that the temperature rise is accelerating, and he points at aerosols as the cause. However, most cooling aerosols come from industries such as smelters and coal-fired power plants that have hardly reduced their operations in 2020, as illustrated by the image below, from the aerosols page


Above image shows that on December 17, 2020, at 10:00 UTC, sulfate aerosols (SO₄) were as high as 6.396 τ at the green circle. Wind on the image is measured at 850 hPa.

Could the land sink be decreasing? A recent study shows that the mean temperature of the warmest quarter (3-month period) passed the thermal maximum for photosynthesis during the past decade. At higher temperatures, respiration rates continue to rise in contrast to sharply declining rates of photosynthesis. Under business-as-usual emissions, this divergence elicits a near halving of the land sink strength by as early as 2040. While this is a frightening prospect, it still doesn't explain why 2020 turned out to be the hottest year on record. 

Oceans are taking up less heat, thus leaving more heat in the atmosphere. The danger is illustrated by the image below. 


The white band around -60° (South) indicates that the Southern Ocean has not yet caught up with global warming, featuring low-level clouds that reflect sunlight back into space. Over time, the low clouds will decrease, which will allow more sunlight to be absorbed by Earth and give the world additional warming. A recent study finds that, after this 'pattern effect' is accounted for, committed global warming at present-day forcing rises by 0.7°C. While this is very worrying, it still doesn't explain why 2020 turned out to be the hottest year on record. 

Ocean stratification contributes to further surface warming, concludes another recent study
"The stronger ocean warming within upper layers versus deep water has caused an increase of ocean stratification in the past half century. With increased stratification, heat from climate warming less effectively penetrates into the deep ocean, which contributes to further surface warming. It also reduces the capability of the ocean to store carbon, exacerbating global surface warming. Furthermore, climate warming prevents the vertical exchanges of nutrients and oxygen, thus impacting the food supply of whole marine ecosystems."
"By uptaking ~90% of anthropogenic heat and ~30% of the carbon emissions, the ocean buffers global warming. [The] ocean has already absorbed an immense amount of heat, and will continue to absorb excess energy in the Earth’s system until atmospheric carbon levels are significantly lowered. In other words, the excess heat already in the ocean, and heat likely to enter the ocean in the coming years, will continue to affect weather patterns, sea level, and ocean biota for some time, even under zero carbon emission conditions."
Many feedbacks are starting to kick in with greater ferocity, with tipping points threatening to get crossed or already crossed, such as the latent heat tipping point, i.e. loss of the ocean heat buffer, as Arctic sea ice keeps getting thinner. As the above map also shows, the temperature rise is hitting the Arctic Ocean particularly hard. At least ten tipping points are affecting the Arctic, including the latent heat tipping point and the methane hydrates tipping point, as illustrated by the image below.
 
[ from an earlier post ]

A combination of higher temperatures and the resulting feedbacks such as stronger ocean stratification, stronger wind, decline of Arctic snow and ice and a distorted Jet Stream is threatening to cause formation of a lid at the surface of the North Atlantic Ocean that enables more heat to move to the Arctic Ocean. This could cause huge amounts of methane to erupt from the seafloor, thus contributing to cause the 1,200 ppm CO₂e cloud tipping point to get crossed, resulting in an extra 8°C rise, as an earlier post and a recent post warned.

Dangerous acceleration of the temperature rise

The danger is that methane is erupting in the Arctic from the seafloor and that this increasingly contributes to methane reaching the stratosphere. 

While methane initially is very potent in heating up the atmosphere, it is generally broken down relatively quickly, but in the atmosphere over the Arctic, there is very little hydroxyl to break down the methane. 

Methane also persists much longer in the stratosphere, which contributes to its accumulation there. 


Large amounts of methane may already be erupting from the seafloor of the Arctic Ocean, rising rapidly and even reaching the stratosphere

This danger is getting little public attention. The NOAA image on the right shows the globally-averaged, monthly mean atmospheric methane abundance derived from measurements from marine surface sites. Measurements that are taken at sea level do not reflect methane very well that is rising up from the seafloor of the Arctic Ocean, especially where the methane rises up high in plumes. 

Satellite measurements better reflect the danger. The image on the right shows that the MetOp-1 satellite recorded peak methane levels as high as 2715 ppb at 469 mb on the morning of January 6, 2021. 

Most of the high (magenta-colored) levels of methane are located over oceans and a lot of them over the Arctic Ocean. 

The next image on the right shows the situation closer to sea level, at 586 mb, where even less of the high levels of methane show up over land, indicating that the methane originated from the seafloor. 

The third image on the righ shows the situation even closer to sea level, at 742 mb, and almost all high levels of methane show up over the Arctic Ocean and over areas where the Atlantic Ocean and the Pacific Ocean border on the Arctic. 

Because methane is lighter than air and much lighter than water, methane erupting from the seafloor will quickly rise up vertically. While much of the methane that is released from the seabed can get broken down in the water by microbes, methane that is rising rapidly and highly concentrated in the form of plumes will leave little opportunity for microbes to break it down in the water column, especially where waters are shallow,
as is the case in much of the Arctic Ocean.

As methane hydrates destabilize, methane will erupt with an explosive force, since methane is highly compressed inside the hydrate (1 m³ of methane hydrate can release 160 m³ of gas). Such eruptions can destabilize further hydrates located nearby. Because of this explosive force, plumes of methane can rise at high speed through the water column. 

Because methane is so much lighter than water, large methane releases from the seafloor will form larger bubbles that merge and stick together, developing more thrust as they rise through the water.

Because of this thrust, methane plumes will keep rising rapidly after entering the atmosphere, and the plumes will more easily push away aerosols and gases that slow down the rise in the air of methane elsewhere, such as where methane is emitted by cows. 

A further image of another satellite is added on the right. The N2O satellite recorded methane levels as high as 2817 ppb at 487 mb on the morning of January 10, 2021. 

Such sudden and very high peaks can hardly be caused by agriculture or wetlands, but instead they are likely caused by destabilization of methane hydrates in sediments at the seafloor. 

Further contributing to the danger is the fact that little hydroxyl is present in the atmosphere over the Arctic, so it is much harder for this methane to get broken down in the air over the Arctic, compared to methane emissions elsewhere. 

Finally, the edge of the stratosphere is much lower over the Arctic, as discussed in an earlier post.

All this makes that methane that is erupting from the seafloor of the Arctic Ocean is more prone to accumulate in the stratosphere. Once methane is in the stratosphere, it's unlikely that it will come back into the troposphere.

The IPCC AR5 (2013) gave methane a lifetime of 12.4 years. The IPCC TAR (2001) gave stratospheric methane a lifetime of 120 years, adding that less than 7% of methane did reach the stratosphere at the time. According to IPCC AR5, of the methane that gets broken down by hydroxyl in the atmosphere, some 8.5% got broken down in the stratosphere.

Conclusions

The situation is dire and calls for immediate, comprehensive and effective action as described in the Climate Plan.

In the video below, Paul Beckwith discusses the situation: 


For another perspective, Guy McPherson discusses the situation in the video below, Edge of Extinction: Maybe I’m Wrong


Links

• Climate Plan
https://arctic-news.blogspot.com/p/climateplan.html

• NASA Global Land-Ocean Temperature Index
https://data.giss.nasa.gov/gistemp

• What are El Niño and La Niña?
https://oceanservice.noaa.gov/facts/ninonina.html

• Multivariate El Niño/Southern Oscillation (ENSO) Index Version 2 (MEI.v2)
https://psl.noaa.gov/enso/mei 
 
• Temperatures keep rising
https://arctic-news.blogspot.com/2020/12/temperatures-keep-rising.html

• There is no time to lose
https://arctic-news.blogspot.com/2020/11/there-is-no-time-to-lose.html

• Possible climate transitions from breakup of stratocumulus decks under greenhouse warming, by Tapio Schneider et al. (2019)
https://www.nature.com/articles/s41561-019-0310-1

• A rise of 18°C or 32.4°F by 2026?

• Greater committed warming after accounting for the pattern effect - by Chen Zhou et al. 

• Upper Ocean Temperatures Hit Record High in 2020 - by Lijing Cheng et al. 
https://link.springer.com/article/10.1007/s00376-021-0447-x

• How close are we to the temperature tipping point of the terrestrial biosphere? - by Katharyn Duffy et al.
https://advances.sciencemag.org/content/7/3/eaay1052

• Methane hydrates tipping point threatens to get crossed

• Temperatures threaten to become unbearable

• Cold freshwater lid on North Atlantic

• Aerosols

• NOAA - Trends in Atmospheric Methane
https://www.esrl.noaa.gov/gmd/ccgg/trends_ch4

•  COVID-19 lockdown causes unprecedented drop in global CO2 emissions in 2020 - Gobal Carbon Project
https://www.globalcarbonproject.org/carbonbudget/20/files/International_FutureEarth_GCB2020.pdf

• Global Average Temperatures in 2020 Reached a RECORD HIGH of 1.55 C above PreIndustrial in 1750 - by Paul Beckwith 
https://www.youtube.com/watch?v=O0lgTAEUYyA

• Edge of Extinction: Maybe I’m Wrong - by Guy McPherson
https://guymcpherson.com/2021/01/edge-of-extinction-maybe-im-wrong

• Extinction
https://arctic-news.blogspot.com/p/extinction.html