Wednesday, January 30, 2019

A Revision of Future Climate Change Trends

By Andrew Glikson

Abstract


As the Earth continues to heat, paleoclimate evidence suggests transient reversals will result in accentuating the temperature polarities, leading to increase in the intensity and frequency of extreme weather events.

Pleistocene paleoclimate records indicate interglacial temperature peaks are consistently succeeded by transient stadial freeze events, such as the Younger Dryas and the 8.5 kyr-old Laurentide ice melt, attributed to cold ice melt water flow from the polar ice sheets into the North Atlantic Ocean. The paleoclimate evidence raises questions regarding the mostly linear to curved future climate model trajectories proposed for the 21ᵗʰ century and beyond, not marked by tipping points. However, early stages of a stadial event are manifest by a weakening of the North Atlantic overturning circulation and the build-up of a large pool of cold water south and east of Greenland and along the fringes of Western Antarctica. Comparisons with climates of the early Holocene Warm Period and the Eemian interglacial when global temperatures were about +1°C higher than late Holocene levels. The probability of a future stadial event bears major implications for modern and future climate change trends, including transient cooling of continental regions fringing the Atlantic Ocean, an increase in temperature polarities between polar and tropical zones across the globe, and thereby an increase in storminess, which need to be taken into account in planning global warming adaptation efforts.

Introduction

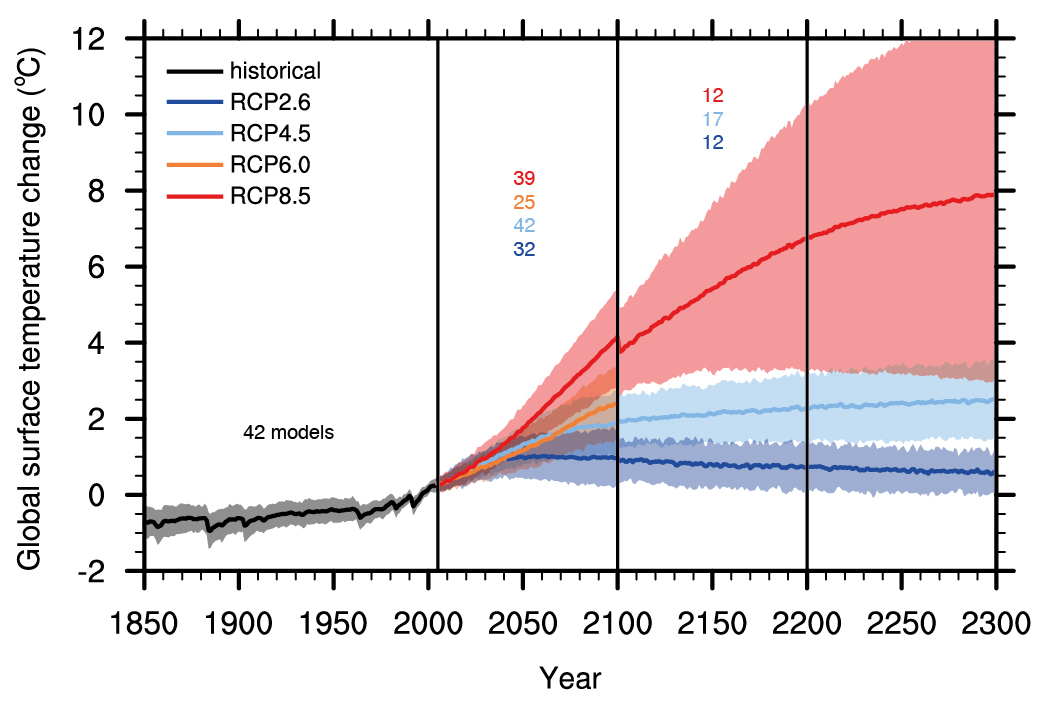
Reports of the International Panel of Climate Change (IPCC)⁽¹⁾, based on thousands of peer reviewed science papers and reports, offer a confident documentation of past and present processes in the atmosphere⁽²⁾, including future model projections (Figure 1). When it comes to estimates of future ice melt and sea level change rates, however, these models contain a number of significant departures from observations based on the paleoclimate evidence, from current observations and from likely future projections. This includes departures in terms of climate change feedbacks from land and water, ice melt rates, temperature trajectories, sea level rise rates, methane release rates, the role of fires, and observed onset of transient stadial (freeze) events⁽³⁾. Early stages of stadial event/s are manifest by the build-up of a large pool of cold water in the North Atlantic Ocean south of Greenland and along the fringes of the Antarctic continent (Figure 2).
Figure 1. IPCC AR5: Time series of global annual mean surface air temperature anomalies relative to 1986–2005
from CMIP5 (Coupled Model Inter-comparison Project) concentration-driven experiments.
Projections are shown for each RCP for the multi model mean (solid lines) and the 5–95%
range (±1.64 standard deviation) across the distribution of individual models (shading).⁽⁴⁾
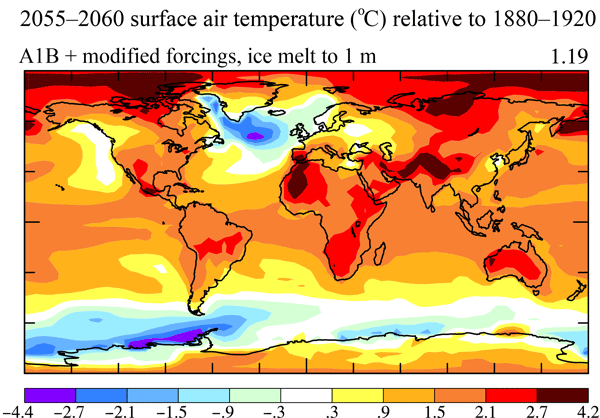
Hansen et al. (2016) (Figure 2) used paleoclimate data and modern observations to estimate the effects of ice melt water from Greenland and Antarctica, showing cold low-density meltwater tend to cap increasingly warm subsurface ocean water, affecting an increase ice shelf melting, accelerating ice sheet mass loss (Figure 3) and slowing of deep water formation (Figure 4). Ice mass loss would raise sea level by several meters in an exponential rather than linear response, with doubling time of ice loss of 10, 20 or 40 years yielding multi-meter sea level rise in about 50, 100 or 200 years.

Linear to curved temperature trends portrayed by the IPCC to the year 2300 (Figure 1) are rare in the Pleistocene paleo-climate record, which abrupt include warming and cooling variations during both glacial (Dansgaard-Oeschger cycles; Ganopolski and Rahmstorf 2001⁽⁵⁾; Camille and Born, 2019⁽⁶⁾) and interglacial (Cortese et al. 2007⁽⁷⁾) periods. Hansen et al.’s (2016) model includes sharp drops in temperature, reflecting stadial freezing events in the Atlantic Ocean and the sub-Antarctic Ocean and their surrounds, reaching -2°C over several decades (Figure 5).
Figure 2. 2055-2060 surface-air temperature to +1.19°C above 1880-1920
(AIB model modified forcing, ice melt to 1 meter) From: Hansen et al. (2016)⁽⁸⁾
Figure 3. Greenland and Antarctic ice mass change. GRACE data are extension of Velicogna et al. (2014)⁽⁹⁾
gravity data. MBM (mass budget method) data are from Rignot et al. (2011)⁽¹⁰⁾. Red curves are gravity
data for Greenland and Antarctica only; small Arctic ice caps and ice shelf melt add to freshwater input.⁽¹¹⁾
Figure 4. (a) AMOC (Sverdrup⁽¹²⁾) at 28°N in simulations (i.e., including freshwater injection of 720 Gt year−1 in 2011
                around Antarctica, increasing with a 10-year doubling time, and half that amount around Greenland).
(b) SST (°C) in the North Atlantic region (44–60°N, 10–50°W).
Temperature and sea level rise relations during the Eemian interglacial⁽¹³⁾ about 115-130 kyr ago, when temperatures were about +1°C or higher than during the late stage of the Holocene, and sea levels were +6 to +9 m higher than at present, offer an analogy for present developments. During the Eemian overall cooling of the North Atlantic Ocean and parts of the West Antarctic fringe ocean due to ice melt led to increased temperature polarities and to storminess⁽¹⁴⁾, underpinning the danger of global temperature rise to +1.5°C. Accelerating ice melt and nonlinear sea level rise would reach several meters over a timescale of 50–150 years (Hansen et al. 2016)

Figure 5. Global surface-air temperature to the year 2300 in the North Atlantic and Southern Oceans,
including stadial freeze events as a function of Greenland and Antarctic ice melt doubling time

Portents of collapse of the Atlantic Meridional Ocean Circulation (AMOC)


The development of large cold water pools south and east of Greenland (Rahmstorf et al. 2015⁽¹⁵⁾) and at the fringe of West Antarctica (Figures 1 and 5) signify early stages in the development of a stadial, consistent with the decline in the Atlantic Meridional Ocean Circulation (AMOC) (Figure 4). These projections differ markedly from linear model trends (Figure 1). IPCC models mainly assume long term ice melt⁽¹⁶⁾, stating “For the 21st century, we expect that surface mass balance changes will dominate the volume response of both ice sheets (Greenland and Antarctica). A key question is whether ice-dynamical mechanisms could operate which would enhance ice discharge sufficiently to have an appreciable additional effect on sea level rise”⁽¹⁷⁾. The IPCC conclusion is difficult to reconcile with studies by Rignot et al. (2011) reporting that in 2006 the Greenland and Antarctic ice sheets experienced a “combined mass loss of 475 ± 158 Gt/yr, equivalent to 1.3 ± 0.4 mm/yr sea level rise”⁽¹⁸⁾. For the Antarctic ice sheet the IEMB team (2017) states the sheet lost 2,720 ± 1,390 billion tonnes of ice between 1992 and 2017, which corresponds to an increase in mean sea level of 7.6 ± 3.9 millimeter⁽¹⁹⁾.

A non-linear climate warming trend, including stadial freeze events, bears significant implications for planning future adaptation efforts, including preparations for transient deep freeze events in parts of Western Europe and eastern North America, for periods lasting several decades (Figure 5) and coastal defenses against enhanced storminess arising from increased temperature contrasts between the cooled regions and warm tropical latitudes.

Imminent climate risks

Climate model projections for the 21ᵗʰ to 23ʳᵈ centuries need to take paleoclimate evidence more fully into account, including the transient stadial effects of ice melt water flow into the oceans and amplifying feedbacks of global warming from land and oceans. Radiative forcing⁽²⁰], increasing with concentration of atmospheric greenhouse gases and rising by about 0.04 Watt/m²/year over the last 50 years⁽²¹⁾, totaled by more than 2 Watt/m², equivalent to ~3.0°C (~1.5°C per W/m²)⁽²²⁾. The rise of mean global temperatures to date by 0.9°C since 1880⁽²³⁾ therefore represents lag effect, pointing to potential temperature rise by approximately two degrees Celsius. A further rise in global temperatures would be enhanced by amplifying feedbacks from land and oceans, including exposure of water surfaces following sea ice melting, reduction of CO₂ concentration in water, release of methane and fires. Climate change trajectories would be highly irregular as a result of stadial events affected by flow of ice melt water into the oceans. Whereas similar temperature fluctuations and stadial events occurred during past interglacial periods (Cortese et al. 2007⁽²⁴⁾; Figure 6), when temperature fluctuations were close to ~1°C, further rises in temperature in future would enhance the intensity and frequency of extreme weather events, entering uncharted territory unlike any recorded during the Pleistocene, rendering large parts of the continents uninhabitable.

Figure 6. (A) Evolution of sea surface temperatures in 5 glacial-interglacial transitions recorded in ODP 1089
at the sub-Antarctic Atlantic Ocean. Lower grey lines – δ¹⁸O measured on Cibicidoides plankton;
Black lines – sea surface temperature. Marine isotope stage numbers are indicated on top of diagrams.
Note the stadial temperature drop events following interglacial peak temperatures, analogous
to the Younger Dryas preceding the onset of the Holocene (Cortese et al. 2007⁽²⁵⁾).
(B) Mean temperatures for the late Pleistocene and early Holocene.

Note to readers: please click the share buttons above. Forward this article to your email lists. 
Crosspost on your blog site, internet forums. etc.

Andrew Glikson
by Andrew Glikson
Earth and Paleo-climate science, Australia National University (ANU) School of Anthropology and Archaeology,
ANU Planetary Science Institute,
ANU Climate Change Institute,
Honorary Associate Professor, Geothermal Energy Centre of Excellence, University of Queensland.

Books:
http://www.springer.com/gp/book/9783319079073
http://www.springer.com/gp/book/9789400763272
http://www.springer.com/us/book/9783319745442
http://www.springer.com/gp/book/9783319225111
http://www.springer.com/gp/book/9783319572369
http://www.springer.com/gp/book/9789400773318


Notes

(1) IPCC, Special Report, Global Warming of 1.5 ºC
https://www.ipcc.ch
https://www.ipcc.ch/sr15/

(2) Climate Council, Report, The good, the bad and the ugly: limiting temperature rise to 1.5°C
https://www.climatecouncil.org.au/resources/limiting-temperature-rise/

(3) Ice melt, sea level rise and superstorms: evidence from paleoclimate data, climate modeling, and modern observations that 2 °C global warming could be dangerous, by James Hansen et al.
https://www.atmos-chem-phys.net/16/3761/2016/

(4) IPCC Climate Change 2013: Technical Summary, p.89
http://www.climatechange2013.org/images/figures/WGI_AR5_Fig12-5.jpg
http://www.climatechange2013.org/images/report/WG1AR5_TS_FINAL.pdf

(5) Rapid changes of glacial climate simulated in a coupled climate model, by Andrey Ganopolski and Stefan Rahmstorf
https://www.nature.com/articles/35051500
https://www.ncbi.nlm.nih.gov/pubmed/11196631

(6) Coupled atmosphere-ice-ocean dynamics in Dansgaard-Oeschger events, by Camille Li and Andreas Born
https://www.sciencedirect.com/science/article/pii/S0277379118305705

(7) The last five glacial‐interglacial transitions: A high‐resolution 450,000‐year record from the subantarctic Atlantic, by G. Cortese, A. Abelmann and R. Gersonde
https://agupubs.onlinelibrary.wiley.com/doi/full/10.1029/2007PA001457

(8) Ice melt, sea level rise and superstorms: evidence from paleoclimate data, climate modeling, and modern observations that 2 °C global warming could be dangerous, by James Hansen et al. (2016)
https://www.atmos-chem-phys.net/16/3761/2016/acp-16-3761-2016-avatar-web.png
https://www.atmos-chem-phys.net/16/3761/2016/

(9) Regional acceleration in ice mass loss from Greenland and Antarctica using GRACE time‐variable gravity data, by I. Velicogna et al.
https://agupubs.onlinelibrary.wiley.com/doi/10.1002/2014GL061052

(10) Acceleration of the contribution of the Greenland and Antarctic ice sheets to sea level rise, by E. Rignot et al. (2011)
https://agupubs.onlinelibrary.wiley.com/doi/10.1029/2011GL046583

(11) Ice melt, sea level rise and superstorms: evidence from paleoclimate data, climate modeling, and modern observations that 2 °C global warming could be dangerous, by James Hansen et al.
https://www.atmos-chem-phys.net/16/3761/2016/acp-16-3761-2016.pdf

(12) Sverdrup: Unit of flow – 1 Sv is equal to 1,000,000 m³ per second
https://en.wikipedia.org/wiki/Sverdrup

(13) Eemian Interglacial Stage
https://www.britannica.com/science/Eemian-Interglacial-Stage

(14) Giant boulders and Last Interglacial storm intensity in the North Atlantic, by Alessio Rovere et al. (2017)
http://moraymo.us/wp-content/uploads/2018/03/Rovereetal_PNAS_2017.pdf
Northern hemisphere winter storm tracks of the Eemian interglacial and the last glacial inception, by F. Kaspar (2006)
https://www.clim-past.net/3/181/2007/cp-3-181-2007.pdf

(15) Exceptional twentieth-century slowdown in Atlantic Ocean overturning circulation, by Stefan Rahmstorf et al. (2015)
https://www.nature.com/articles/nclimate2554

(16) The UN's Devastating Climate Change Report Was Too Optimistic, by Nafeez Ahmed (Oct 16, 2018)
https://motherboard.vice.com/en_us/article/43e8yp/the-uns-devastating-climate-change-report-was-too-optimistic

(17) IPCC Third Assessment Report, Working Group I: The Scientific Basis
https://archive.ipcc.ch/ipccreports/tar/wg1/416.htm

(18) Acceleration of the contribution of the Greenland and Antarctic ice sheets to sea level rise, by E. Rignot et al. (2011)
https://agupubs.onlinelibrary.wiley.com/doi/full/10.1029/2011GL046583

(19) Mass balance of the Antarctic Ice Sheet from 1992 to 2017
https://www.nature.com/articles/s41586-018-0179-y.epdf

(20) Radiative forcing – the difference between incoming radiation and radiation reflected back to space
https://en.wikipedia.org/wiki/Radiative_forcing

(21) Climate Change in a Nutshell: The Gathering Storm, by James Hansen (18 December 2018)
http://www.columbia.edu/~jeh1/mailings/2018/20181206_Nutshell.pdf

(22) Target atmospheric CO2: Where should humanity aim?, by James Hansen (2008)
https://arxiv.org/abs/0804.1126

(23) NASA: Global temperature
https://climate.nasa.gov/vital-signs/global-temperature/

(24) The last five glacial‐interglacial transitions: A high‐resolution 450,000‐year record from the subantarctic Atlantic, by G. Cortese, A. Abelmann and R. Gersonde
https://agupubs.onlinelibrary.wiley.com/doi/full/10.1029/2007PA001457

(25) The last five glacial‐interglacial transitions: A high‐resolution 450,000‐year record from the subantarctic Atlantic, by G. Cortese, A. Abelmann and R. Gersonde
https://agupubs.onlinelibrary.wiley.com/doi/full/10.1029/2007PA001457

This is an edited version of an article at Global Research
Copyright © Dr. Andrew Glikson, 2019

Friday, January 25, 2019

Accelerating growth of carbon dioxide in the atmosphere

People may not have thought that growth in carbon dioxide (CO₂) levels in the atmosphere would accelerate, when pledges were made in 2015 at the Paris Agreement to take efforts to keep the temperature rise under 1.5°C compared to preindustrial.


Yet, on January 21, 2019, hourly average CO₂ levels well above 414 ppm were recorded at Mauna Loa, Hawaii, the highest levels since such measurements started. A daily average level of 413.86 ppm was recorded on January 22, 2019.


A recent Met Office forecast expects monthly averages to reach a level of 414.7 ppm in May 2019. The forecast expects annual average CO₂ levels at Mauna Loa to be 2.75 ppm higher in 2019 than in 2018. That figure is virtually on the trendline depicted below.


The trend in above image is calculated with NOAA 1959-2017 growth data, with an estimate for 2018 calculated by Sam Carana with NOAA January 2017-November 2018 data (orange dot), and with this Met Office forecast used for 2019 (purple dot).

Strong CO₂ growth is forecast for 2019, due to a number of factors including rising emissions, the added impact of El Niño and less uptake of carbon dioxide by ecosystems. A recent study warns that global warming will enhance both the amplitude and the frequency of eastern Pacific El Niño events and associated extreme weather events. Another recent study warns that, while the terrestrial biosphere now absorbs some 25% of CO₂ emissions by people, the rate of land carbon uptake is likely to fall with reduced soil moisture levels in a warmer world. Furthermore, forest fires will increase as temperatures rise, as soils get more dry and as winds increase in strength, resulting in further increases of CO₂ emissions.

The warming impact of CO₂ can be expected to increase over the next ten years, the more so since the warming impact of CO₂ reaches a peak ten years after emission. In conclusion, CO₂ can cause a global temperature rise of 0.5°C over the next ten years.

Ocean Heat

La Niña has kept much heat in oceans in 2018. Not surprisingly, 2018 was the hottest year for our oceans since global records began in 1958.

As an indication how much heat is contained in the North Atlantic, very high sea surface temperatures did show up recently off the coast of North America, with anomalies on January 23, 2019, as high as 12.6°C or 22.6°F (compared to 1981-2011, green circle on the image on the right).

That day, sea surface temperatures near Svalbard were as high as 18.3°C or 64.9° (green circle, image right). The Gulf Stream carries ocean heat to the Arctic Ocean and it can take a couple of months for this heat to reach the Arctic Ocean and contribute to melting of the sea ice.

So, Arctic sea ice is expected to be invaded by ocean heat from below in 2019, while El Niño will cause high temperatures over the Arctic, melting the sea ice from above.

Furthermore, rivers that end in North America and Siberia can be expected to carry much warm water into the Arctic Ocean.

The image below shows surface air temperature forecasts for February 1, 2019, 15:00 UTC. Low temperatures show up many place on the Northern Hemisphere, such as -44.5°C or -48.2°F in Siberia, -44°C or -47.1°F in Greenland and -40.8°C or -41.4°F near Hudson Bay.


[ NOAA Climate.gov cartoon by Emily Greenhalgh ]
These low temperatures are the result of global warming. As the Arctic warms up faster than the rest of the world, the temperature difference between the North Pole and the Equator narrows, making the jet stream wavier, thus enabling cold air from the Arctic to descend further south.

As the jet stream gets wavier, more warm air can also enter the Arctic from the south. Above image also shows that surface air temperatures near Svalbard are forecast as high as 5.2°C or 41.4°F, illustrating how warm the air can be close to the North Pole, at a time of year when virtually no sunlight reaches that area.

Furthermore, as oceans get warmer, the temperature difference between land and oceans increases in Winter. This larger temperature difference results in stronger winds that can carry more warm and moist air inland, e.g. into the U.S., as illustrated by the cartoon. Stronger winds can also carry more warm and moist air into the Arctic and can speed up the flow of sea currents, causing warm and salty water to reach the sea ice and speed up its decline.

The sea surface is warming up strongly in this area near Svalbard, as the water underneath the surface of the North Atlantic can be much warmer than the water at the surface, and warm water is coming to the surface in line with a rise in the seafloor in this area, as discussed in earlier posts such as this one and this one.

Methane hydrates

With sea ice at a low, it won't be able to act as a buffer to absorb heat for long. One danger is that, as more heat arrives in the Arctic and as the sea ice melts away, the sea ice will no longer be able to act as a buffer absorbing ocean heat any longer, and ocean heat will instead reach sediments at the seafloor of the Arctic Ocean.

[ The Buffer has gone, feedback #14 on the Feedbacks page ]
Joint impact

[ For details, see the Extinction page ]
The joint impact of all this is terrifying. Ocean heat that reaches sediments at the seafloor of the Arctic Ocean can destabilize hydrates, resulting in eruptions of huge amounts of methane. This alone can cause a global temperature rise of 1.1°C in a matter of years.

A lot of this has not been accounted for by the IPCC, i.e. the recent increases in CO₂ emissions, increases in methane releases, increases in further emissions such as nitrous oxide and black carbon, albedo changes due to decline in the snow and ice cover and associated changes such as jet stream changes, more permafrost melting and stronger impacts of future El Niño events.

The image on the right shows the joint impact of the warming elements that threaten to eventuate over the next few years and that could result in a rapid 10°C or 18°F global temperature rise by 2026 or even earlier. Keep in mind that global biodiversity will have collapsed once temperatures have risen by 5°C.

The situation is dire and calls for comprehensive and effective action, as described at the Climate Plan.


Links

• Faster CO₂ rise expected in 2019
https://www.metoffice.gov.uk/news/releases/2019/2019-carbondioxide-forecast

• Increased variability of eastern Pacific El Niño under greenhouse warming, by Wenju Cai et al.
https://www.nature.com/articles/s41586-018-0776-9

• El Niño events will intensify under global warming, by Yoo-Geun Ham
https://www.nature.com/articles/d41586-018-07638-w

• Large influence of soil moisture on long-term terrestrial carbon uptake, by Julia Green et al.
https://www.nature.com/articles/s41586-018-0848-x

• 2018 Continues Record Global Ocean Warming, by Lijing Cheng et al.
https://link.springer.com/article/10.1007/s00376-019-8276-x

• Are record snowstorms proof that global warming isn’t happening?
https://www.climate.gov/news-features/climate-qa/are-record-snowstorms-proof-global-warming-isn%E2%80%99t-happening

• Co-extinctions annihilate planetary life during extreme environmental change, by Giovanni Strona and Corey Bradshaw
https://www.nature.com/articles/s41598-018-35068-1

• Dangerous situation in Arctic
https://arctic-news.blogspot.com/2018/11/dangerous-situation-in-arctic.html

• Accelerating Warming of the Arctic Ocean
https://arctic-news.blogspot.com/2016/12/accelerating-warming-of-the-arctic-ocean.html

• Climate Plan
https://arctic-news.blogspot.com/p/climateplan.html

• Extinction
https://arctic-news.blogspot.com/p/extinction.html


Sunday, January 20, 2019

Care for the Ozone Layer


The stratosphere normally is cold and very dry. Global warming can increase water vapor in the stratosphere in a number of ways. Global warming causes the troposphere to warm and since warmer air holds more water vapor, the amount of water vapor in the troposphere is increasing. This can cause more water vapor to end up in the stratosphere as well, as described below.

Stratospheric Water Vapor over the Arctic

Around the time of the December Solstice, very little sunlight is reaching the Arctic and temperatures over land at higher latitudes can get very low. At the same time, global warming has made oceans warmer and this keeps air temperatures over water relatively warm in Winter. This can lead to a number of phenomena including sudden stratospheric warming and moistening of the stratosphere.

Sudden stratospheric warming is illustrated by the image on the right, showing temperatures in the stratosphere over Siberia as high as 12.7°C or 54.9°F on December 24, 2018, and temperatures as low as -84.8°C or -120.6°F over Greenland.

At the same time, relative humidity was as high as 100% in the stratosphere over the North Sea, as the second image on the right shows.

Moistening of the stratosphere was even more pronounced on December 24, 2016, as illustrated by the third image on the right.

Storms over the U.S.

Jennifer Francis has long pointed out that, as temperatures at the North Pole are rising faster than at the Equator, the Jet Stream is becoming wavier and can get stuck in a 'blocking pattern' for days, increasing the duration and intensity of extreme weather events.

This can result in stronger storms moving more water vapor inland over the U.S., and such storms can cause large amounts of water vapor to rise high up in the sky.

Water vapor reaching stratospheric altitudes causes loss of ozone, as James Anderson describes in a 2017 paper and discusses in the short 2016 video below.


Methane

Stratospheric water vapor can also result from methane oxidation in the stratosphere. Methane concentrations have risen strongly at higher altitudes over the years. Noctilucent clouds indicate that methane has led to water vapor in the upper atmosphere.

The danger is that, as the Arctic Ocean keeps warming, large eruptions of methane will occur from the seafloor. Ominously, high methane levels have recently shown up on satellite images over the Arctic at lower altitudes, indicating the methane is escaping from the sea.

The images below show methane levels recorded by the NPP satellite:
Jan. 6, 2019, with peak levels of 2513 ppb at 1000 mb, 2600 ppb at 840 mb and 2618 ppb at 695 mb;
Jan. 11, 2019, with peak levels of 2577 ppb at 1000 mb, 2744 ppb at 840 mb and 2912 ppb at 695 mb;
Jan. 15, 2019, with peak levels of 2524 ppb at 1000 mb, 2697 ppb at 840 mb and 2847 ppb at 695 mb.


The images below show methane levels recorded by the MetOp satellites:
Jan. 15, 2019, with peak levels of 2177 ppb at 840 mb, 2342 ppb at 695 mb and 2541 ppb at 586 mb;
Jan. 16, 2019, with peak levels of 2219 ppb at 840 mb, 2299 ppb at 695 mb and 2475 ppb at 586 mb;
Jan. 19, 2019, with peak levels of 2201 ppb at 840 mb, 2489 ppb at 695 mb and 2813 ppb at 586 mb.


The Importance of the Ozone Layer

Increases in stratospheric water vapor are bad news, as they speed up global warming and lead to loss of stratospheric ozone, as Drew Shindell pointed out back in 2001.

It has long been known that deterioration of the ozone shield increases ultraviolet-B irradiation, in turn causing skin cancer. Recent research suggest that, millions of years ago, it could also have led to loss of fertility and consequent extinction in plants and animals (see box right).

Nitrous oxide

As the left panel of the image below shows, growth in the levels of chlorofluorocarbons (CFCs) has slowed over the years, but their impact will continue for a long time, given their long atmospheric lifetime (55 years for CFC-11 and 140 years for CFC-12, CCl2F2).

Furthermore, as the right panel shows, the impact of nitrous oxide (N₂O) as an ozone depleting substance (ODS) has relatively grown, while N₂O levels also continue to increase in the atmosphere.

[ click on images to enlarge ]
Existential Threats

In conclusion, rising levels of emissions by people constitute existential threats in many ways. Rising temperatures cause heat stress and infertility, and there are domino effects. Furthermore, stratospheric ozone loss causes cancer and infertility.

Only once the ozone layer formed on Earth some 600 million years ago could multicellular life develop and survive. Further loss of stratospheric ozone could be the fastest path to extinction for humanity, making care for the ozone layer imperative.

As described in an earlier post, Earth is on the edge of runaway warming and in a moist-greenhouse scenario oceans evaporate into the stratosphere with loss of the ozone layer.

The situation is dire and calls for comprehensive and effective action, as described in the Climate Plan.


Links

• Climate and ozone response to increased stratospheric water vapor, by Drew Shindell (2001)
https://agupubs.onlinelibrary.wiley.com/doi/abs/10.1029/1999GL011197

• Stratospheric ozone over the United States in summer linked to observations of convection and temperature via chlorine and bromine catalysis, by James Anderson et al. (2017)
https://www.pnas.org/content/114/25/E4905

• Harvard Speaks on Climate Change: James Anderson (2016)
https://vimeo.com/185794598

• Climate Week: Climate Science Breakfast with James Anderson (April 9, 2015)
http://environment.harvard.edu/climate-week-climate-science-breakfast-james-anderson

• 10°C or 18°F warmer by 2021?
https://arctic-news.blogspot.com/2017/04/10c-or-18f-warmer-by-2021.html

• Noctilucent clouds indicate more methane in upper atmosphere
https://arctic-news.blogspot.com/2012/09/noctilucent-clouds-indicate-more-methane-in-upper-atmosphere.html

• Noctilucent clouds: further confirmation of large methane releases
https://methane-hydrates.blogspot.com/2013/12/noctilucent-clouds-further-confirmation-of-large-methane-releases.html

• It could be unbearably hot in many places within a few years time
https://arctic-news.blogspot.com/2016/07/it-could-be-unbearably-hot-in-many-places-within-a-few-years-time.html

• Climate change: effect on sperm could hold key to species extinction, by Kris Sales
https://theconversation.com/climate-change-effect-on-sperm-could-hold-key-to-species-extinction-107375

• Climate change: effect on sperm could hold key to species extinction
https://theconversation.com/climate-change-effect-on-sperm-could-hold-key-to-species-extinction-107375

• UV-B–induced forest sterility: Implications of ozone shield failure in Earth’s largest extinction, by Jeffrey Benca et al. (2018)
http://advances.sciencemag.org/content/4/2/e1700618

• Co-extinctions annihilate planetary life during extreme environmental change, by Giovanni Strona and Corey Bradshaw (2018)
https://www.nature.com/articles/s41598-018-35068-1

• NOAA's Annual Greenhouse Gas Index
https://www.esrl.noaa.gov/gmd/aggi

• NOAA Study Shows Nitrous Oxide Now Top Ozone-Depleting Emission
https://www.esrl.noaa.gov/news/2009/nitrous_oxide_top_ozone_depleting_gas.html

• Earth is on the edge of runaway warming
https://arctic-news.blogspot.com/2013/04/earth-is-on-the-edge-of-runaway-warming.html

• Climate Plan
https://arctic-news.blogspot.com/p/climateplan.html


Monday, January 7, 2019

GLOBAL EXTINCTION WITHIN 18 - 34 MONTHS

By Malcolm Light

Humanity is facing the final, western corporate capitalist, fossil fuel initiated, catastrophic Arctic methane hydrate destabilization and Permian style methane blowout - firestorm that will culminate in 1 to 4 years (2020 to 2023).

We will all be boiled alive like lobsters in a massively humid atmosphere and converted into stardust.

Recent data from the Arctic confirm an exponential rise in the temperature anomaly of the Arctic stratospheric methane which is now 65 degrees C above the normal, while it was only 20 degrees C above the normal, 6 to 8 years ago.

Using this data and the recent Piomas (2017) estimates of the minimum Arctic ice shelf volume it is now possible to estimate the timing of the Arctic - Permian style methane blowout firestorm more accurately and the events in the Figure 1. below and tabulated beneath it.


1. An Arctic blue oceanic event is possible in 2020 due to the fast rise in Summer temperatures (Piomas - Zhang and Rothrock, 2003, Wipneus, 2017, Carana, 2016)


2. The start of the Arctic Permian style methane blowout event can begin as early as July 15, 2020 at the end of Summer in the Northern Hemisphere if the Mean Yearly Global Warming Potential of Methane is used (119.3959 from Goddard Space Flight Centre Data, NASA 2012)


3. The Major Arctic Permian Style, Methane Blowout - Firestorm Event which will cause the release of some 50 Gt of methane from the Arctic shelf and slope (Shakhova, 2010), a 10 Degree Centigrade Rise in Mean Global Atmospheric Temperatures causing a Catastrophic Permian Style Global Extinction Event, is timed to begin on 4th September, 2021 using an Atmospheric Methane Global Warming Potential of 100. This is an end Summer event for the Northern Hemisphere.


4. There is a 95% Probability that the Arctic Ice Shelf will have Zero Volume by the 5th of September 2022 (Piomass - Zhang and Rothrock, 2003, Wipneus, 2017, Carana, 2016) which is an end Summer event and exactly one year after the Catastrophic Permian Style Global Extinction Event.

This indicates a total 12 month delay in the atmospheric heat being transferred to the tropical ocean currents (e.g the Gulf Stream) and then being conducted north to heat up the Svalbard current which then destabilizes the shelf and slope methane hydrates in the Arctic ocean releasing methane to the atmosphere.

The Goddard Space flight Centre Arctic shelf data (NASA 2012) indicate a 7 month delay in Summer ocean heating and the release of methane from the Arctic shelf and slope.

The Arctic ice shelf is being melted from below so the ocean needs to be heated first by the methane in the tropical stratosphere and this heat is then transferred by ocean current to the Arctic over at least 7 months. Ice also has a large latent heat of melting adding an additional several months to the delay time for the total Arctic ice shelf melt.


5. From the 24ᵗʰ of December 2022, Worldwide Catastrophic Weather Systems are now entirely controlled by the Arctic Atmospheric Global Warming Veil. The data is derived from the converging amplitude envelope of the 11 year moving average of the GISS maximum surface temperature anomalies from which the final mean convergence point being was determined (NASA GISS Data).


from Planetary Genocide - Ecocide between 2023 and 2031
WHAT YOU NEED TO DO

The start date of the Permian style global extinction event may be only 18 to 19 months away. This says that you must complete your bucket list of unfulfilled dreams before July to August 2020. A bucket list is a list of unfulfilled actions you need to complete before you die ("kick the bucket").

Do not worry about dying as it comes to all of us in the end, only this time we will all be going together. The Earth will soon after this lose all its oceans and become "Venus Like".

Empathy is organic evolution's key to group survival in a uncaring inorganic universe. Enjoy yourselves and be excellent to each other in these last days and hours on the only remaining habitable planet in this solar system.


CONCLUSIONS

The Earth is a giant convecting planet, the underlying molten magma being heated by deep seated radioactivity and the oceans and atmosphere are its cooling radiator which allows the Earth the facility to vent this heat into open space (Windley, 1984; Allen and Allen, 1990). Mother Earth has carefully held the atmospheric temperature within a stable range necessary for oceans to exist for at least 4 billion years and nurtured the earliest bacteria to evolve into today's space faring humans (Calder, 1983).

The fouling up of the Earth's cooling radiator from Human emissions of greenhouse gases derived from fossil fuels will be counteracted by Mother Earth in her characteristic fashion by emitting vast volumes of deadly methane into the atmosphere from the Arctic regions. This will lead to the total extermination of all harmful biological species that produce greenhouse gases in the same way that Mother Earth did during the Permian and other extinction extinction events. In this case however we have totally tipped the balance with our extreme carbon dioxide and methane emissions so that there will be no chance of recovery for the Earth in this time frame, because the methane release will cause the oceans to begin boiling off between 115°C and 120°C (Severson, 2013) in 2080 and the Earth's atmosphere will have reached temperatures equivalent to those on Venus by 2096 (460°C to 467°C)(Wales, 2013; Moon Phases, 2013).

Mankind's greed for fossil fuels will have completely destroyed a magnificent beautiful blue planet and converted its atmosphere into a barren, stiflingly hot, carbon dioxide rich haze. The earth will have moved permanently out of the magical zone (Circumstellar habitable zone, Goldilocks zone) where life (some of it probably highly intelligent) also exists elsewhere in the myriad of other solar systems that are located within the far reaches of our Universe.

The power, prestige and massive economy of the United States has been built on cheap and abundant fossil fuels and Canada is now trying to do the same. The present end of the financial crisis and recovery of the U.S. economy will take us down the same fossil fuel driven road to catastrophe that the U.S. has followed before. Unless the United States, Canada reduce their extreme carbon footprints (per unit population), they will end up being found guilty of ecocide and genocide as the number of countries destroyed by the catastrophic weather systems continues to increase.

The United States and Canada with their expanding economies and their growing frenetic extraction of fossil fuels, using the most environmentally destructive methods possible (fracking and shale oil) as well as the population's total addiction to inefficient gas transport is leading our planet into suicide. We are like maniacal lemmings leaping to their deaths over a global warming cliff. What a final and futile legacy it will be for the leader of the free world to be remembered only in the log of some passing alien ship recording the loss of the Earth’s atmosphere and hydrosphere after 2080 due to human greed and absolute energy ineptitude.

The U.S. Government and Canada must ban all environmentally destructive methods of fossil fuel extraction such as fracking, extracting shale oil and coal and widespread construction of the now found to be faulty hydrocarbon pipeline systems. All Federal Government subsidies to fossil fuel corporations, for fossil fuel discovery and extraction must be immediately eliminated and the money spent solely on renewable energy development which will provide many jobs to the unemployed. All long and short range (high consumption) fossil fuel transport must be electrified and where the range is too large, electrical trains must be used instead of trucks for transport. All the major work for this conversion and railway construction can provide a new and growing set of jobs for the unemployed. Nuclear power stations must continue to be used and should be converted to the safe thorium energy system until the transition is complete.

The U.S. has to put itself on a war footing, recall its entire military forces and set them to work on the massive change over to renewable energy that the country needs to undertake, if it wishes to survive the fast approaching catastrophe. The enemy now is Mother Nature who has infinite power at her disposal and intends to take no prisoners in this very short, absolutely brutal, 30 to 40 year war she has begun. I cannot emphasise more, how serious humanity’s predicament is and what we should try to do to prevent our certain final destruction and extinction in the next 30 to 40 years if we continue down the present path we are following .


The above message was posted by Malcolm Light on January 7, 2019, with minor updates later in January 2019, and with Conclusions added from this post.

• Warning - Global Omnicide
https://arctic-news.blogspot.com/p/warning-global-omnicide.html

• Poster created for Geophysical Congress on methane hydrates, earthquakes and global warming, Nice, France, 2002, by Malcolm Light and Carmen Solana
http://arctic-news.blogspot.com/p/seismic-activity.html

• One Step to Accept our Short Term Extinction, by Wolfgang Werminghausen
https://www.fasterthanexpected.one/one-step-to-accept-our-short-term-extinction


In the video below, recorded January 5, 2019, Guy McPherson talks with Jamen Shively and Michael about extinction.


• Co-extinctions annihilate planetary life during extreme environmental change, by Giovanni Strona and Corey Bradshaw (2018)
https://www.nature.com/articles/s41598-018-35068-1

• As El Niño sets in, will global biodiversity collapse in 2019?
https://arctic-news.blogspot.com/2018/11/as-el-nino-sets-in-will-global-biodiversity-collapse-in-2019.html


Aaron Franklin comments:

Malcolm may be being too conservative. The Arctic has spat out the freshwater lid that allows sea ice to exist, and this may all kick off in September this year.

Biggest near term danger is to coastal communities, should the Greenland and/or Antarctic Ice sheets cascade collapse. They are poised to do this and it could produce worldwide megatsunami and 30m sea level rise in months of fast paced action. Good news is that flooding the north Atlantic and Arctic with huge icebergs of ice sheet origin should plug the methane dyke and stop the oceans being boiled. If we have enough tech capacity as after the cataclysm we can easily steer away from that cliff in the century or two grace a dryas event will afford us.

Get inland, and on high ground now! Unless you'd rather drown.


Saturday, January 5, 2019

The Gathering Climate Storm and the Media Cover-up | By Dr. Andrew Glikson

“Earth is now substantially out of energy balance. The amount of solar energy that Earth absorbs exceeds the energy radiated back to space. The principal manifestations of this energy imbalance are continued global warming on decadal time scales and continued increase in ocean heat content.” (James Hansen 2018)

“The people have no voice since they have no information” …“No First World country has ever managed to eliminate so entirely from its media all objectivity – much less dissent.” (Gore Vidal)

With the exception of the few who comprehend the nature of a Faustian Bargain[1], some billionaires, captains of industry and their political and media mouthpieces are driving humanity toward self-destruction through the two biggest enterprises on Earth, the fossil fuel industry, which is devastating the Earth atmosphere, and the industrial-military machine leading toward nuclear war. The rest of the world is dragged subconsciously, induced by bread and circuses.

[ 1880 - Feb. 2016 temperature anomaly from 1951-1980, source ]
By close analogy with the tobacco denial syndrome[2], albeit with consequences affecting the entire Earth, the fossil fuel industry has been paying climate pseudoscientists to propagate fabricated untruths regarding the origins and consequences of global warming, widely disseminated by the media.

Despite irrefutable evidence for global warming, such fabrications are still quoted by pro-coal lobbies and compliant politicians, including:
  1. Denial of basic laws of physics, i.e. the blackbody radiation laws of Plank, Stefan-Boltzmann and Kirchhoff[3]
  2. Denial of direct observations and measurements in nature, in particular the sharp rises of temperatures, ice melt rates, sea level rise and extreme weather events.
  3. Denial of the global warming origin of extreme weather events, i.e. the closely monitored rise in storms, hurricanes, fires and droughts in several parts of the world.[4]
  4. Denial of the bulk of the peer-reviewed literature summed up in the IPCC reports.
  5. Denial of conclusions of the world’s premier climate research organizations (NASA, NOAA, NSIDC (National Snow and Ice Data Centre), Hadley-Met, Tindale, Potsdam, WMO (World Meteorological Organization), CSIRO, BOM and other organizations).
In view of the rapidly growing direct evidence from the increase in extreme weather events, the common tactic has changed from outright denial to a minimization of the significance and consequences of the shift in state of the climate.

READ MORE: Crimes Against the Earth

Whereas news items channeled by international news agencies regarding extreme weather events are generally reported, at least by national broadcasters, the plethora of discussion and debate programs on TV and radio stations mostly overlook the enhanced toxic effects of carbon gases[5], or relegate it behind sports and entertainment news. In most instances discussion panels focus on the inside political machinations rather than the critical issues themselves.

According to Mary Debrett[6]:
“We are now in the middle of perfect storm of miscommunication about climate change. Various factors have converged to confound rational public conversation. Public opinion polling indicates that although there is widespread acceptance of climate change resulting from human activities, the public’s preparedness to pay for action to mitigate climate change is actually declining – even as climate scientists warn of the increasing urgency for action. These results signal a serious problem in the public communication of climate change. They reflect this perfect storm – where tensions between the media, politicians and various lobby groups have made it impossible for scientists and others with appropriate expertise, to cut through.”
The major influence the media exerts on public opinion[7], and the extent to which it can be referred to as the “tail which wags the political dog”, allows it nearly as much, or more, political power as political leaders, chief bureaucrats and heads of corporation. A power accompanied with little responsibility.

*

Note to readers: please click the share buttons above. Forward this article to your email lists. Crosspost on your blog site, internet forums. etc.

Notes

[1] To “strike a Faustian bargain” is to be willing to sacrifice anything to satisfy a limitless desire for knowledge or power. https://en.wiktionary.org/wiki/Faustian_bargain

[2] https://tobaccocontrol.bmj.com/content/12/suppl_3/iii23

[3] https://rmets.onlinelibrary.wiley.com/doi/pdf/10.1002/wea.2072; https://en.wikipedia.org/wiki/Black-body_radiation

[4] https://www.nasa.gov/centers/langley/science/climate_assessment_2012.html; https://climate.nasa.gov/vital-signs/global-temperature/

[5] https://johnmenadue.com/andrew-glikson-the-abc-2018-year-roundup-and-the-defining-issue-of-our-time/

[6] https://www.latrobe.edu.au/big-fat-ideas/bold-thinking-social-conscience/the-media-on-climate-change-a-perfect-storm-of-miscommunication

[7] https://www.abc.net.au/radionational/programs/bigideas/the-role-of-media-in-public-opinion/8213158

The original source of this article is Global Research.

Andrew Glikson
by Dr Andrew Glikson
Earth and Paleo-climate science, Australian National University (ANU)