Thursday, February 28, 2019

A rise of 18°C or 32.4°F by 2026?

A catastrophe of unimaginable proportions is unfolding. Life is disappearing from Earth and all life could be gone within one decade. Study after study is showing the size of the threat, yet many people seem out to hide what we're facing.

In the Arctic alone, four tipping points look set to be crossed within a few years:
  1. Loss of the Arctic sea ice's ability to act as a buffer to absorb incoming ocean heat
  2. Loss of Arctic sea ice's ability to reflect sunlight back into space (albedo)
  3. Destabilization of sediments at the seafloor of the Arctic Ocean
  4. Permafrost melt (melting of snow and ice to such an extent that soils thaw and don't stay permanently frozen anymore)
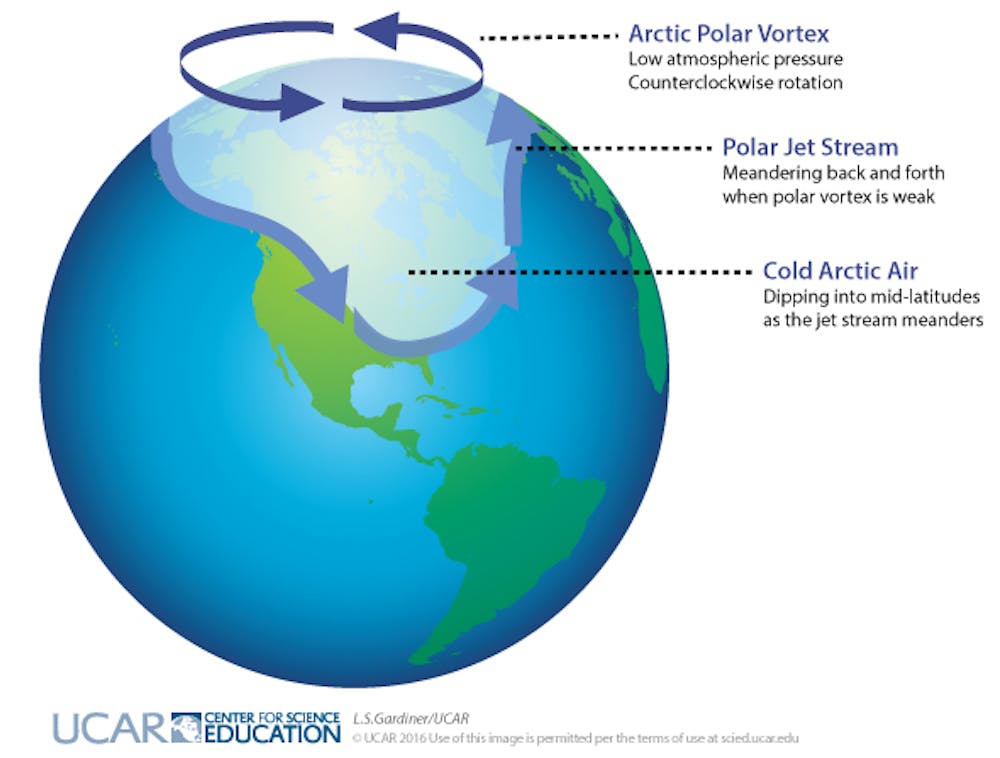
Crossing these tipping points triggers a number of feedbacks that kick in at accelerating speed, including even more absorption of heat by the Arctic Ocean, further changes to the Jet Stream resulting in even more extreme weather, seafloor methane release, water vapor feedback and emissions from land such as CH₄ (methane), N₂O (nitrous oxide) and NO (nitrogen oxide), due to permafrost melt, storms and forest fires. Temperatures also threaten to rise strongly over the next few years as sulfate cooling falls away while more black carbon and brown carbon gets emitted as more wood gets burned and more forest fires occur.

A recent study points at yet another tipping point, i.e. the disappearance of marine stratus clouds, which could result in a global temperature rise of eight degrees Celsius (8°C or 14.4°F). In the model used in the study, the tipping point starts to occur at 1,200 ppm CO₂e, i.e. a stack of greenhouse gases including CH₄, N₂O, CO₂ and H₂O, and changes in clouds resulted in global surface warming of 8°C at 1,300 ppm CO₂e, as stratocumulus decks did break up into cumulus clouds and evaporation strengthened, and average longwave cooling at the level of the cloud tops dropped to less than 10% of what it was in the presence of stratocumulus decks.

This 8°C rise would come on top of the warming that would already have occurred due to other warming elements, resulting in a total rise of as 18°C or 32.4°F from preindustrial, as pictured on the right and below.


What would it take to reach 1200 ppm CO₂e? The IPCC's AR4 contains a scenario of 1,200 ppm CO₂e getting reached with a corresponding temperature rise of between ~5°C and ~10°C above preindustrial. NOAA's figures for greenhouse gases add up to a current level of 500 ppm CO₂e. NOAA's figure for methane's GWP is too low, especially when considering a rise within a decade. When using this 500 ppm CO₂e, it would take 700 ppm to reach 1,200 ppm, and if 1 ppm equals 7.81 Gt of CO₂, then 700 ppm equals 5467 Gt of CO₂, which may seem a lot, but at a GWP for methane of 130 (10-year horizon) it could be reached instantly with a burst of methane of some 42 Gt, i.e. less than Natalia Shakhova's warning that 50 Gt of methane is ready for release at any time. In above image, further warming elements are included, in addition to methane and CO₂ and it takes until the year 2026.

As an earlier study points out, life on Earth will already have disappeared with a 5°C rise (see box on the right).

How precious life is

It took a long time for life to evolve on Earth. At first, hardly any species could live on land, as there was no ozone layer to protect them from UV radiation. Also, there was no oxygen in the air to breathe. Life formed some 3 billion years ago and bacteria first developed the ability to decompose carbon dioxide (and produce oxygen) some 2.3  billion years ago.

Then, worm-like creatures started to multiply strongly, using more and more oxygen and producing more and more carbon dioxide. Eventually, this resulted in a sharp fall in oxygen levels, leading to extinction of these species. This first mass extinction was followed by a spike in oxygen as both the species in the oceans and plants on land continued to produce oxygen, while these first animals went extinct.

Temperature changes dominate in subsequent mass extinctions, and each time it took life a long time to recover. We've now entered the Sixth Mass Extinction, as oxygen levels are falling, oceans are acidifying and species are going extinct at accelerating rates. A 2013 study calculated that species are facing warming that occurs 10,000 x faster than their natural ability to adapt.

A rise of 18°C or 32.4°F by 2026?

The speed at which temperatures and greenhouse gas levels are now jointly rising is so large and so unprecedented in Earth's history that many doubt that there will be any life left on Earth by 2026.


The situation is dire and calls for comprehensive and effective action, as described in the Climate Plan.

Can humanity change its course? 

Given that humanity appears to be on a course to omnicidal destruction, what position can we best take in response? In the light of the dire situation, dramatic reduction in pollution is needed, as well as further action. Indeed, the Paris Agreement constitutes a global commitment to comprehensive and effective action. The Climate Plan calls for multiple parallel lines of action (the green lines on the image below).

The green lines of action each need to be implemented in parallel, i.e. no line of action should wait for another, nor should action on one line be used as an excuse to delay action on another line. Where lines of action are grouped together in three parts, numbers merely show relationships with the kinds of warming pictured at the top of the image.
While implementation of some of these lines of action requires U.N. supervision, the Climate Plan prefers local implementation, with communities deciding what works best locally, provided a community does take sufficient action to achieve the necessary dramatic reductions in each type of pollution. Examples of implementation of some of these lines of action are depicted in the image below, showing examples of how progress can be achieved through local feebates.


Where progress is lacking, swift escalation is recommended as follows:

1. Where a local community fails to make progress, state (or provincial) fees are imposed in that locality.
2. Where a state fails to make progress, national fees are imposed in the state.
3. Where a nation fails to make progress, other nations impose fees on imports from and export to that nation with revenues used to fund clean development in the other nations.

Warm air and water moving toward the Arctic Ocean

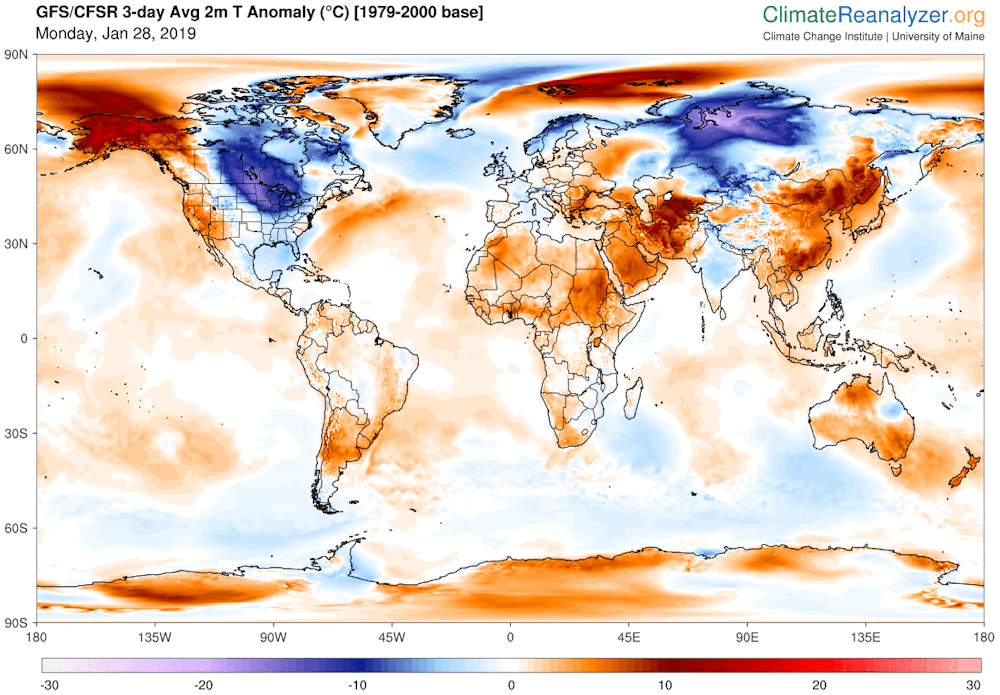
The need for action such as marine cloud brightening is illustrated by the following two images. The image below shows that, despite the presence of large amounts of meltwater off the North American coast, sea surface temperatures on March 2, 2019, were as much as 13.8°C or 24.8°F warmer than during 1981-2011, indicating how much more ocean heat is now carried to the Arctic Ocean along the Gulf Stream.


How is it possible for anomalies to get this high? As the Arctic is warming up faster than the rest of the world, the Jet Stream is becoming more wavy. A more wavy Jet Stream enables more cold air to move out of the Arctic. As a result, cold Arctic air can descend deep into the North American continent. At the same time, a more wavy Jet Stream enables more warm air and water to move into the Arctic. This is illustrated by the February 24, 2019, combination image that shows temperature on the left and the Jet Stream on the right.


As oceans get warmer, the temperature difference between land and oceans also increases in Winter. This larger temperature difference results in stronger winds that can carry more warm, moist air north in the North Atlantic. These winds can also speed up the amount of heat carried by the Gulf Stream toward the Arctic Ocean, with the threat that a large influx of warm, salty water will destabilize sediments at the seafloor of the Arctic Ocean and trigger eruption of huge amounts of methane.

In conclusion, the situation is dire and calls for comprehensive and effective action, as described at the action, policies and feebates pages at the Climate Plan.


Links

• Possible climate transitions from breakup of stratocumulus decks under greenhouse warming, by Tapio Schneider et al.
https://www.nature.com/articles/s41561-019-0310-1

• High CO2 Levels Can Destabilize Marine Layer Clouds (News release associated with above study)
https://www.caltech.edu/about/news/high-cosub2sub-levels-can-destabilize-marine-layer-clouds

• Early Palaeozoic ocean anoxia and global warming driven by the evolution of shallow burrowing, by Sebastiaan van de Velde et al.
https://www.nature.com/articles/s41467-018-04973-4

• Brock University-led team discovers way of tapping into and testing Earth’s prehistoric air
https://brocku.ca/brock-news/2016/07/brock-university-led-team-discovers-way-of-tapping-into-and-testing-earths-prehistoric-air

• Rates of projected climate change dramatically exceed past rates of climatic niche evolution among vertebrate species, by Ignacio Quintero et al.
https://onlinelibrary.wiley.com/doi/abs/10.1111/ele.12144
https://www.researchgate.net/publication/242016225_Rates_of_projected_climate_change_dramatically_exceed_past_rates_of_climatic_niche_evolution_among_vertebrate_species

• Extinction Alert
https://arctic-news.blogspot.com/2019/02/extinction-alert.html

• Co-extinctions annihilate planetary life during extreme environmental change, by Giovanni Strona and Corey Bradshaw (2018)
https://www.nature.com/articles/s41598-018-35068-1

• Climate Plan
https://arctic-news.blogspot.com/p/climateplan.html

• Extinction
https://arctic-news.blogspot.com/p/extinction.html


Sunday, February 17, 2019

Global New Deal


What are your ideas for a Global New Deal? Discuss the points below!

• 100% clean, renewable energy ASAP
• support vegan-organic food
• support reforestation/afforestation
• support clean building material
• support solid state cooling
• ban single-use plastic
• turn biowaste into biochar
• enhance mineral weathering
• brighten marine clouds
• more (discuss it, see below!)

Thursday, February 14, 2019

Dictator knocking at the door

Dictator knocking at the door
For more than a decade, I've been calling for polluting emissions to be cut by 80% by 2020. Yes, I know, it's almost 2020 now and growth in greenhouse gas levels is accelerating. We're running out of time to make the necessary changes.

There's a dictator knocking at the door. The dictator is saying that he will stop emissions. He plans to do so by taking entire cities by storm. He is not going to ask you for permission first, he is not out to negotiate and he does not plan to take any prisoners.

The Dictator is called Climate Change

That dictator is not a person, but he does have a name. That dictator is called Climate Change and he is real.

For some time, he has been knocking at your door louder and louder. He plans to come in now. He has already entered your life and he is out to destroy the world as you know it.

He plans to keep the lights switched off and stop the pumps working that now make water come out of your taps. He plans to ruin the roads used by delivery trucks that now keep the shelves in the shops stocked.

Action is needed urgently. If you keep waiting until the year 2020, before starting to reduce your emissions, the dictator will do it for you. He will stop some emissions, but the pollution will not stop and the temperature will not come down.

Temperature rise

Why will temperatures not come down? Some emissions contain sulfates that have until now hidden the full wrath of global warming. As these sulfates fall out of the air, there will be severe additional warming.

By how much could temperatures rise? How fast? Temperatures could rise by as much as 10°C or 15°F in a matter of years, due to a combination of warming elements as depicted in the image on the right.

Pollution

Pollution will not stop either. As fires, storms and flooding keep destroying entire cities, more pollution will occur and more toxic materials will be left behind. As society comes to a stop, nobody will come to clean things up. Nuclear power plants may melt down without anyone even showing up to make an effort to cool the spent fuel rods.

Extinction

The dictator plans to close everything down and, without action, there will be even more pollution and even higher temperatures, with even more firestorms raging through forests and with heatwaves, cold-snaps and storms getting stronger and more extreme. People will have no food, water or medicine, while diseases go rampant and gangs and warlords loot and devastate the few liveable areas left.

We cannot afford to wait any longer with taking action. The dictator is knocking at the door right now and he's got one foot in the door already.

The video below, Countdown to Extinction, is a visualization of near-term human extinction by Ken Avidor.


The situation is dire and only comprehensive, effective and radical action right now can make a difference.


Sunday, February 10, 2019

CO₂ levels reach another record high

CO₂ levels just reached another record high. On February 9, 2019, an average daily CO₂ level of 414.27 ppm was recorded at Mauna Loa, Hawaii.

The image below shows hourly (red circles) and daily (yellow circles) averaged CO₂ values from Mauna Loa, Hawaii, for the last 31 days.


As the image shows, average hourly levels well above 414 ppm were recorded on January 21, 2019, but no daily average was recorded for that day. February 9, 2019, was the first time an average daily CO₂ level above 414 ppm was formally recorded and such levels have not been reached earlier over the past 800,000 years, as illustrated by the image below.

CO₂ levels can be expected to keep rising further this year to reach a maximum level in April/May 2019.

How much can CO₂ levels be expected to grow over the next decade? 

A recent Met Office forecast expects annual average CO₂ levels at Mauna Loa to be 2.75 ppm higher in 2019 than in 2018. The image below shows NOAA 1959-2018 CO₂ growth data (black) and uses this Met Office forecast used for 2019 (brown). The growth figures for 2018 and 2019 are spot on a trend that is added in line with an earlier analysis.


Strong CO₂ growth is forecast for 2019, due to a number of factors including rising emissions, the added impact of El Niño and less uptake of carbon dioxide by ecosystems. A recent study warns that global warming will enhance both the amplitude and the frequency of eastern Pacific El Niño events and associated extreme weather events. Another recent study warns that, while the terrestrial biosphere now absorbs some 25% of CO₂ emissions by people, the rate of land carbon uptake is likely to fall with reduced soil moisture levels in a warmer world. Furthermore, fire hazards can be expected to grow due to stronger winds and higher temperatures, each of which constitutes a factor on their own, while they jointly also increase two further factors, i.e. drying out of soils, groundwater and vegetation, and the occurrence of more lightning to ignite fires and to also cause more ground-level ozone that further deteriorates vegetation health. 

The warming impact of CO₂ can therefore be expected to increase over the next decade, given also that the warming impact of CO₂ reaches a peak ten years after emission. The earlier analysis furthermore warns about strong growth in CO₂ emissions due to fires in forests and peatlands, concluding that CO₂ emissions could cause an additional global temperature rise of 0.5°C over the next ten years.

Rise in methane is accelerating

Methane levels are also rising and this rise is accelerating, as illustrated by the image below.


The graph shows July 1983 through October 2018 monthly global methane means at sea level, with added trend. Note that higher methane means can occur at higher altitude than at sea level. On Sep 3, 2018, methane means as high as 1905 ppb were recorded at 307 mb, an altitude at which some of the strongest growth in methane has occurred, as discussed in earlier posts such as this one.

What does the historic record tell us? 

A 10°C higher temperature is in line with such high greenhouse gas levels, as illustrated by the graph below, based on 420,000 years of ice core data from Vostok, Antarctica, from an earlier post.


Tipping points

The threat is that a number of tipping points are going to be crossed, including the buffer of latent heat, loss of albedo as Arctic sea ice disappears, methane releases from the seafloor and rapid melting of permafrost on land and associated decomposition of soils, resulting in additional greenhouse gases (CO₂, CH₄, N₂O and water vapor) entering the Arctic atmosphere, in a vicious self-reinforcing cycle of runaway warming.

A 10°C rise in temperature by 2026?


Above image shows how a 10°C or 18°F temperature rise from preindustrial could eventuate by 2026 (from earlier post).

The situation is dire and calls for comprehensive and effective action, as described at the Climate Plan.


Links

• NOAA Mauna Loa CO2 annual mean growth rates 1959-2018
ftp://aftp.cmdl.noaa.gov/products/trends/co2/co2_gr_mlo.txt

• NOAA  monthly global methane means at sea level
ftp://aftp.cmdl.noaa.gov/products/trends/ch4/ch4_mm_gl.txt

• Faster CO₂ rise expected in 2019
https://www.metoffice.gov.uk/news/releases/2019/2019-carbondioxide-forecast

• Increased variability of eastern Pacific El Niño under greenhouse warming, by Wenju Cai et al.
https://www.nature.com/articles/s41586-018-0776-9

• El Niño events will intensify under global warming, by Yoo-Geun Ham
https://www.nature.com/articles/d41586-018-07638-w

• Large influence of soil moisture on long-term terrestrial carbon uptake, by Julia Green et al.
https://www.nature.com/articles/s41586-018-0848-x

• 2018 Continues Record Global Ocean Warming, by Lijing Cheng et al.
https://link.springer.com/article/10.1007/s00376-019-8276-x

• Blue Ocean Event
https://arctic-news.blogspot.com/2018/09/blue-ocean-event.html

• What Does Runaway Warming Look Like?
https://arctic-news.blogspot.com/2018/10/what-does-runaway-warming-look-like.html

• Extinction
https://arctic-news.blogspot.com/p/extinction.html

• Climate Plan
https://arctic-news.blogspot.com/p/climateplan.html


Thursday, February 7, 2019

Extinction Alert


Above image confirms an earlier analysis that it was 1.73°C (or 3.11°F) warmer than preindustrial in 2018. The image also shows that it could become 1.85°C (or 3.33°F) warmer in 2019.

This according to the non-linear trend (red line) that follows from the data and also follows the data better than the blue linear trend, which also follows from the data, but is out of line with the recent temperature rise.


Data are adjusted for a number of reasons. The first reason is a baseline issue. At the Paris Agreement, nations pledged to ensure that the temperature rise would not cross 1.5°C above preindustrial. Accordingly, data should reflect a 1750 baseline. The default baseline for the NASA Land+Ocean Temperature index (L-OTI) is 1951-1980. The above image features two maps, one showing the 2018 temperature rise compared to 1951-1980 (left) and another map showing the 2018 temperature rise compared to 1885-1915 (right). The difference is 0.25°C. In other words, using 1900 as a baseline would require a 0.25°C adjustment.


That figure of 0.25°C is conservative, firstly because 2018 was a La Niña year. Furthermore, as above image illustrates, the period from 1900 to 1920 was almost 0.3°C below 1951-1980. Anyway, this conservative figure of 0.25°C is used in this analysis. Additional adjustment of the data is needed, in order to reflect a 1750 baseline. The total baseline adjustment could add up to as much as 0.55°C, as discussed in an earlier post.

Furthermore, the large grey area in the Arctic on above map on the right reflects a lack of measurements in the Arctic that go back to 1900. Simply excluding those data would downplay the temperature rise, since temperatures have been rising faster in the Arctic than in the rest of the world. An additional adjustment of 0.1°C therefore seems appropriate.

Finally, NASA L-OTI data are for air temperatures over land and for sea surface water temperatures for oceans. To get an idea how much the temperature of the atmosphere has risen close to the surface, it makes more sense to use air surface temperature over oceans, rather than sea surface water temperatures, resulting in another additional adjustment of 0.1°C.

The total adjustment adds up to 0.75°C, resulting in the graph below.


The final step in this analysis is a projection into the future. In the image at the top, the trend is extended to the year 2033, but the vertical axis doesn't go beyond 5°C warming. Why 5°C? A recent study looked at plant temperature tolerances and concluded that extinction will already occur far earlier than when upper tolerance levels were reached for individual species, since "loss of one species can make more species disappear (a process known as ‘co-extinction’), and possibly bring entire systems to an unexpected, sudden regime shift, or even total collapse. There was a small group of species with large tolerance limits and remarkable resistance to environmental change, but even they could not survive co-extinctions. In fact, their extinction was abrupt and happened far from their tolerance limits and close to global biodiversity collapse at around 5°C of heating."

Importantly, the image at the top doesn't even depict the worst-case scenario, in the sense that the non-linear trend merely follows from the data, i.e. it doesn't take into account tipping points such as abrupt disappearance of the Arctic sea ice or sudden eruptions of methane from the seafloor of the Arctic Ocean.

A rapid 5°C rise could occur if an influx of warm salty water triggered methane eruptions from the seafloor of the Arctic Ocean. Combined with snow and ice loss, it could rapidly raise temperatures by 1.5°C, which increases water vapor. If cloud feedback is strongly positive, water vapor feedback can lead to 3.5 times as much warming, so these warming elements alone could cause 5°C warming within years. And then, of course, there are further warming elements.


The situation is dire and calls for comprehensive and effective action, as described in the Climate Plan.


Links

• Co-extinctions annihilate planetary life during extreme environmental change, by Giovanni Strona and Corey Bradshaw (2018)
https://www.nature.com/articles/s41598-018-35068-1

• National Aeronautics and Space Administration (NASA), Goddard Institute for Space Studies (GISS), Surface Temperature Analysis, Land+Ocean Temperature index (L-OTI)
https://data.giss.nasa.gov/gistemp

• As El Niño sets in, will global biodiversity collapse in 2019?https://arctic-news.blogspot.com/2018/11/as-el-nino-sets-in-will-global-biodiversity-collapse-in-2019.html

• How much warmer is it now?
https://arctic-news.blogspot.com/2018/04/how-much-warmer-is-it-now.html

• How much warming have humans caused?
https://arctic-news.blogspot.com/2016/05/how-much-warming-have-humans-caused.html

• IPCC seeks to downplay global warming
https://arctic-news.blogspot.com/2018/02/ipcc-seeks-to-downplay-global-warming.html

• Climate Plan
https://arctic-news.blogspot.com/p/climateplan.html

• Extinction
https://arctic-news.blogspot.com/p/extinction.html


Saturday, February 2, 2019

Global Warming is destroying our Liveable Climate

Global Warming is destroying our Liveable Climate. To illustrate what's going on, have a look at the images below, showing low temperatures in Africa at 32°N latitude and high temperatures near Svalbard at about 78°N latitude.

2018 image
2019 image

Surface air temperatures near Svalbard were as high as 5.2°C or 41.4°F near Svalbard on February 3, 2019. At the same time, it was as cold as -3.5°C or 25.6°F in Africa.

The contrast was even more profound on February 4, 2018, when at those same spots it was as cold as -10°C or 13.9°F in Africa, while at the same time it was as warm as 5.8 or 42.4°F near Svalbard.

How is this possible?

As the Arctic warms up faster than the rest of the world, the temperature difference between the North Pole and the Equator narrows, making the jet stream wavier, thus enabling cold air from the Arctic to descend further south, as illustrated by the image on the right, showing instantaneous wind power density at 250 hPa (jet stream) on February 4, 2018.
[ NOAA Climate.gov cartoon by Emily Greenhalgh ]

Furthermore, as oceans get warmer, the temperature difference between land and oceans increases in Winter. This larger temperature difference results in stronger winds that can carry more warm, moist air inland, e.g. into the U.S., as illustrated by the cartoon on the right.

As the jet stream becomes wavier, this also enables more heat to enter the Arctic.

On December 8, 2018, the sea surface temperature near Svalbard was 18.2°C or 32.7°F warmer than 1981-2011. On January 23, 2019, sea surface temperatures at that spot were as high as 18.3°C or 64.9°F, as illustrated by the image on the right, from an earlier post.

A warmer sea surface can cause winds to grow dramatically stronger, and they can push warm, moist air into the Arctic, while they can also speed up sea currents that carry warm, salty water into the Arctic Ocean.

As warmer water keeps flowing into the Arctic Ocean and as air temperatures in the Arctic are now starting to rise on the back of a strengthening El Niño, fears for a Blue Ocean Event are rising.

Rivers can also carry huge amounts of warm water from North America and Siberia into the Arctic Ocean, as these areas are getting hit by ever stronger heatwaves that are hitting the Arctic earlier in the year.

With Arctic sea ice at a low, it won't be able to act as a buffer to absorb heat for long, with the danger that an influx of warm, salty water will reach the seafloor and trigger methane eruptions.

Ominously, the image below shows peak methane levels as high as 2764 ppb on February 2, 2019.


The situation is dire and calls for comprehensive and effective action, as described in the Climate Plan.

See also Dave Borlace's video below:


Links

• How frigid polar vortex blasts are connected to global warming, by Jennifer Francis
https://arctic-news.blogspot.com/2019/02/how-frigid-polar-vortex-blasts-are-connected-to-global-warming.html

• Are record snowstorms proof that global warming isn’t happening?
https://www.climate.gov/news-features/climate-qa/are-record-snowstorms-proof-global-warming-isn%E2%80%99t-happening

• Accelerating growth of carbon dioxide in the atmosphere
https://arctic-news.blogspot.com/2019/01/accelerating-growth-of-carbon-dioxide-in-the-atmosphere.html

• Dangerous situation in Arctic
https://arctic-news.blogspot.com/2018/11/dangerous-situation-in-arctic.html

• Blue Ocean Event
https://arctic-news.blogspot.com/2018/09/blue-ocean-event.html

• Climate Plan
https://arctic-news.blogspot.com/p/climateplan.html

• Extinction
https://arctic-news.blogspot.com/p/extinction.html


Friday, February 1, 2019

How frigid polar vortex blasts are connected to global warming

by Jennifer Francis, Rutgers University

File 20190128 39344 1rjndrb.jpg?ixlib=rb 1.1
Bundled up against the cold in downtown Chicago, Sunday, Jan. 27, 2019.
AP Photo/Nam Y. Huh

A record-breaking cold wave is sending literal shivers down the spines of millions of Americans. Temperatures across the upper Midwest are forecast to fall an astonishing 50 degrees Fahrenheit (28 degrees Celsius) below normal this week – as low as 35 degrees below zero. Pile a gusty wind on top, and the air will feel like -60 F.


Predicted near-surface air temperatures (F) for Wednesday morning, Jan. 30, 2019. Forecast by NOAA’s Global Forecast System model. Pivotal Weather, CC BY-ND
This cold is nothing to sneeze at. The National Weather Service is warning of brutal, life-threatening conditions. Frostbite will strike fast on any exposed skin. At the same time, the North Pole is facing a heat wave with temperatures approaching the freezing point – about 25 degrees Fahrenheit (14 C) above normal.


Predicted near-surface air temperature differences (C) from normal, relative to 1981-2010.
Pivotal Weather, CC BY-ND
What is causing this topsy-turvy pattern? You guessed it: the polar vortex.

In the past several years, thanks to previous cold waves, the polar vortex has become entrenched in our everyday vocabulary and served as a butt of jokes for late-night TV hosts and politicians. But what is it really? Is it escaping from its usual Arctic haunts more often? And a question that looms large in my work: How does global warming fit into the story?


Jimmy Fallon examines the pros and cons of the polar vortex.

Rivers of air

Actually, there are two polar vortices in the Northern Hemisphere, stacked on top of each other. The lower one is usually and more accurately called the jet stream. It’s a meandering river of strong westerly winds around the Northern Hemisphere, about seven miles above Earth’s surface, near the height where jets fly.

The jet stream exists all year, and is responsible for creating and steering the high- and low-pressure systems that bring us our day-to-day weather: storms and blue skies, warm and cold spells. Way above the jet stream, around 30 miles above the Earth, is the stratospheric polar vortex. This river of wind also rings the North Pole, but only forms during winter, and is usually fairly circular.


Dark arrows indicate rotation of the polar vortex in the Arctic; light arrows indicate the location of the polar jet stream when meanders form and cold, Arctic air dips down to mid-latitudes. L.S. Gardiner/UCAR, CC BY-ND
Both of these wind features exist because of the large temperature difference between the cold Arctic and warmer areas farther south, known as the mid-latitudes. Uneven heating creates pressure differences, and air flows from high-pressure to low-pressure areas, creating winds. The spinning Earth then turns winds to the right in the northern hemisphere, creating these belts of westerlies.

Why cold air plunges south

Greenhouse gas emissions from human activities have warmed the globe by about 1.8 degrees Fahrenheit (1 C) over the past 50 years. However, the Arctic has warmed more than twice as much. Amplified Arctic warming is due mainly to dramatic melting of ice and snow in recent decades, which exposes darker ocean and land surfaces that absorb a lot more of the sun’s heat.

Because of rapid Arctic warming, the north/south temperature difference has diminished. This reduces pressure differences between the Arctic and mid-latitudes, weakening jet stream winds. And just as slow-moving rivers typically take a winding route, a slower-flowing jet stream tends to meander.

Large north/south undulations in the jet stream generate wave energy in the atmosphere. If they are wavy and persistent enough, the energy can travel upward and disrupt the stratospheric polar vortex. Sometimes this upper vortex becomes so distorted that it splits into two or more swirling eddies.

These “daughter” vortices tend to wander southward, bringing their very cold air with them and leaving behind a warmer-than-normal Arctic. One of these eddies will sit over North America this week, delivering bone-chilling temperatures to much of the nation.

Deep freezes in a warming world

Splits in the stratospheric polar vortex do happen naturally, but should we expect to see them more often thanks to climate change and rapid Arctic warming? It is possible that these cold intrusions could become a more regular winter story. This is a hot research topic and is by no means settled, but a handful of studies offer compelling evidence that the stratospheric polar vortex is changing, and that this trend can explain bouts of unusually cold winter weather.

Undoubtedly this new polar vortex attack will unleash fresh claims that global warming is a hoax. But this ridiculous notion can be quickly dispelled with a look at predicted temperature departures around the globe for early this week. The lobe of cold air over North America is far outweighed by areas elsewhere in the United States and worldwide that are warmer than normal.


Predicted daily mean, near-surface temperature (C) differences from normal (relative to 1979-2000) for Jan. 28-30, 2019. Data from NOAA’s Global Forecast System model.
Climate Reanalyzer, Climate Change Institute, University of Maine., CC BY-ND
Symptoms of a changing climate are not always obvious or easy to understand, but their causes and future behaviors are increasingly coming into focus. And it’s clear that at times, coping with global warming means arming ourselves with extra scarfs, mittens and long underwear.

Jennifer Francis, Visiting Professor, Rutgers University

This article is republished from The Conversation under a Creative Commons license. Read the original article.