Showing posts with label IASI. Show all posts

Sunday, April 26, 2015

Methane levels as high as 2845ppb

Methane levels as high as 2845 parts per billion (ppb) were recorded on April 25, 2015, as illustrated by the image below.


This is an extremely high peak. The average daily peak in 2015 until May 1 was 2371 ppb, while the highest daily mean ranged from 1807 ppb (January 10) to 1829 ppb (April 22). Daily peaks and daily highest mean levels in 2015 are shown on the image below.


These peaks are much higher than they were in previous years, as illustrated by the image below, from an earlier post and showing the average highest peak readings in 2013 and 2014 at selected altitudes..


Peak readings in above image are averages over April 2013 and April 2014. On specific days, peak readings could be much higher, e.g. on April 28, 2014, methane levels were recorded as high as 2551 ppb at 469 mb. As said, methane levels as high as 2845 ppb were recorded on April 25, 2015, while the average peak for the first four months of 2015 was 2371 ppb, and this average was calculated from peaks across altitudes.

The table below shows the altitude equivalents in mb (millibar) and feet.
56,925 ft44,689 ft36,850 ft30,569 ft25,543 ft19,819 ft14,383 ft8,367 ft1,916 ft
74 mb147 mb218 mb293 mb367 mb469 mb586 mb742 mb945 mb

Peak levels in April appear to be rising strongly each year, following higher peak readings during previous months, especially at higher altitudes, i.e. especially the Arctic Ocean. It appears that much of the additional methane originating from the higher latitudes of the Northern Hemisphere has moved closer to the equator over the past few months, and is now accumulating at higher altitudes over the continents on the Northern Hemisphere, i.e. Asia, Europe, North America and north Africa.

Further analysis of the rise in global mean methane levels appears to confirm the above. The image below shows methane levels on April 22, over three years. While there appears to be little or no rise in mean methane levels at low altitudes, the rise is quite profound at higher altitudes.  

[ click on image to enlarge ]
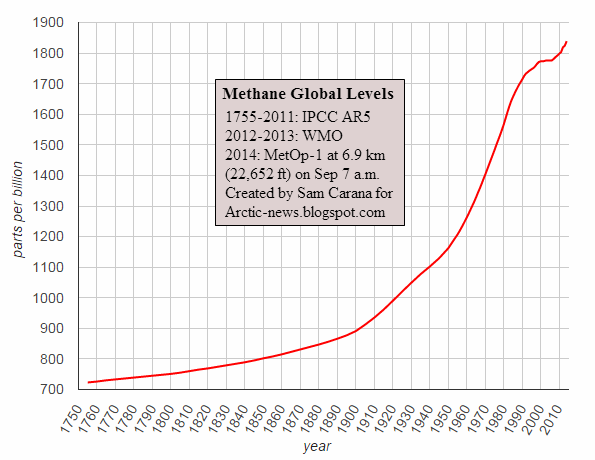
Things look set to get worse. As shown by the image below, from an earlier post, global methane levels have risen sharply from a low of 723 ppb in 1755. Mean methane levels were as high as 1839 ppb in 2014. That's a rise of more than 254%.
As that post concluded a year ago, it appears that the rise of methane in the atmosphere is accelerating. What can we expect? As temperatures can be expected to continue to rise and as feedbacks start to kick in, this may well constitute a non-linear trend. The image below shows a polynomial trend that is contained in IPCC AR5 data from 1955 to 2011, pointing at methane reaching mean global levels higher than 3000 ppb by the year 2030. If methane starts to erupt in large quantities from clathrates underneath the seafloor of the Arctic Ocean, this may well be where we are heading. 


The situation is dire and calls for comprehensive and effective action, as discussed at the Climate Plan.


The 2845 ppb recorded on April 25, 2015, is an extremely high peak. The average daily peak in 2015 until now was 2372...
Posted by Sam Carana on Monday, April 27, 2015

Wednesday, January 8, 2014

High Methane Levels over Arctic Ocean continue in 2014

The high methane levels over the Arctic Ocean, the biggest story of 2013, continue in 2014, as illustrated by the image below.


As above image shows, high methane readings (as high as 2301 ppb on January 6, 2014) continue in 2014. High methane concentrations continue to enter the atmosphere where the sea ice is thin and where the sea ice is carried by currents outside of the Arctic Ocean.

The inset shows ice thickness on January 6, 2014. The inset highlights the huge amounts of sea ice that are carried by the sea current from the north of Greenland into the Atlantic Ocean.

What is the impact of these high methane releases over the Arctic Ocean on global methane levels? The image below shows the most recent global methane levels available from NOAA.


The image below shows readings from surface flask at Mauno Loa, Hawaii, with two recent readings (in the top right corner) reaching levels close to 1880 ppb.


Clearly, methane levels are rising globally and high releases over the Arctic Ocean are contributing to the global rise. The images below show recent data from stations in the Arctic, i.e. the image below showing readings from in situ measurements at the station at Barrow, Alaska, and the image further below showing flask samples taken at Tiksi, Russia.


Note that the above images reflect land-based measurements taken at altitudes that are typically too low to capture the extent at which methane is rising in the atmosphere over the Arctic Ocean. Nonetheless, the wind can at times carry along some of the methane from the Arctic Ocean, as is apparent in a number of readings in above images showing levels of over 2100 ppb.

The image below shows high methane releases over the Arctic Ocean, as recorded on (part of) January 7, 2014, when levels were reached as high as 2381 ppb.


The image below shows methane levels on (part of) January 8, 2014, when levels as high as 2341 ppb were recorded. The inset confirms indications that these high levels originate from the Arctic Ocean.


These high methane concentrations over the Arctic are contributing to high temperature anomalies that further accelerate warming in the Arctic, as illustrated by the image below.


For a more detailed description of the kinds of warming and feedbacks that are hitting the Arctic, see the post The Biggest Story of 2013.


Saturday, November 2, 2013

Locating sources of the world's highest methane levels


Above image shows IASI methane readings end October 2013 on the Northern Hemisphere. Clearly, high methane levels are very prominent over the Arctic. Over this period, the following peak methane readings have been recorded:
- October 28 - 2369 ppb
- October 29 - 2303 ppb
- October 30 - 2480 ppb
- October 31 - 2332 ppb

[ click on image to enlarge ]
Above image shows methane readings of 1950 ppb and higher in yellow, but only on October 31, 2013, pm.

This image is easier to analyze, since there are only a few areas where high methane readings show up, such as:
  • Last but not least, there's a huge area with high methane readings over the Arctic Ocean.
The image below again shows methane readings of 1950 ppb and higher in yellow on October 31, 2013, pm, but this time only for 3 altitudes, i.e. 451 mb, 469 mb and 487 mb. These levels were selected for their proximity to the altitude of 469 mb, where typically the highest mean global methane levels are recorded, i.e. from 1809 ppb to 1812 ppb for the period from October 28 to 31, 2013. Not surprisingly, the image below looks much the same as above image.


Things look rather different, though, when 3 altitudes are selected closer to sea level. The image below again shows methane readings of 1950 ppb and higher in yellow on October 31, 2013, pm, but this time only at 718 mb, 742 mb and 766 mb. These altitudes showed the highest methane readings that day, of 2322 ppb, 2332 ppb and 2316 ppb, respectively.


Ominously, high methane readings at these lower altitudes show up mostly in the Laptev Sea. In conclusion, some of the world's highest methane levels show up over the Laptev Sea, a huge area most prone to abrupt release of huge amounts of methane from the seabed.

This is further evidence in support of the looming threat of Abrupt Climate Change leading to extinction of many if not all species (i.e. including humans) within decades. It disproves the efforts of the IPCC, as discussed in the post Just do NOT tell them the monster exists, and further organizations to downplay the threat by spreading myths.

Monday, October 28, 2013

Methane over Arctic Ocean is increasing


[ click on image to enlarge ]

Above image shows the Northern Hemisphere on October 26 - 27, 2013, a period of just over one day. Methane readings of 1950 ppb and higher show up in yellow. Peak reading on October 27, 2013, was 2369 ppb.

The image below, created by Harold Hensel with methanetracker, shows methane over the Arctic Ocean in three ranges, with the highest readings (1950 ppb and higher) in red.

[ click on image to enlarge ]
Harold adds: "Methane increased again in the Arctic Circle yesterday, 10/27/2013. So what were the headlines in the news? It wasn't this which is more important than anything the media has to report. This is surreal to me." - at Facebook

Related

- The Unfolding Methane Catastrophe
http://arctic-news.blogspot.com/2013/10/unfolding-methane-catastrophe.html

- Methane hydrates
http://methane-hydrates.blogspot.com/2013/04/methane-hydrates.html

- Myths about methane hydrates
http://methane-hydrates.blogspot.com/p/myths.html

- High Methane Readings continue over Depth of Arctic Ocean
http://arctic-news.blogspot.com/2013/10/high-methane-readings-continue-over-depth-of-arctic-ocean.html

- Abrupt Climate Change
http://arctic-news.blogspot.com/2013/10/abrupt-climate-change.html

- Just do NOT tell them the monster exists
http://arctic-news.blogspot.com/2013/10/just-do-not-tell-them-the-monster-exists.html


Sunday, October 20, 2013

Methane presence over Arctic Ocean continues


The image on the right, created with IPCC data, shows that methane levels have risen even stronger than levels of two other greenhouse gases, i.e. carbon doxide (CO2) and nitrous oxide (N2O).

Methane levels have risen strongly over the past few years, especially over the Arctic.

Previous posts at this blog have illustrated that, from early October 2013, high methane readings have shown up persistently over the depths of the Arctic Ocean.

The persistence of these readings indicates that this methane wasn't blown there from elsewhere. Furthermore, the presence of methane appears to line up closely with the fault line that crosses the Arctic Ocean and extends into Siberia and further into the Sea of Okhotsk.

The latest data show a continuation of this worrying methane presence over the Arctic Ocean.


On October 18, 2013, readings of up to 2426 ppb were recorded. As the above image shows, high peak readings have occurred over the past few months. Currently, however, high readings can be more clearly attributed to methane venting from the depths of the Arctic Ocean. On the image below, methane shows up very prominently over the Arctic Ocean.


For more background, see posts below.

Related

- The Unfolding Methane Catastrophe
http://arctic-news.blogspot.com/2013/10/unfolding-methane-catastrophe.html

- Methane hydrates
http://methane-hydrates.blogspot.com/2013/04/methane-hydrates.html

- Myths about methane hydrates
http://methane-hydrates.blogspot.com/p/myths.html


Tuesday, October 15, 2013

High Methane Readings continue over Depth of Arctic Ocean

The image below contains 12 frames, with methane readings recorded over 12 days in the first half of October 2013.

[ click on image to enlarge ]
As discussed in earlier posts at this blog, high methane readings have been recorded recently over the depth of Arctic Ocean. Above image shows that these high readings are continuing. The image below shows that at 469 mb, the altitude at which the highest reading was recorded on the afternoon of October 13, methane shows up very prominently over the Arctic Ocean.

The fact that little methane shows up elsewhere indicates that methane is present at high levels, at times over 2200 ppb, over the depth of the Arctic Ocean, and that these high levels result from methane that originates from hydrates under the seabed.

The image below, with methane readings over the past few days (from October 12 10:00 pm to October 14 11:23 pm), shows high levels of methane over the depth of the Arctic Ocean.


The image below shows methane readings at 586 mb, the altitude at which the highest methane reading was recorded on the afternoon of October 14 (a reading of 2248 ppb). Again, methane is present very prominently over the depth of the Arctic Ocean.


Thursday, September 12, 2013

Methane reaches 2571 ppb


Methane as recorded by IASI* reached levels of up to 2571 parts per billion (ppb) on September 11, 2013.

The image below shows the peak levels that have been reached recently, as well as the highest mean methane level for each day.

Where did the methane come from?

IASI data do not identify locations, other than that all locations where methane is present in concentrations higher than 1950 ppb show up in yellow.

Yet, there are some ways to further examine where these high levels came from. To create the top image, only four layers were selected. The yellow spots on the image show locations where methane is present at the selected layers (695-766 mb) at concentrations of 1950 ppb and higher. At these relatively low altitudes, yellow spots will show up at fewer locations than at some of the higher altitudes, yet one can assume that the largest sources will be included among those showing up; and indeed, peak methane levels at these altitudes ranged from 2193 ppb to 2328 ppb, which are extremely high levels.

On the top image, there are several locations that look suspicious, including a large spot north of the New Siberian Islands, while the Kara Sea and the Barents Sea, and many locations around Greenland all feature suspicious yellow spots.

Most worrying are the numerous spots clustered off the coast of Norway, which show up quite prominently at many altitudes. The situation is reminiscent of the Storegga Slides, the underwater landslides that occurred at the edge of Norway's continental shelf thousands of years ago. The latest incident occurred some 8,000 years ago.

Seismic Activity

Earthquakes can cause tremors over long distances, especially along fault lines.


There has been some seismic activity close to Greenland that could have triggered one or more landslides off the cost of Norway, since the fault line points that way. An earthquake with a magnitude of 4.5 on the Richter scale occurred occured on September 1, 2013, 08:49:19 UTC, at a location 214km NE of Nord, Greenland, as illustrated by above image and the image below.


* IASI (Infrared Atmospheric Sounding Interferometer) is a hyperspectral infrared sounder residing on the European Space Agencys (ESA) MetOp series of polar orbiting satellites.

Thursday, July 18, 2013

High methane readings over Kara Sea

Arctic sea ice extent 2013 (brown line on NSIDC-image below) is more and more following the same path it did last year (dashed line), when extent reached a record minimum, and in 2007 (blue line), the previous record minimum.


Even more worryingly, sea ice is very thin, as the Naval Research Laboratory animation below shows; large areas with a thickness of 1 meter to zero persist close to the North Pole, as discussed in an earlier post; the image below, from the North Pole Environmental Observatory shows lots of water and that it's raining at the North Pole.


The above animation also shows the retreat of sea ice from the Kara Sea, north of Siberia, over the past 30 days.

As can be expected, high sea surface temperature anomalies show up in areas where the sea ice has retreated, as shown by the DMI image below.


Most worryingly, high methane readings appear over the Kara Sea, as shown on the image below.

[ click on image to enlarge ]

Wednesday, May 22, 2013

Is the permafrost's integrity breaking down?


The chart below shows very high methane levels over Antarctica in April and May 2013. High levels of methane over Antarctica were recorded before in 2013, as described in an earlier post at the methane-hydrates blog.

Meanwhile, a methane reading of 2475 ppb was recorded on April 26, 2013, appearing to originate from the Himalayan Plateau, as illustrated by the image below.


Recurring high readings could indicate that methane is bubbling up through the permafrost, both in Antarctica and on the Himalayan Plateau.

Loss of the integrity of the permafrost is particularly threatening in the Arctic, where the sea ice looks set to disappear within years, resulting in huge albedo changes in summer. Decrease of surface reflectivity results in increases in absorption of energy from sunlight and decreases in shortwave radiation in the atmosphere. The latter results in lower photo-dissociation rates of tropospheric gases. Photo-dissociation of the ozone molecule is the major process that leads to the production of OH (hydroxyl radical), the main oxidizing (i.e., cleansing) gas species in the troposphere. A 2009 NASA study projects this to lead to a decrease in OH concentrations and a weakening of the oxidizing capacity of the Arctic troposphere, further increasing the vulnerability of the Arctic to warming in case of additional methane releases.

Levels of greenhouse gases such as carbon dioxide and methane are already very high in the Arctic atmosphere, while large quantities of black carbon get deposited on snow and ice, further contributing to the albedo changes. This threatens to result in rapid summer warming of many parts of the Arctic Ocean with very shallow waters. Additionally, rivers can bring increasingly warm water into those shallow seas in summer, adding to the threat that heat will penetrate the seabed that contains huge quantities of methane.


Above image, earlier included in an animation at the Arctic-news blog, shows methane concentrations on January 23, 2013, when a reading of 2241 ppb was recorded in the Arctic.

Analysis of sediment cores collected in 2009 from under ice-covered Lake El'gygytgyn in the northeast Russian Arctic suggest that, last time the level of carbon dioxide in the atmosphere was about as high as it is today (roughly 3.5 to 2 million years ago), regional precipitation was three times higher and summer temperatures were about 15 to 16 degrees Celsius (59 to 61 degrees Fahrenheit), or about 8 degrees Celsius (14.4 degrees Fahrenheit) warmer than today.

As temperatures rose back in history, it is likely that a lot of methane will have vented from hydrates in the Arctic, yet without causing runaway warming. Why not? The rise in temperature then is likely to have taken place slowly over many years. While on occasion this may have caused large abrupt releases of methane, the additional methane from such releases could each time be broken down within decades, also because global methane levels in the atmosphere were much lower than today.

In conclusion, the situation today is much more threatening, particularly in the East Siberian Arctic Shelf (ESAS), as further described in the earlier post methane hydrates.

Above post is an extract of the full post at the methane-hydrates blog

Saturday, March 16, 2013

Record Methane in Arctic early March 2013

The image below, produced by Dr. Leonid Yurganov, shows methane levels for the first ten days of March 2013.


Methane levels for this period are at record highs in the Barents and Norwegian Seas, i.e. the highest levels ever recorded by IASI, which is is short for Infrared Atmospheric Sounding Interferometer, a Fourier transform spectrometer on board the European EUMETSAT Metop satellite that has supplied data since 2007.

The record levels are indicated on the image below at the top right, while the geographical location of the four domains distinguished in the image are illustrated on the image further below.


The image at the top of this post displays average methane levels for the period March 1 to 10, 2013, at 600 mb. On individual days and on specific locations, methane levels could be much higher, as illustrated by the NOAA image below showing methane levels reaching a high of 2237 ppb on March 6, 2013, at 742 mb. The empty image further below is added to help distinguish land contours.


The earlier post Dramatic increase in methane in the Arctic in January 2013 showed that high methane levels lined up closely with the contours of land and sea ice. The same is the case for the record levels of methane in early March, as illustrated by the animation below.

Monday, February 4, 2013

Overview of IASI methane levels

Dr. Leonid Yurganov kindly shared an overview of his analysis of IASI methane levels over the years.
The overview shows a marked difference between methane levels in the Arctic and methane levels at lower altitudes, i.e. between 40 and 50 degrees North. Furthermore, the overview shows a steady increase in methane levels over the years, both at high latitudes and at lower latitudes. Over the Arctic, mean levels of well over 1900 ppb are now common.

The overview gives the mean values for methane levels. Peaks can be much higher. Levels of up to 2241 ppb were registered above the Arctic at 742 mb on January 23, 2013 (see earlier post). Moreover, high levels are registered over a wide area, particularly over the Barents Sea and the Norwegian Sea, which are currently free of sea ice (see earlier post), indicating worrying releases of methane from the seabed in that area.

How much extra methane is released to account for this rise in methane levels? Dr. Yurganov explains: “this may be a relatively slow process, 7 ppb per month for the area between Norway and Svalbard means only 0.3 Tg per month. But in a longer time scale (at least several years) and inclusion of the autumn Kara/Laptev emissions it might be very important both for the methane cycle and for the climate. Further discussion promises to be fruitful”.

Dr. Yurganov plans to update his overview on completion of further analysis of existing data of IASI methane levels for earlier periods, and complemented with further periods in future as the data come along.

Meanwhile, we'll keep a close eye on methane levels in the Arctic, particularly given the prospect that large areas of the Arctic Ocean (Kara Sea, Laptev Sea and East Siberian Sea) will soon become free of sea ice. Further people analyzing methane levels are invited to also comment on the situation in the Arctic.

Friday, February 1, 2013

Dramatic increase in methane in the Arctic in January 2013

Below a combination of images produced by Dr. Leonid Yurganov, showing methane levels January 1-10, 2013 (below left), January 11-20, 2013 (below center) and January 21-31, 2013 (below right).

Click on image to enlarge
Above image shows dramatic increases of methane levels above the Arctic Ocean in the course of January 2013 in a large area north of Norway.

Why are these high levels of methane showing up there? To further examine this, let's have a look at where the highest sea ice concentrations are. The image below shows sea ice concentrations for January 2013, from the National Snow and Ice data Center (NSIDC).


Overlaying methane measurements with sea ice concentrations shows that the highest levels of methane coincide with areas in the Arctic Ocean without sea ice. This is shown on the animation below, which is a 1.84 MB file that may take some time to fully load.

Thursday, January 24, 2013

High methane levels persist in January 2013

Below a combination of images produced by Dr. Leonid Yurganov, comparing methane levels between January 1-10, 2012 (below left), and January 1-10, 2013 (below right).


The 2013 image shows worryingly high levels of methane between Norway and Svalbard, an area where hydrate destabilization is known to have occurred over the past few years. Even more worrying is the combination of images below. Methane levels came down January 11-20, 2012, but for the same period in 2013, they have risen. 


On January 21, 2013, as shown on the image below, methane levels of up to 2234 ppb were recorded at 892 mb. Further examination indicated that this was caused by large releases of methane above North-Africa, apparently associated with the terrorist attack on the natural gas plant in Algeria.  An image without data is added underneath, to better distinguish locations on the map. 


It didn't take long for even higher methane levels to be reached above the Arctic. The NOAA image below shows methane levels of up to 2241 ppb above the Arctic at 742 mb on January 23, 2013. 


Below a NOAA image with temperature anomalies for January 7, 2013, when a huge area of the Arctic experienced anomalies of over 20 degrees Celsius, including a large area close to Svalbard. 


Temperatures change daily, as the wind changes direction and as sea currents keep the water moving around the Arctic Ocean. For an area close to Svalbard, the recent 30-day temperature anomalies is over 20 degrees Celsius, as shown on the NOAA image below, and this indicates persistently high temperature anomalies for that area. 


Below, a NOAA image showing sea surface temperature anomalies up to 5 degrees Celsius close to Svalbard.


Related

High methane levels persist in December 2012
- Methane contributes to accelerated warming in the Arctic