Friday, February 23, 2024

Stephen Salter, a giant in combating climate change passes away

   Stephen Salter (2012)
Stephen Hugh Salter, MBE, FRSE, Emeritus Professor of Engineering Design at the University of Edinburgh, was born December 7, 1938, and passed away peacefully on February 23, 2024, at the age of 85.

Stephen Salter was a giant who persisted to dedicate his life to combating climate change, and he did so in many ways until the very end. 

Stephen's work on wave energy led to Salter's Duck (1974), a device able to both generate energy and reduce wave strength. In 1977, Stephen built a multi-directional wave tank at the University of Edinburgh. 

In 2011, Stephen looked at ways to capture methane released in the Arctic, such as by covering lakes and parts of seas by sheets to collect the methane (drawing below).

Empty and filled extruded rubber trough cases with 4 times enlarged views of end and centre

Stephen was perhaps best known for his work on marine cloud brightening, i.e. deploying vessels to spray salt particles into the air in an effort to reduce sea surface temperatures, and thus also reducing sea ice loss and reducing the strength of extreme weather events including storms and hurricanes.

In the video below, Stephen discusses marine cloud brightening in a TEDx talk in 2016. 


Marine cloud brightening | Prof. Stephen Salter | TEDx Talks Published 15 Nov 2016

The image below is from the post Hurricane Moderation at Arctic-news.blogspot.com


In the video below, by theedinburghreporter, Stephen Salter talks about marine cloud brightening.


In the video below, Stephen Salter is interviewed by Nick Breeze (2022). 


Below is a screenshot from the above video by Nick Breeze. 

Stephen Salter discusses sending solar energy back out to space by means of Marine Cloud Brightening.
Screenshot by Sam Carana from video by Nick Breeze.

Stephen Salter (2022): "A jolly small change in reflectivity of the clouds will be sending solar energy back out to space enough to balance what the excess is that's being retained here by greenhouse gases (4:26-4:41). Maybe 10 cubic meters of water a second as sub micron drops sprayed in the right place would offset all the damage we've done since pre-industrial times (5:15-5:24)." 

Our hearts are saddened by this huge loss, and our thoughts are with Stephen's family and his many friends. Stephen's work will not be forgotten.

Added below is a video featuring Stephen Salter, Peter Wadhams, Paul Beckwith, Robert Tulip, Herb Simmens, Alaxandra Price and Win Rampen. 


Links

• Futuristic fleet of 'cloudseeders' - by John Latham (2007)
https://news.bbc.co.uk/2/hi/programmes/6354759.stm

• Sea-going hardware for the cloud albedo method of reversing global warming - by Stephen Salter, Graham Sortino and John Latham (2008)
https://royalsocietypublishing.org/doi/10.1098/rsta.2008.0136

• Can we capture methane from the Arctic seabed? (2011)

• Professor Stephen Salter receives top Academy Award (2012)

• Leading wave energy pioneer Prof Stephen Salter (2012) 
https://www.theengineer.co.uk/content/in-depth/leading-wave-energy-pioneer-prof-stephen-salter

• Coded modulation of computer climate models for the prediction of precipitation and other side-effects of marine cloud brightening (2013)

• Marine cloud brightening | Prof. Stephen Salter | TEDxHeriotWattUniversity |  TEDx talk (2016)
• Hurricane Moderation (2018)
https://arctic-news.blogspot.com/2018/09/hurricane-moderation.html

• Talking to Professor Stephen Salter - TheEdinburghReporter (May 23, 2019)

• Speaking with Professor Stephen Salter - The Edinburgh Report (June 1, 2019)

• Professor Stephen Salter at Holyrood speaking about project to arrest climate change

• John Latham obituary (2021)
https://www.theguardian.com/science/2021/may/30/john-latham-obituay

• Stephen Salter - Whole interview by Nick Breeze ClimateGenn (2022)


Wednesday, February 21, 2024

Tragedy set to unfold in tropics

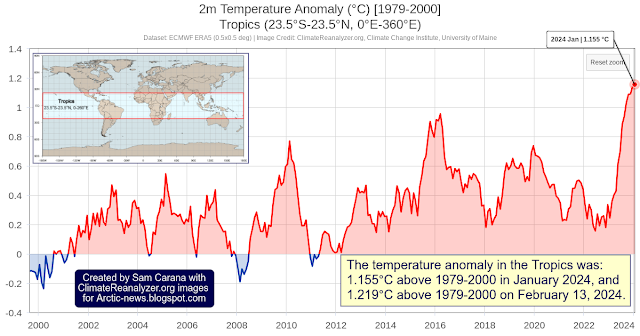
The temperature is rising rapidly in the tropics. The image below shows the situation in the tropics (23.5°S-23.5°N, 0-360°E) through February 14, 2024, when the average daily surface air temperature was 26.3°C, i.e. 1.3°C above 1979-2000.


On April 24, 2016, it was 26.8°C, the highest temperature on record in the tropics, 1°C above 1979-2000, as the above image also shows. The image below shows temperature anomalies over the years. 

Note that the above anomalies are calculated from 1979-2000, which isn't pre-industrial. When calculated from a genuinely pre-industrial base, anomalies will be higher. Also have a look at the recent analysis of sponges collected in the Caribbean, illustrated by the image below. 


According to NOAA, there is a 100% chance that the current El Niño will persist through February-March-April 2024, as illustrated by the image below. 


The danger is that a tragedy will unfold over the next few months as temperatures look set to exceed the 2016 peak in the tropics and cause widespread loss of life of people, livestock and wildlife, crop failure and ecosystem collapse in the tropics.

Climate Emergency Declaration

The situation is dire and the precautionary principle calls for rapid, comprehensive and effective action to reduce the damage and to improve the situation, as described in this 2022 post, where needed in combination with a Climate Emergency Declaration, as discussed at this group.


Links


• Climate Reanalyzer 
https://climatereanalyzer.org

• NOAA - ENSO: Recent Evolution, Current Status and Predictions
https://www.cpc.ncep.noaa.gov/products/analysis_monitoring/lanina/enso_evolution-status-fcsts-web.pdf

• Pre-industrial
https://arctic-news.blogspot.com/p/pre-industrial.html

• 300 years of sclerosponge thermometry shows global warming has exceeded 1.5 °C - by Malcolm McCulloch et al. (2024)  

• Extinction
https://arctic-news.blogspot.com/p/extinction.html

• Climate Plan
https://arctic-news.blogspot.com/p/climateplan.html

• Climate Emergency Declaration
https://arctic-news.blogspot.com/p/climate-emergency-declaration.html

Discussed at facebook:


Monday, February 5, 2024

Too late?

Climate change denial and the rise of fascism

by Andrew Glikson

but they can be sure that they won't be recorded for their crimes in history -- because
there 
won't be any history” (Noam Chomsky, 2023, in a letter to the author)


Extreme planetary heating, the failure of effective mitigation and the rise of denial around the world combine to lead to a seventh mass extinction of species. While originally Global warming constituted an unintended consequence of the 18-20ᵗʰ centuries industrial revolution, the collapse of attempts to arrest it in the 20-21st centuries is already leading toward a mass extinction, but the rise of fascist movements and their neoconservative kins is jeopardizing a unified global approach to the climate crisis. Inherently however racist ideology, worship of power, glorification of war, the pride of killing and “honourable” death is not concerned with the fatal consequences of climate change.

Figure 1. 2023 was the warmest year since global records began in 1850 by a wide margin. It was 1.18°C
above the 20th-century average of 13.9°C. It was 1.35°C above the pre-industrial average (1850-1900).

While the authorities (so-called) claim they are trying to arrest global warming, temperatures continue to rise to fatal levels (Figure 1). Ignoring climate science, dismissing climate scientists and confecting lies while global heating accelerates with deleterious consequences, the species sapiens is finding itself on track to carbon saturation to Miocene levels (420< ppm) of its atmosphere ─ the lungs of the Earth ─ at a geologically unprecedented rate. The extreme rise in the chemistry of the atmosphere, the acidification of the oceans and the coating of the land with carbon residues and plastics are leading toward an uninhabitable Earth.

With exceptions governments pretend the introduction of alternative energy ─ solar, wind, hydrothermal, hydro and tide ─ is likely to reduce the mining of and emission from fossil fuels, but this has hardly occurred since 2022. Oblivious to the implications of climate science, the concerns of the powers that be hinge on the bottom line, an attitude echoed by much in the population. False claims abound in high places, as exemplified by the chair of COP-28 conference claiming: “there is ‘no science’ behind demands for phase-out of fossil fuels”.

Everywhere, including Australia, carbon counting hinges on domestic mining and emissions to the exclusion of carbon exports. Thus “Oil, gas, and coal exports are not counted when countries tally their greenhouse gas emissions under the Paris Agreement.”

Hopeful popular belief abound, as if new science-based discoveries could resolve climate change, as by the optimistic projection by NASA: “While we cannot stop global warming overnight, we can slow the rate and limit the amount of global warming by reducing human emissions of heat-trapping gases and soot. Such suggestions overlook the amplifying feedback from warming oceans, melting ice sheets. disintegrating permafrost, release of methane from the oceans, and migrating climate zones. Scientists are caught between a need to promote mitigation and adaptation on the one hand and a reluctance to communicate the impending calamity.

Australia’s enshrined emissions cut target of 43% by 2030, up from 26-28%, has limited consequences since it has become the fifth largest miner and the world’s third biggest exporter of fossil fuels, exporting only behind Russia and Saudi Arabia, more than Iraq, Venezuela and any country in the EU.

The blood-stained history of Homo sapiens since the mastery of fire (Figure 2), all the way to the Anthropocene crisis, combined with the proliferation of doomsday weapons, do not bode well for the future of terrestrial species.

Global empires east and west have become increasingly brutal. Fascism ─ the ideology of death ─ and its neo-conservative (so-called) followers are not concerned with global warming and its consequences, except where it hurts the profit motive. References to “climate change” by politicians constitute hollow words they hardly mean. There are not too many angels left except where the young like Greta Thunberg rebel.

Figure 2. The deep time origin of the Anthropocene.

A/Prof. Andrew Y Glikson
Earth and Paleo-climate scientist

Andrew Glikson
Books:
The Asteroid Impact Connection of Planetary Evolution
https://www.springer.com/gp/book/9789400763272
The Archaean: Geological and Geochemical Windows into the Early Earth
https://www.springer.com/gp/book/9783319079073
The Plutocene: Blueprints for a Post-Anthropocene Greenhouse Earth
https://www.springer.com/gp/book/9783319572369
The Event Horizon: Homo Prometheus and the Climate Catastrophe
https://www.springer.com/gp/book/9783030547332
Climate, Fire and Human Evolution: The Deep Time Dimensions of the Anthropocene
https://www.springer.com/gp/book/9783319225111
Evolution of the Atmosphere, Fire and the Anthropocene Climate Event Horizon
https://www.springer.com/gp/book/9789400773318
From Stars to Brains: Milestones in the Planetary Evolution of Life and Intelligence
https://www.springer.com/us/book/9783030106027
Asteroids Impacts, Crustal Evolution and Related Mineral Systems with Special Reference to Australia
https://www.springer.com/us/book/9783319745442
The Fatal Species: From Warlike Primates to Planetary Mass Extinction
https://www.springer.com/gp/book/9783030754679
The Trials of Gaia. Milestones in the evolution of Earth with reference to the Antropocene
https://www.amazon.com.au/Trials-Gaia-Milestones-Evolution-Anthropocene/dp/3031237080


Friday, February 2, 2024

Blue Ocean Event 2024?

How likely is an Arctic Blue Ocean Event (BOE) to occur in 2024 or even a Double BOE? The image below is alarming. 


The highest daily sea surface temperatures on record (going back to 1981) were reached in February 2024, even higher than the peaks in 2023. Even higher temperatures may be reached over soon, in March 2024 and April 2024.

As the above image shows, the highest temperatures for the year are typically reached in March. This was the case for the previous years on record, except for 2023 when the current El Niño started to emerge and when the highest peak for the year occurred in August. According to NOAA, the majority of models indicate that this El Niño will persist through March-May 2024. 

Antarctic sea ice extent typically reaches an annual minimum end February, while Arctic sea ice extent typically reaches an annual minimum in September, after a steep decline resulting from more sunlight reaching higher latitudes North and ocean heat reaching a second peak in August.   

Ominously, daily surface air temperatures in the Southern Hemisphere exceeded 17°C recently, something that never happened before in the record going back to 1981. Antarctic sea ice extent typically reaches an annual minimum end February. Loss of sea ice acts as a self-reinforcing feedback loop, accelerating the temperature rise. The daily surface air temperature in the Southern Hemisphere was 17.005°C on Feb 1, 2024, following a peak of 17.01°C on Jan 31, 2024.


Higher temperatures can cause sea ice to melt, even out of season

As illustrated by the image below, adapted from Pidwirny, sunlight does not reach the North Pole until the March Equinox. From that time on, insolation rises steeply. Around the June Solstice, more sunlight reaches the North Pole than anywhere else on Earth. In the image below, insolation is calculated taking into account the combined effects of angle of incidence and day length duration. 

The conclusion is that ocean heat is the main reason why melting of Arctic sea ice can occur early in the year. More specifically, the narrowing of the temperature difference between the Arctic and the Tropics can at times cause strong wind to be present along the path of the Gulf Stream. Rising ocean heat combined with strong wind can cause heat to move abruptly toward the Arctic Ocean, causing sea ice to fall in extent. 

Such an event is illustrated by the image below, adapted from NSIDC. The image shows a drop in sea ice extent at the end of January 2024 (blue), a time of year when Arctic sea ice is still expected to increase in extent and to keep increasing in extent for some time to come (grey). In this case, strong wind may have caused a huge amount of ocean heat that is present in the North Atlantic to move abruptly toward the Arctic Ocean, as discussed in an earlier post

For the time of year, Arctic sea ice extent is currently still extensive, compared to earlier years, which is a reflection of more water vapor in the atmosphere and more precipitation. While sea ice extent is relatively large, sea ice volume is among the lowest of all years on record for the time of year, as illustrated by the image below. 

This indicates that Arctic sea ice is very thin. Ominously, the image below indicates that there is a huge area near the North Pole with very thin sea ice. 


Furthermore, much of the thicker sea ice is located off the east coast of Greenland, which means that this sea ice is likely to melt away quickly as more sunlight starts reaching the Northern Hemisphere and temperatures rise in line with seasonal changes (see the insolation image further above).


The North Atlantic sea surface temperature was 20.4°C on February 15, 2024, i.e. 0.6°C higher than on February 15, 2023.

High North Atlantic sea surface temperatures spell bad news for the Arctic, as much ocean heat gets pushed toward the Arctic from the North Atlantic. 

North Atlantic sea surface temperatures are just starting to heat up from their annual minimum and can be expected to rise strongly, in line with seasonal changes. 

[ click on images to enlarge ]
Ominously, a peak temperature of 25.4°C was reached on Aug.31, 2023, much higher than the peak in any of the preceding years dating back to 1981.

During the six months between the September Equinox and the March Equinox (see image further above), no sunlight is reaching the North Pole. 

Nonetheless, temperature anomalies in the Arctic are already extremely high, due to ocean heat that has entered the Arctic Ocean from the North Atlantic, as illustrated by the two maps on the right and the two maps on the right further below.

Northern Hemisphere Sea Surface Temperature Anomalies were as much as 12.6°C or 22.7°F higher than 1981-2011 on February 15, 2024, locarion marked by the green circle on the image below.


Feedbacks 

Slowing down of AMOC and cooling due to heavier melting of Greenland's ice is causing less ocean heat to reach the Arctic Ocean, while a huge amount of ocean heat is accumulating in the North Atlantic, as it did in 2023. A large part of this heat in the North Atlantic can also be present underneath the sea surface.

These developments occur at the same time as ocean stratification increases (as temperatures rise, see above images), as more freshwater enters the ocean (as a result of more meltwater and of runoff from land and from rivers), and as more evaporation takes place and more rain falls further down the path of the Gulf Stream, all of which can contribute to formation and growth of a cold, freshwater lid at the surface of the North Atlantic.

cold freshwater lid on North Atlantic ]

Furthermore, storms can get stronger as temperatures rise and as changes take place to the Jet Stream. Strong wind can temporarily speed up currents that carry huge amounts of ocean heat with them toward the Arctic Ocean, as discussed in earlier posts such as this one. Much of the ocean heat in the North Atlantic can therefore be pushed abruptly underneath this freshwater lid and flow into the Arctic Ocean. The image below shows that the Jet Stream reached speeds as high as 455 km/h or 283 mph north of Washington on February 18, 2024 03:00 UTC, with Instantaneous Wind Power Density as high as 387.5 kW/m².


The image below shows wind speed at 250 hPa on a background of sea surface temperature anomalies versus 1981-2011. 


The danger is that, due to strong wind along the path of the Gulf Stream, huge amounts of ocean heat will abruptly get pushed into the Arctic Ocean, with the influx of ocean heat causing destabilization of hydrates contained in sediments at the seafloor of the Arctic Ocean, resulting in eruptions of huge amounts of methane.

Changes to the Jet Stream and ocean heat accumulating in the North Atlantic Ocean are both consequences of the overall temperature rise. A distorted Jet Stream can cause an abrupt influx of ocean heat into the Arctic Ocean.

Such additional ocean heat, combined with a steep rise in insolation hitting the Arctic in April and May, may suffice to cause a Blue Ocean Event (BOE) to occur in 2024.

[ click on images to enlarge ]
The far North has the highest temperature anomalies, they can as high as 7.04°C, as the image on the right shows.

A BOE occurs when virtually all sea ice disappears and less than 1 million km² of sea ice remains. As the sea ice disappears, the surface color changes from white (sea ice) to blue (ocean) resulting in far more sunlight getting absorbed by the Arctic Ocean, instead of getting reflected back into space as was previously the case.

Albedo change constitutes a huge self-reinforcing feedback loop, i.e. the more sea ice disappears, the more sunlight gets absorbed by the Arctic Ocean, further accelerating sea ice melting. 

[ Albedo change, from the Albedo page ]

Next to the albedo loss, there is loss of the latent heat buffer constituted by the sea ice. Latent heat is energy associated with a phase change, such as the energy consumed when solid ice turns into water (i.e. melts). During a phase change, the temperature remains constant. Sea ice acts as a buffer that absorbs heat, while keeping the temperature at about zero degrees Celsius. As long as there is sea ice in the water, this sea ice will keep absorbing heat, so the temperature doesn't rise at the sea surface.

The amount of energy absorbed by melting ice is as much as it takes to heat up an equivalent mass of water from zero to 80°C. 

Without the buffer constituted by thicker sea ice, an influx of ocean heat could destabilize hydrates contained in sediments at the seafloor of the Arctic Ocean, resulting in eruptions of huge amounts of methane.

[ click on images to enlarge ]
The above image illustrates these tipping points and Northern Hemisphere Ocean Temperature anomalies vs 1901-2000, created with NOAA data. Trends and tipping point estimates are added. The magenta trend is based on Jan.1880-Jan.2024 data and warns that the Seafloor Methane Tipping Point may be crossed in 2025. The red trend is based on Jan.2010-Jan.2024 data and better reflects variables such as El Niño, and it warns that the Seafloor Methane Tipping Point may be crossed in 2024. 


The above image, adapted from tropicaltidbits.com, shows a forecast for November 2024 of the 2-meter temperature anomaly in degrees Celsius, based on 1984-2009 model climatology. The anomalies are forecast to be very high for the Arctic Ocean.

Many additional feedbacks are active, such as changes to the Jet Stream and slowing down of AMOC, and they could speed up the crossing of such tipping points, as also discussed at the feedbacks page. The danger is that a cascade of events will unfold like a domino effect, leading to extinction of most species, including humans, as the image below warns. 

[ from earlier post - click on images to enlarge ]

Greenhouse gases rising

Meanwhile, concentrations of greenhouse gases keeps rising, as illustrated by the image below. 

The average daily carbon dioxide (CO₂) at Mauna Loa, Hawaii, was 426.21 ppm (parts per million) on February 4, 2024. The weekly average was 425.83 ppm. 

Critical is the rate of change, in particular the rapid rise in temperatures and greenhouse gas concentrations. To find higher CO₂ concentrations, one has to go back millions of years. 


A recent study concludes that: 
- A doubling of CO₂ is predicted to warm the planet a whopping 5°C to 8°C.
- The last time atmospheric CO₂ consistently reached today’s human-driven levels of 420 ppm was 14 million years ago.
- The hottest period was about 50 million years ago, when temperatures were as much as 12°C higher than today.

Climate Emergency Declaration

The situation is dire and the precautionary principle calls for rapid, comprehensive and effective action to reduce the damage and to improve the situation, as described in this 2022 post, where needed in combination with a Climate Emergency Declaration, as discussed at this group.


Links

• Blue Ocean Event
https://arctic-news.blogspot.com/p/blue-ocean-event.html

• Climate Reanalyzer - Daily Sea Surface Temperature, World (60°S-60°N)
https://climatereanalyzer.org/clim/sst_daily

• Pidwirny, M. "Earth-Sun Relationships and Insolation". Fundamentals of Physical Geography, 2nd Edition (2006)
http://www.physicalgeography.net/fundamentals/6i.html

• NOAA - ENSO: Recent Evolution, Current Status and Predictions
https://www.cpc.ncep.noaa.gov/products/analysis_monitoring/lanina/enso_evolution-status-fcsts-web.pdf 

• NSIDC - Arctic sea ice extent
https://nsidc.org/arcticseaicenews/charctic-interactive-sea-ice-graph

• Danish Meteorological Institute - Arctic sea ice volume and thickness
https://ocean.dmi.dk/arctic/icethickness/thk.uk.php

• University of Bremen - Arctic sea ice

• Scripps Institution of Oceanography at UC San Diego.

• Toward a Cenozoic history of atmospheric CO₂ - by The Cenozoic CO₂ Proxy Integration Project (CenCO₂PIP) Consortium