Water is visible near the North Pole, as illustrated by the satellite image below, dated September 4, 2026.

With much water being visible near the North Pole, Arctic sea ice volume is currently not the lowest for the time of year, as illustrated by the image below.


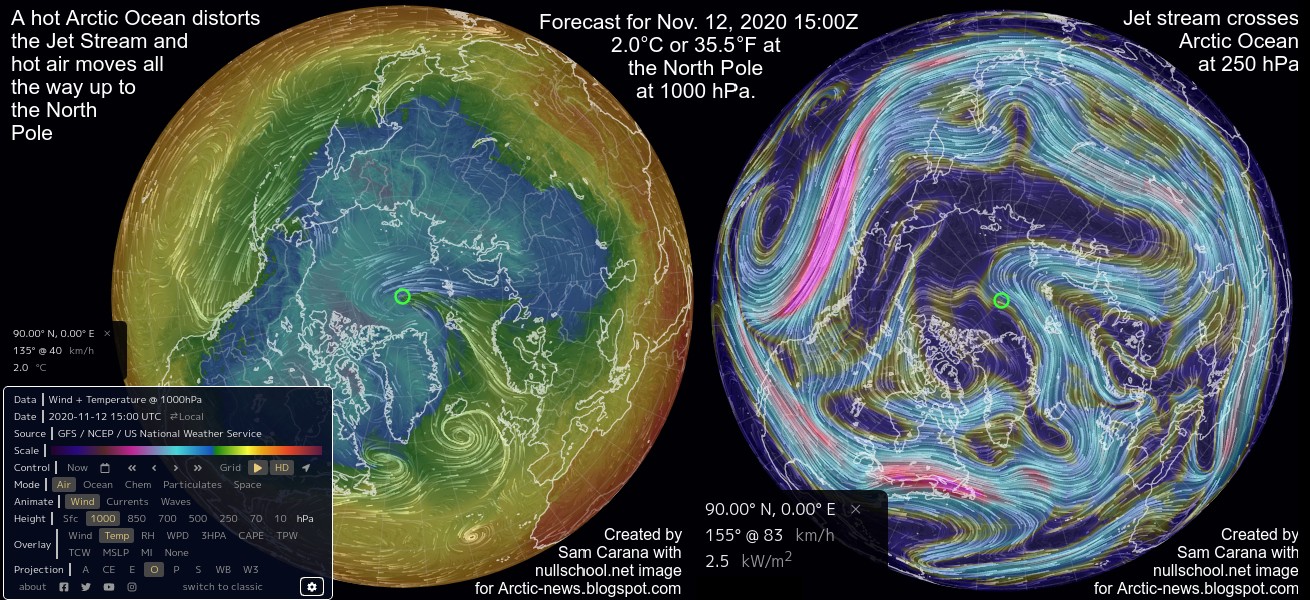
Rising temperatures and distortion of the Jet Stream can cause extreme weather events to become more extreme. Rising temperatures will result in more water vapor in the atmosphere (7% more water vapor for every 1°C warming). As illustrated by the combination image below, this can cause more snow to fall over the Arctic Ocean, which can thicken the sea ice or contribute to more freshwater at the surface.
Stronger heatwaves and storms over land can also cause increasingly larger amounts of freshwater to get added to the surface of the Arctic Ocean in the form of water from rivers and from runoff from land, as illustrated by the image below. Less salty water can contribute to a temporary slowing down of Arctic sea ice melting, but given the speed at which the ocean heat keeps rising, such a slowdown looks set to be overwhelmed soon and huge melting of sea ice threatens to return with a vengeance, i.e. abruptly, as sea surface temperatures keep rising in line with the 2026 El Niño.


According to the IPCC AR6 WG1, 91% of the extra energy is taken up by oceans, 5% by land, 3% by ice melting and 1% remains in the atmosphere. Oceans, land and ice melting thus act as a buffer that did take up the vast majority (99%) of the extra energy, based on IPCC data.
More ocean heat entering the Arctic Ocean subsequently threatens to cause abrupt destabilization of sediments containing huge amounts of methane.
Warm water can cause melting of the ice that is held in cracks and passages in sediments at the seafloor of the Arctic Ocean, allowing methane contained in the sediment to escape.
The image on the right, from a study by Hovland et al., featured in an earlier post. Hydrates can be present at the end of conduits leading to Pingos that were formed in the sediment where methane did escape from hydrates in the past. Heat can travel down such conduits relatively fast, warming up the ice in the Pingos and conduits, destabilizing hydrates and resulting in huge abrupt releases of methane from the hydrates, as well as from methane held in the form of free gas underneath such hydrates.
The huge amount of ocean heat present in the Pacific Ocean at the Equator is illustrated by the image below, adapted from NOAA, with subsurface temperature anomalies of +10.0°C at 100 m depth.

In the Atlantic Ocean, slowing down of AMOC can cause less warm water to flow at the sea surface of the North Atlantic into the Arctic ocean. However, the rising ocean heat is not disappearing, but more heat is instead accumulating in the Atlantic Ocean. The danger is that, as more heat rises to the surface, a single cyclone may suffice to abruptly move huge parts of the accumulated ocean heat into the Arctic Ocean. Furthermore, a freshwater lid is forming at the surface of the North Atlantic, due to ocean stratification, meltwater and increased precipitation falling down the path of the Gulf Stream, facilitating warm, salty water to be carried underneath this freshwater lid into the Arctic Ocean.


According to Copernicus, the August 2026 average surface air temperature was 16.96°C, the highest monthly surface air temperature on record and an anomaly of 1.65°C above 1850-1900.


Sea surface temperatures are also high and this also contributes to Antarctic sea ice decline. Additionally, there is another mechanism contributing to the decline of Antarctic sea ice. At this time of year, the temperature can be -70°C or even lower near the South Pole and over East Antarctica, so temperature differences between the Equator and the South Pole can be very large.
Conclusion
The situation is dire and unacceptably dangerous, and the precautionary principle necessitates the danger to be acknowledged, while facilitating rapid, comprehensive and effective action to reduce the damage and to improve the outlook, where needed in combination with a Climate Emergency Declaration, as described in posts such as in this 2022 post and this 2025 post, and as discussed in the Climate Plan group.
 |
| [ Forecasts for September 5, 2026. Click on images to enlarge ] |

Sea surface temperatures were at a record high in August 2026, as illustrated by the above image.

Temperatures of the sea surface are very high, as much as 13°C or 23.3°F higher than 1981-2011 on September 4, 2026, in the Gulf of Ob (green circle on the above image). The image also shows that the cold area that was previously visible south of Greenland got overwhelmed by the huge rise in ocean heat, as the 2026/2027 El Niño keeps gaining in strength and as Earth's Energy Imbalance keeps increasing, as illustrated by the image below, by Leon Simons.

The absorbed incoming solar radiation (the black line in the above image, but orange in the image below) is increasing rapidly, due to albedo loss, while outgoing longwave radiation (the red line in the above image, but black in the image below) is decreasing proportionally, due to rising concentrations of greenhouse gases. Further gases, aerosols and feedbacks can make things worse. The result is an increasingly larger amount of extra energy stored on Earth, referred to as Earth's Energy Imbalance. The image below, from an earlier post, depicts Earth energy imbalance (red in the image below) and shows where the extra energy is going (in percentages).

According to the IPCC AR6 WG1, 91% of the extra energy is taken up by oceans, 5% by land, 3% by ice melting and 1% remains in the atmosphere. Oceans, land and ice melting thus act as a buffer that did take up the vast majority (99%) of the extra energy, based on IPCC data.
More ocean heat entering the Arctic Ocean subsequently threatens to cause abrupt destabilization of sediments containing huge amounts of methane.
 |
| Pingos and conduits. Hovland et al. (2006) |
The image on the right, from a study by Hovland et al., featured in an earlier post. Hydrates can be present at the end of conduits leading to Pingos that were formed in the sediment where methane did escape from hydrates in the past. Heat can travel down such conduits relatively fast, warming up the ice in the Pingos and conduits, destabilizing hydrates and resulting in huge abrupt releases of methane from the hydrates, as well as from methane held in the form of free gas underneath such hydrates.

In the Atlantic Ocean, slowing down of AMOC can cause less warm water to flow at the sea surface of the North Atlantic into the Arctic ocean. However, the rising ocean heat is not disappearing, but more heat is instead accumulating in the Atlantic Ocean. The danger is that, as more heat rises to the surface, a single cyclone may suffice to abruptly move huge parts of the accumulated ocean heat into the Arctic Ocean. Furthermore, a freshwater lid is forming at the surface of the North Atlantic, due to ocean stratification, meltwater and increased precipitation falling down the path of the Gulf Stream, facilitating warm, salty water to be carried underneath this freshwater lid into the Arctic Ocean.

The above combination image shows the situation on September 3, 2026, with Arctic sea ice concentration in the panel on the left, and sea surface temperature anomalies in the panel on the right, with a 0.6°C higher temperature than 1981-2011 highlighted at the green circle near the North Pole.

The above combination image shows Arctic sea ice concentration on September 7, 2026, by the University of Bremen (left) and on September 6, 2026, by NSIDC (right), with the orange line indicating the median ice edge 1981-2010.

The sea surface temperature anomaly (60°S-60°N) was +0.69°C compared to 1991-2020 on September 7, 2026, as illustrated by the above image, adapted from Copernicus. The map (inset, top right) shows sea surface temperature anomalies versus 1991-2020 on September 7, 2026.

The August 2026 temperature anomaly above 1951-1980 was close to the peak reached in September 2023, as illustrated by the above image.
The sea surface temperature (60°S-60°N) was 21.23°C or 70.21°F on September 8, 2026, the highest temperature on record, and an anomaly of 1.01°C versus 1982-2010, as illustrated by the image below.

There is much scope for the temperature to rise further, since El Niño is expected to reach its peak in December 2026. The image below shows global monthly temperature anomalies versus 1901-1910 (not pre-industrial) through August 2026 with a polynomial trend added to warn about the potential that a 3°C rise may cause human extinction.
There is much scope for the temperature to rise further, since El Niño is expected to reach its peak in December 2026. The image below shows global monthly temperature anomalies versus 1901-1910 (not pre-industrial) through August 2026 with a polynomial trend added to warn about the potential that a 3°C rise may cause human extinction.
The 2026 El Niño
The image below shows ECMWF sea surface temperature anomaly forecast plumes in three El Niño regions dated September 1, 2026.

The above forecasts indicate that El Niño will reach peak strength in December 2026, when sea surface anomalies in the Niño3.4 region are expected to exceed 4°C above 1991-2020. The image below shows the significance of exceeding 4°C above 1951-1980 compared with earlier El Niños.

The image below shows sea surface temperatures in the El Niño 3.4 region through September 6, 2026, when the temperature was 29.62°C or 85.32°F, an anomaly of 2.96°C or 5.33°F versus 1982-2010 and a jump of 3.87°C from the 25.75°C recorded on January 9, 2026. The globe (inset bottom) shows sea surface temperature anomalies versus 1991-2020 on September 6, 2026 with the Nino3.4 region highlighted in the Pacific Ocean.

Teleconnections: High temperatures in Tropics contributing to Antarctic sea ice decline
The image below shows surface air temperatures in the Tropics through September 4, 2026, when the temperature in the Tropics was 26.27°C or 79.29°F, an anomaly of 1.33°C or 2.39°F versus 1979-2000. The globe (inset bottom right) shows surface air temperature anomalies versus 1991-2020 on September 4, 2026 with the Tropics highlighted.
Sea surface temperatures are also high and this also contributes to Antarctic sea ice decline. Additionally, there is another mechanism contributing to the decline of Antarctic sea ice. At this time of year, the temperature can be -70°C or even lower near the South Pole and over East Antarctica, so temperature differences between the Equator and the South Pole can be very large.
Large temperature differences can cause strong wind patterns driving warm, moist air in the form of atmospheric rivers toward Antarctica, on the way taking up more moisture evaporating from the Southern Ocean. This can cause snow to fall over parts of Antarctica, thickening the snow and ice cover on Antarctica, while increasing the salt content of the Southern Ocean surface. Saltier surface waters sink more readily, allowing heat from the deep to rise, which can melt Antarctic sea ice from below, even during winter, making it harder for ice to reform. This vertical circulation also draws up more salt from deeper layers, reinforcing this self-amplifying feedback loop, as discussed at the Antarctica page.


Both 2016 and 2023 were strong El Niño years and the 2026 El Niño is on track to become even stronger. Antarctic sea ice typically reaches its annual minimum in February, but this time most sea ice may be gone earlier, as the 2026 El Niño is on track to increase in strength in the course of 2026 and become the strongest El Niño on record, which could devastate the sea ice over the coming months.
Antarctic sea ice
The image below shows the August 2026 temperature anomaly versus 1951-1980, adapted from ClimateReanalyzer.

The image below shows Antarctic sea ice concentration on September 5, 2026, by the University of Bremen (left) and the National Snow and Ice Data Center (right). Low concentration of the sea ice and of the snow and ice cover on land lowers albedo, resulting in more sunlight getting absorbed by Antarctica and by the sea ice around Antarctica.

On September 5, 2026, Antarctic sea ice area was 1.27 million km² lower than 1981-2010, the lowest on record for that day and a deviation of -3.39σ, as illustrated by the image below. The year 2026 is highlighted in black, the year 2023 is highlighted in blue and the years 2016, 2024 and 2025 are highlighted in purple.

Both 2016 and 2023 were strong El Niño years and the 2026 El Niño is on track to become even stronger. Antarctic sea ice typically reaches its annual minimum in February, but this time most sea ice may be gone earlier, as the 2026 El Niño is on track to increase in strength in the course of 2026 and become the strongest El Niño on record, which could devastate the sea ice over the coming months.
Conclusion
The situation is dire and unacceptably dangerous, and the precautionary principle necessitates the danger to be acknowledged, while facilitating rapid, comprehensive and effective action to reduce the damage and to improve the outlook, where needed in combination with a Climate Emergency Declaration, as described in posts such as in this 2022 post and this 2025 post, and as discussed in the Climate Plan group.

The ClimatePlan by Sam Carana calls for implementation of sets of feebates, with fees imposed on sales of polluting products and the revenues from those fees used to fund rebates on cleaner alternatives.
Sets of feebates are best implemented ASAP, separately and preferably locally, with disputes handled by Local People's Courts where randomly-chosen local residents deliver verdicts on whether policies confirm the weight of best-available science.
Where needed, Climate Emergency Declarations can support progress.
Sets of feebates are best implemented ASAP, separately and preferably locally, with disputes handled by Local People's Courts where randomly-chosen local residents deliver verdicts on whether policies confirm the weight of best-available science.
Where needed, Climate Emergency Declarations can support progress.
Links
• Climate Reanalyzer
https://climatereanalyzer.org
• NSIDC - National Snow and Ice Data Center
https://nsidc.org/sea-ice-today
• University of Bremen
https://seaice.uni-bremen.de/start
• Nullschool.net
https://earth.nullschool.net
• NASA - Worldview
https://worldview.earthdata.nasa.gov
• NOAA - El Niño/Southern Oscillation (ENSO) diagnostic discussion - 13 August 2026
https://www.cpc.ncep.noaa.gov/products/analysis_monitoring/enso_advisory/ensodisc.pdf
• Copernicus
https://pulse.climate.copernicus.eu
• ECMWF - European Centre for Medium-Range Weather Forecasts
• Copernicus
https://pulse.climate.copernicus.eu
• ECMWF - European Centre for Medium-Range Weather Forecasts
https://charts.ecmwf.int
• Double Blue Ocean Event 2026-2027? - update June 2026
https://arctic-news.blogspot.com/2026/06/double-blue-ocean-event-2026-2027-update.html
• Double Blue Ocean Event
https://arctic-news.blogspot.com/p/double-blue-ocean-event.html
• Antarctic sea ice increasingly in danger
https://arctic-news.blogspot.com/2026/08/antarctic-sea-ice-increasingly-in-danger.html
• A Tale of Two Poles
https://arctic-news.blogspot.com/p/a-tale-of-two-poles.html
• Antarctica
• Double Blue Ocean Event 2026-2027? - update June 2026
https://arctic-news.blogspot.com/2026/06/double-blue-ocean-event-2026-2027-update.html
• Double Blue Ocean Event
https://arctic-news.blogspot.com/p/double-blue-ocean-event.html
• Antarctic sea ice increasingly in danger
https://arctic-news.blogspot.com/2026/08/antarctic-sea-ice-increasingly-in-danger.html
• A Tale of Two Poles
https://arctic-news.blogspot.com/p/a-tale-of-two-poles.html
• Antarctica
https://arctic-news.blogspot.com/p/antarctica.html
• Jet Stream
https://arctic-news.blogspot.com/p/jet-stream.html
• Extreme Weather
https://arctic-news.blogspot.com/p/extreme-weather.html
• Transforming Society
https://arctic-news.blogspot.com/2022/10/transforming-society.html
• Climate Plan
https://arctic-news.blogspot.com/p/climateplan.html
• Climate Emergency Declaration
https://arctic-news.blogspot.com/p/climate-emergency-declaration.html
• Jet Stream
https://arctic-news.blogspot.com/p/jet-stream.html
• Extreme Weather
https://arctic-news.blogspot.com/p/extreme-weather.html
• Transforming Society
https://arctic-news.blogspot.com/2022/10/transforming-society.html
• Climate Plan
https://arctic-news.blogspot.com/p/climateplan.html
• Climate Emergency Declaration
https://arctic-news.blogspot.com/p/climate-emergency-declaration.html