The highest daily average carbon dioxide (CO₂) concentration recorded by the Keeling Curve, maintained by Scripps Institution of Oceanography at Mauna Loa Observatory, was 432.81 parts per million (ppm), recorded on April 1, 2026. The image below shows CO₂ over thousands of years.


What makes current conditions even more dire is that not only are concentrations of CO₂ extremely high (without match going back millions of years) and rising, but the speed at which CO₂ is currently rising is also unprecedented, while additionally there has been an increase in total solar irradiance of ∼400 Wm⁻² since the formation of the Earth. The image below shows the combined climate forcing by changing CO₂ and solar output for the past 450 million years.

Between 14 and 15 million years ago, the temperature in central Europe was 20°C higher than today, as illustrated by the image below (adapted from a 2020 study by Methner et al.).
 |
| [ from earlier post, click on images to enlarge ] |
Concentrations of carbon dioxide haven't been this high for millions of years, as confirmed by recent analysis led by Sarah Shackleton and Julia Marks-Peterson. Their analysis finds that, while the average temperature of the ocean has decreased by 2 to 2.5°C over the past 3 million years, average atmospheric carbon dioxide levels have likely remained below 300 parts per million over this time. Methane levels have also remained relatively stable. This makes the recent daily concentration of 432.81 ppm at Mauna Loa and the high recent methane levels (see earlier post) even more threatening and it means that, in addition to the key role of heat-trapping greenhouse gases, there were important contributions from other components of the climate system such as Earth’s reflectivity, variations in vegetation and/or ice cover and ocean circulation. There are many feedbacks and further contributors to acceleration of the temperature rise that could add up to a rise of more than 20°C by the end of 2026, as discussed in an earlier post.
Earth energy imbalance
Outgoing longwave radiation is reducing due to rising greenhouse gases, resulting in an increasingly larger amount of extra energy. The image below depicts Earth energy imbalance.

 |
| [ image by Leon Simons ] |
Not only is the extra energy increasing, as depicted by the above image, but the proportions of where the extra energy is going is additionally changing.
The ocean's capacity to act as an energy buffer is increasingly compromised by stratification, changes to ocean currents, changes in salinity, ocean oxygen depletion, acidification and more, as discussed in earlier posts such as this one. This is a big issue, since oceans take up 91% of the extra heat caused by greenhouse gases, so if there is even a 1% reduction in the heat taken up by oceans, the heat remaining in the atmosphere may double.
Furthermore, the capacity for ice to act as a buffer by consuming energy in the process of melting is increasingly compromised by sea ice decline, by retreat of glaciers, and by darkening of ice due to dust, algae, black carbon and more. Arctic sea ice is facing a Blue Ocean Event with sea ice decline threatening to both dramatically lower albedo and reduce the ability for ocean heat to be consumed in the process of melting. Mountain glaciers are also in decline and permafrost is approaching the point where thawing of permafrost will speed up rapidly, as discussed in earlier posts such as this one.
The capacity for land to take up heat also faces a tipping point: The Land Evaporation Tipping Point can get crossed locally when water is no longer available locally for further evapotranspiration, i.e. from all processes by which water moves from the land surface to the atmosphere via evaporation and transpiration, including transpiration from vegetation, evaporation from the soil surface, from the capillary fringe of the groundwater table, and from water bodies on land. Once this tipping point gets crossed, the land and atmosphere will heat up strongly, due to the extra heat, i.e. heat that was previously consumed by evaporation and thawing, as described at this page.
So, while the extra energy is increasing, as depicted by the above image, the capacity of oceans, land and ice to take up energy is decreasing and an increasingly large amount of extra heat therefore threatens to accumulate in the atmosphere, especially in the Northern Hemisphere over land and in the Arctic, where temperatures are rising faster than anywhere in the world.
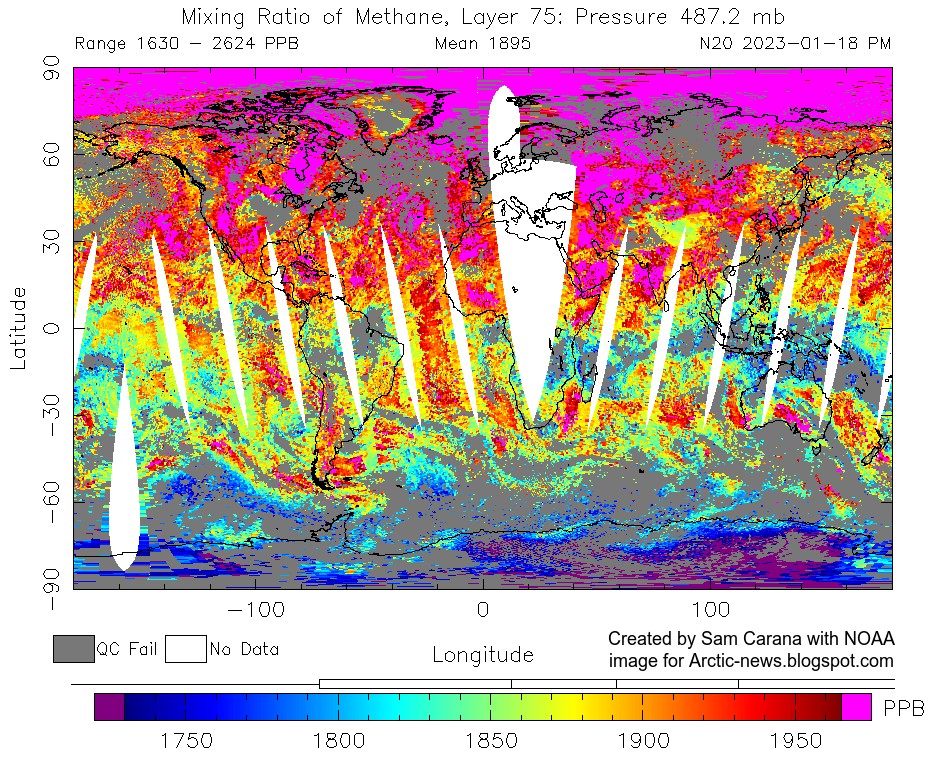
Methane
Ominously, a peak methane level of 2690 ppb was recorded at 487.2 mb by the NOAA 21 satellite on March 31, 2026 AM, as illustrated by the image below.

Could the Northern Hemisphere land-only temperature rise exceed 3°C soon?
The upcoming El Niño could trigger a rapid and steep rise in temperature on land in the Northern Hemisphere, as illustrated by the combination image below that uses land-only data in the top panel and Northern Hemisphere data in the bottom panel.
Arctic sea ice
The upcoming El Niño could trigger a rapid and steep rise in temperature on land in the Northern Hemisphere, as illustrated by the combination image below that uses land-only data in the top panel and Northern Hemisphere data in the bottom panel.
 |
| [ image from earlier post, discussed on facebook here ] |
The image below, adapted from dmi.dk, shows that Arctic sea ice volume was at a record low for the time of year on April 5, 2026.

Climate Emergency Declaration
The situation is dire and unacceptably dangerous, and the precautionary principle necessitates rapid, comprehensive and effective action to reduce the damage and to improve the outlook, where needed in combination with a Climate Emergency Declaration, as described in posts such as in this 2022 post and this 2025 post, and as discussed in the Climate Plan group.

• Keeling Curve - by Scripps Institution of Oceanography at UC San Diego
https://keelingcurve.ucsd.edu
• NOAA - Global Monitoring Laboratory - Carbon Cycle Greenhouse Gases - Mauna Loa, Hawaii
https://gml.noaa.gov/ccgg/trends/mlo.html
• NOAA - Global Monitoring Laboratory - data viewer - Mauna Loa, Hawaii
https://gml.noaa.gov/dv/iadv/graph.php?code=MLO&program=ccgg&type=ts
• NOAA - Office of satellite and product operations - HEAP NUCAPS
https://www.ospo.noaa.gov/products/atmosphere/soundings/heap/nucaps/new/nucaps_products.html
• Broadly stable atmospheric CO2 and CH4 levels over the past 3 million years - by Julia Marks-Peterson et al.
https://www.nature.com/articles/s41586-025-10032-y
and
• Global ocean heat content over the past 3 million years - by Sarah Shackleton et al.
https://www.nature.com/articles/s41586-026-10116-3
discussed on Facebook at:
https://www.facebook.com/groups/arcticnews/posts/10164017885199679
• Danish Meteorological Institute - Arctic sea ice volume and thickness
https://ocean.dmi.dk/arctic/icethickness/thk.uk.php
• Blue Ocean Event
https://arctic-news.blogspot.com/p/blue-ocean-event.html
• The threat of seafloor methane eruptions
https://arctic-news.blogspot.com/2025/11/the-threat-of-seafloor-methane-eruptions.html
• The 2026 El Nino - update March 2026
https://arctic-news.blogspot.com/2026/03/the-2026-el-nino-update-march-2026.html
• Transforming Society
https://arctic-news.blogspot.com/2022/10/transforming-society.html
• Climate Plan
https://arctic-news.blogspot.com/p/climateplan.html
• Climate Emergency Declaration
https://arctic-news.blogspot.com/p/climate-emergency-declaration.html