The image below (top), adapted from NOAA, shows the observed values for the number of sunspots for cycle 25, through August 2024, as well as the values predicted by NOAA (red line).
 |
| [ click on images to enlarge ] |
The above image (bottom) shows the observed values for the F10.7cm radio flux for cycle 25, through August 2024, as well as the values predicted by NOAA (red line).
In July 2025, sunspots are expected to reach the peak of the current solar cycle (number 25). NOAA predicts the maximum number of sunspots for cycle 25 to be 115.3 and radio flux to be 135.8. As the above images show, observed values are already well above the maximum values predicted by NOAA to be reached in July 2025.
 |
| Green dot: NOAA/NASA amplitude prediction. Purple dot: study's amplitude prediction |
These high observations appear to confirm the findings of a 2020 study by Scott McIntosh et al. that, due to interactions with earlier cycles, sunspot Solar Cycle 25 could have a magnitude that rivals the top few since records began (see above image, from the study).
Natural circumstances
Sunspots vary naturally, they are not anthropogenic, i.e. they are part of natural variability that is not part of the global warming that is caused by emissions by people.
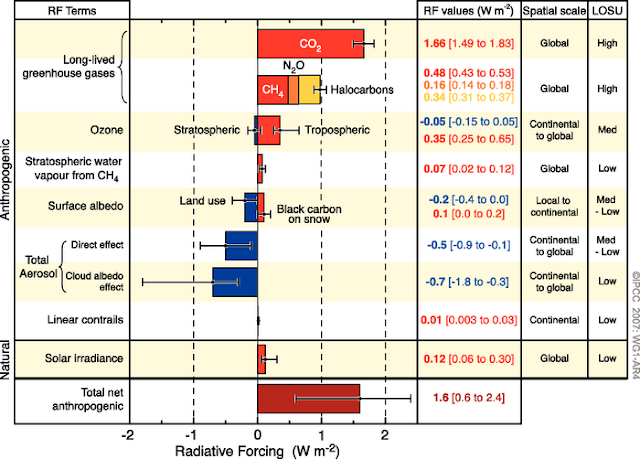
According to above image, from IPCC AR4 SPM, solar irradiance corresponds with a radiative forcing of 0.12 W/m², with a range of 0.06 to 0.3 W/m².
In a 2017 research article, James Hansen et al. say that the variation in forcing is as much as 0.25 W/m⁻² (from solar minimum to solar maximum). The image below, by James Hansen et al. (updated September 1, 2022), indicates that the rise in sunspots forcing from May 2020 to July 2025 could make a difference of more than 0.2 W/m², which would translate into a temperature rise difference of some 0.15°C (or 0.27°F) when using a sensitivity of ¾°C per W/m², as was done in this paper by James Hansen and in this 2021 paper by Hansen and Sato. However, in a recent paper James Hansen et al. conclude that it's better to use 1°C per W/m² forcing, in which case 0.2 W/m² of forcing would translate into a temperature rise of 0.2°C, while 0.25 W/m⁻² of forcing (for the rise from early 2020 to July 2025) would translate into a temperature rise of 0.25°C.
In a 2017 research article, James Hansen et al. say that the variation in forcing is as much as 0.25 W/m⁻² (from solar minimum to solar maximum). The image below, by James Hansen et al. (updated September 1, 2022), indicates that the rise in sunspots forcing from May 2020 to July 2025 could make a difference of more than 0.2 W/m², which would translate into a temperature rise difference of some 0.15°C (or 0.27°F) when using a sensitivity of ¾°C per W/m², as was done in this paper by James Hansen and in this 2021 paper by Hansen and Sato. However, in a recent paper James Hansen et al. conclude that it's better to use 1°C per W/m² forcing, in which case 0.2 W/m² of forcing would translate into a temperature rise of 0.2°C, while 0.25 W/m⁻² of forcing (for the rise from early 2020 to July 2025) would translate into a temperature rise of 0.25°C.

The images at the top show that the current sunspots cycle (25) is stronger than expected. Observed values for January 2023 are already well above the maximum values that NOAA predicted would be reached in July 2025. If this trend continues, the rise in sunspots forcing from early 2020 to July 2025 may well make a difference of more than 0.25°C.
Further circumstances
The danger is that high sunspots could line up with El Niño and further short-term variables, in a cataclysmic alignment that could push up the temperature enough to cause dramatic sea ice loss in the Arctic, resulting in runaway temperature rise by 2026, as an earlier post concluded.
Moving from the bottom of a La Niña to the peak of a strong El Niño could make a difference of more than half a degree Celsius, as discussed in this post. Further forcing could be added by additional natural variability, e.g. the 2022 Tonga submarine volcano eruption did add a huge amount of water vapor to the atmosphere. Since water vapor is a potent greenhouse gas, this is further contributing to speed up the temperature rise. A 2023 study calculates that the submarine volcano eruption near Tonga in January 2022, as also discussed at facebook, will have a warming effect of 0.12 Watts/m² over the next few years.
Such circumstances are mentioned by the IPCC, but because they vary from year to year, they are smoothed out in climate change calculations that average the temperature rise over the course of decades. Nonetheless, when such circumstances all coincide in a cataclysmic alignment, as could be the case soon, the extra rise in temperature from, say, the year 2021 could be as much as 0.25°C + 0.5°C + 0.12°C = 0.87°C. Note that this is an extra rise, not the long-term rise that has already unfolded from pre-industrial.
Links
• NOAA - Space Weather Prediction Center
https://www.swpc.noaa.gov/products/solar-cycle-progression
• A huge temperature rise threatens to unfold soon
• The Termination Event has Arrived - by Tony Phillips
• Overlapping Magnetic Activity Cycles and the Sunspot Number: Forecasting Sunspot Cycle 25 Amplitude - by Scott McIntosh et al. (2020)
• Young people’s burden: requirement of negative CO2 emissions - by James Hansen et al.
https://esd.copernicus.org/articles/8/577/2017
• NOAA - Space Weather Prediction Center
https://www.swpc.noaa.gov/products/solar-cycle-progression
• Cataclysmic Alignment
https://arctic-news.blogspot.com/2022/06/cataclysmic-alignment.html• Overlapping Magnetic Activity Cycles and the Sunspot Number: Forecasting Sunspot Cycle 25 Amplitude - by Scott McIntosh et al. (2020)
• IPCC - Radiative forcing components - from IPCC AR4 WG1 SPM (2007)
• Young people’s burden: requirement of negative CO2 emissions - by James Hansen et al.
https://esd.copernicus.org/articles/8/577/2017
http://www.columbia.edu/~mhs119/Solar
https://arxiv.org/abs/2212.04474
• Dire situation gets even more dire
• Pre-industrial
https://arctic-news.blogspot.com/p/pre-industrial.html