Showing posts with label Polar vortex. Show all posts

Saturday, February 2, 2019

Global Warming is destroying our Liveable Climate

Global Warming is destroying our Liveable Climate. To illustrate what's going on, have a look at the images below, showing low temperatures in Africa at 32°N latitude and high temperatures near Svalbard at about 78°N latitude.

2018 image
2019 image

Surface air temperatures near Svalbard were as high as 5.2°C or 41.4°F near Svalbard on February 3, 2019. At the same time, it was as cold as -3.5°C or 25.6°F in Africa.

The contrast was even more profound on February 4, 2018, when at those same spots it was as cold as -10°C or 13.9°F in Africa, while at the same time it was as warm as 5.8 or 42.4°F near Svalbard.

How is this possible?

As the Arctic warms up faster than the rest of the world, the temperature difference between the North Pole and the Equator narrows, making the jet stream wavier, thus enabling cold air from the Arctic to descend further south, as illustrated by the image on the right, showing instantaneous wind power density at 250 hPa (jet stream) on February 4, 2018.
[ NOAA Climate.gov cartoon by Emily Greenhalgh ]

Furthermore, as oceans get warmer, the temperature difference between land and oceans increases in Winter. This larger temperature difference results in stronger winds that can carry more warm, moist air inland, e.g. into the U.S., as illustrated by the cartoon on the right.

As the jet stream becomes wavier, this also enables more heat to enter the Arctic.

On December 8, 2018, the sea surface temperature near Svalbard was 18.2°C or 32.7°F warmer than 1981-2011. On January 23, 2019, sea surface temperatures at that spot were as high as 18.3°C or 64.9°F, as illustrated by the image on the right, from an earlier post.

A warmer sea surface can cause winds to grow dramatically stronger, and they can push warm, moist air into the Arctic, while they can also speed up sea currents that carry warm, salty water into the Arctic Ocean.

As warmer water keeps flowing into the Arctic Ocean and as air temperatures in the Arctic are now starting to rise on the back of a strengthening El Niño, fears for a Blue Ocean Event are rising.

Rivers can also carry huge amounts of warm water from North America and Siberia into the Arctic Ocean, as these areas are getting hit by ever stronger heatwaves that are hitting the Arctic earlier in the year.

With Arctic sea ice at a low, it won't be able to act as a buffer to absorb heat for long, with the danger that an influx of warm, salty water will reach the seafloor and trigger methane eruptions.

Ominously, the image below shows peak methane levels as high as 2764 ppb on February 2, 2019.


The situation is dire and calls for comprehensive and effective action, as described in the Climate Plan.

See also Dave Borlace's video below:


Links

• How frigid polar vortex blasts are connected to global warming, by Jennifer Francis
https://arctic-news.blogspot.com/2019/02/how-frigid-polar-vortex-blasts-are-connected-to-global-warming.html

• Are record snowstorms proof that global warming isn’t happening?
https://www.climate.gov/news-features/climate-qa/are-record-snowstorms-proof-global-warming-isn%E2%80%99t-happening

• Accelerating growth of carbon dioxide in the atmosphere
https://arctic-news.blogspot.com/2019/01/accelerating-growth-of-carbon-dioxide-in-the-atmosphere.html

• Dangerous situation in Arctic
https://arctic-news.blogspot.com/2018/11/dangerous-situation-in-arctic.html

• Blue Ocean Event
https://arctic-news.blogspot.com/2018/09/blue-ocean-event.html

• Climate Plan
https://arctic-news.blogspot.com/p/climateplan.html

• Extinction
https://arctic-news.blogspot.com/p/extinction.html


Friday, February 1, 2019

How frigid polar vortex blasts are connected to global warming

by Jennifer Francis, Rutgers University

File 20190128 39344 1rjndrb.jpg?ixlib=rb 1.1
Bundled up against the cold in downtown Chicago, Sunday, Jan. 27, 2019.
AP Photo/Nam Y. Huh

A record-breaking cold wave is sending literal shivers down the spines of millions of Americans. Temperatures across the upper Midwest are forecast to fall an astonishing 50 degrees Fahrenheit (28 degrees Celsius) below normal this week – as low as 35 degrees below zero. Pile a gusty wind on top, and the air will feel like -60 F.


Predicted near-surface air temperatures (F) for Wednesday morning, Jan. 30, 2019. Forecast by NOAA’s Global Forecast System model. Pivotal Weather, CC BY-ND
This cold is nothing to sneeze at. The National Weather Service is warning of brutal, life-threatening conditions. Frostbite will strike fast on any exposed skin. At the same time, the North Pole is facing a heat wave with temperatures approaching the freezing point – about 25 degrees Fahrenheit (14 C) above normal.


Predicted near-surface air temperature differences (C) from normal, relative to 1981-2010.
Pivotal Weather, CC BY-ND
What is causing this topsy-turvy pattern? You guessed it: the polar vortex.

In the past several years, thanks to previous cold waves, the polar vortex has become entrenched in our everyday vocabulary and served as a butt of jokes for late-night TV hosts and politicians. But what is it really? Is it escaping from its usual Arctic haunts more often? And a question that looms large in my work: How does global warming fit into the story?


Jimmy Fallon examines the pros and cons of the polar vortex.

Rivers of air

Actually, there are two polar vortices in the Northern Hemisphere, stacked on top of each other. The lower one is usually and more accurately called the jet stream. It’s a meandering river of strong westerly winds around the Northern Hemisphere, about seven miles above Earth’s surface, near the height where jets fly.

The jet stream exists all year, and is responsible for creating and steering the high- and low-pressure systems that bring us our day-to-day weather: storms and blue skies, warm and cold spells. Way above the jet stream, around 30 miles above the Earth, is the stratospheric polar vortex. This river of wind also rings the North Pole, but only forms during winter, and is usually fairly circular.


Dark arrows indicate rotation of the polar vortex in the Arctic; light arrows indicate the location of the polar jet stream when meanders form and cold, Arctic air dips down to mid-latitudes. L.S. Gardiner/UCAR, CC BY-ND
Both of these wind features exist because of the large temperature difference between the cold Arctic and warmer areas farther south, known as the mid-latitudes. Uneven heating creates pressure differences, and air flows from high-pressure to low-pressure areas, creating winds. The spinning Earth then turns winds to the right in the northern hemisphere, creating these belts of westerlies.

Why cold air plunges south

Greenhouse gas emissions from human activities have warmed the globe by about 1.8 degrees Fahrenheit (1 C) over the past 50 years. However, the Arctic has warmed more than twice as much. Amplified Arctic warming is due mainly to dramatic melting of ice and snow in recent decades, which exposes darker ocean and land surfaces that absorb a lot more of the sun’s heat.

Because of rapid Arctic warming, the north/south temperature difference has diminished. This reduces pressure differences between the Arctic and mid-latitudes, weakening jet stream winds. And just as slow-moving rivers typically take a winding route, a slower-flowing jet stream tends to meander.

Large north/south undulations in the jet stream generate wave energy in the atmosphere. If they are wavy and persistent enough, the energy can travel upward and disrupt the stratospheric polar vortex. Sometimes this upper vortex becomes so distorted that it splits into two or more swirling eddies.

These “daughter” vortices tend to wander southward, bringing their very cold air with them and leaving behind a warmer-than-normal Arctic. One of these eddies will sit over North America this week, delivering bone-chilling temperatures to much of the nation.

Deep freezes in a warming world

Splits in the stratospheric polar vortex do happen naturally, but should we expect to see them more often thanks to climate change and rapid Arctic warming? It is possible that these cold intrusions could become a more regular winter story. This is a hot research topic and is by no means settled, but a handful of studies offer compelling evidence that the stratospheric polar vortex is changing, and that this trend can explain bouts of unusually cold winter weather.

Undoubtedly this new polar vortex attack will unleash fresh claims that global warming is a hoax. But this ridiculous notion can be quickly dispelled with a look at predicted temperature departures around the globe for early this week. The lobe of cold air over North America is far outweighed by areas elsewhere in the United States and worldwide that are warmer than normal.


Predicted daily mean, near-surface temperature (C) differences from normal (relative to 1979-2000) for Jan. 28-30, 2019. Data from NOAA’s Global Forecast System model.
Climate Reanalyzer, Climate Change Institute, University of Maine., CC BY-ND
Symptoms of a changing climate are not always obvious or easy to understand, but their causes and future behaviors are increasingly coming into focus. And it’s clear that at times, coping with global warming means arming ourselves with extra scarfs, mittens and long underwear.

Jennifer Francis, Visiting Professor, Rutgers University

This article is republished from The Conversation under a Creative Commons license. Read the original article.


Saturday, March 3, 2018

Warning Signs


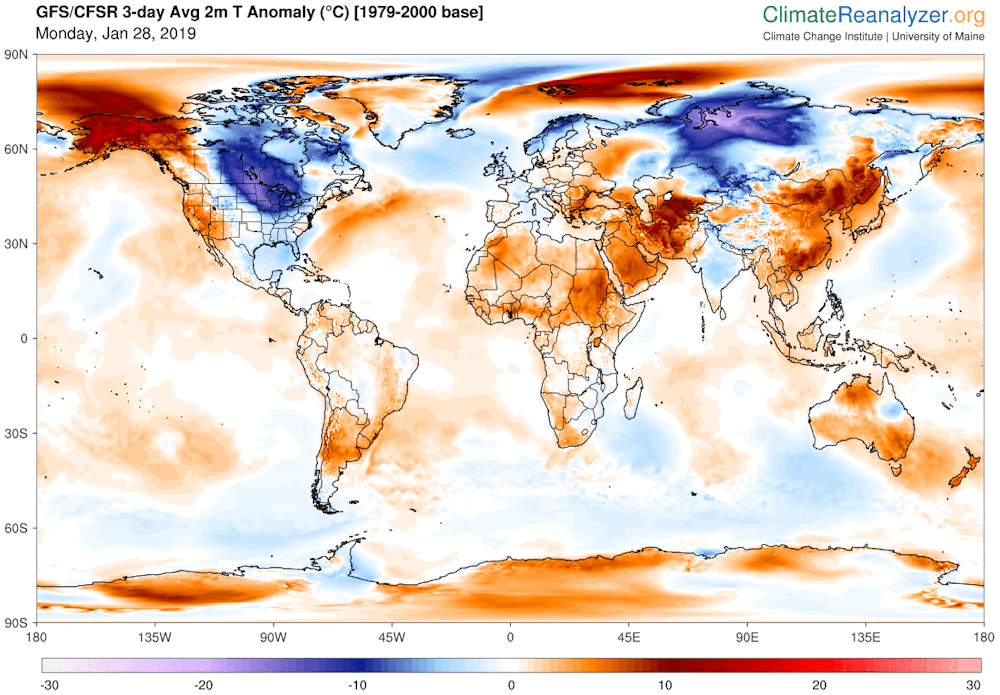
The Arctic is warming up more than twice as fast as the rest of the world, due to numerous feedbacks. At times, large areas over the Arctic Ocean can become 30°C or 54°F warmer than 1979-2000, as illustrated by the image below.


On February 27, 2018, large parts of the Arctic Ocean north of Greenland had turned into open water, as illustrated by the image below.


Yet, while the situation in the Arctic is desperate, with sea ice north of Greenland collapsing and more, mainstream media do not seem to care. If there ever were warning signs of what could eventuate, this is one. The sea ice north of Greenland is typically the thickest, as it is the least affected by melting and can build over many years. Early February 2018, sea ice north of Greenland was up to 5 m thick. To see sea ice this thick getting pushed away and open water emerging north of Greenland in the middle of winter is simply stunning.

For years, I've been warning about the situation in the Arctic, in particular the 'Open Doors Feedback', which is accelerating Arctic warming. Such feedbacks were taken into consideration in an earlier analysis that warned about a potential 1.6°C warming globally due to albedo changes in the Arctic, in combination with associated changes such as loss of the ice buffer (latent heat), more heat transfer from the Atlantic Ocean to the Arctic Ocean due to stronger winds along the path of the Gulf Stream, and more heat entering the atmosphere or remaining in the atmosphere, due to more open water in the Arctic Ocean and as oceans get more stratified and take up less heat from the atmosphere.

So, the current situation doesn't come as a big surprise, but it's stunning to see sea ice collapse north of Greenland.

Back in March 7, 2007, I posted the article 'Ten Dangers of Global Warming', describing events getting progressively worse, with one danger feeding and reinforcing the next one, culminating in panic. Then, I thought that reading that post could at least help people better understand what's going on, and thus help people avoid panicking, but right now, I wonder whether most people do want to understand at all. Anyway, here are some images and words describing what happened over the past few days.

Jet Stream over Arctic Ocean on February 25, 2018

As Arctic warming keeps accelerating, there's ever less temperature difference between the North Pole and the Equator, and this slows down the speed at which the jet stream circumnavigates Earth.

Jet Stream over Arctic Ocean on February 26, 2018
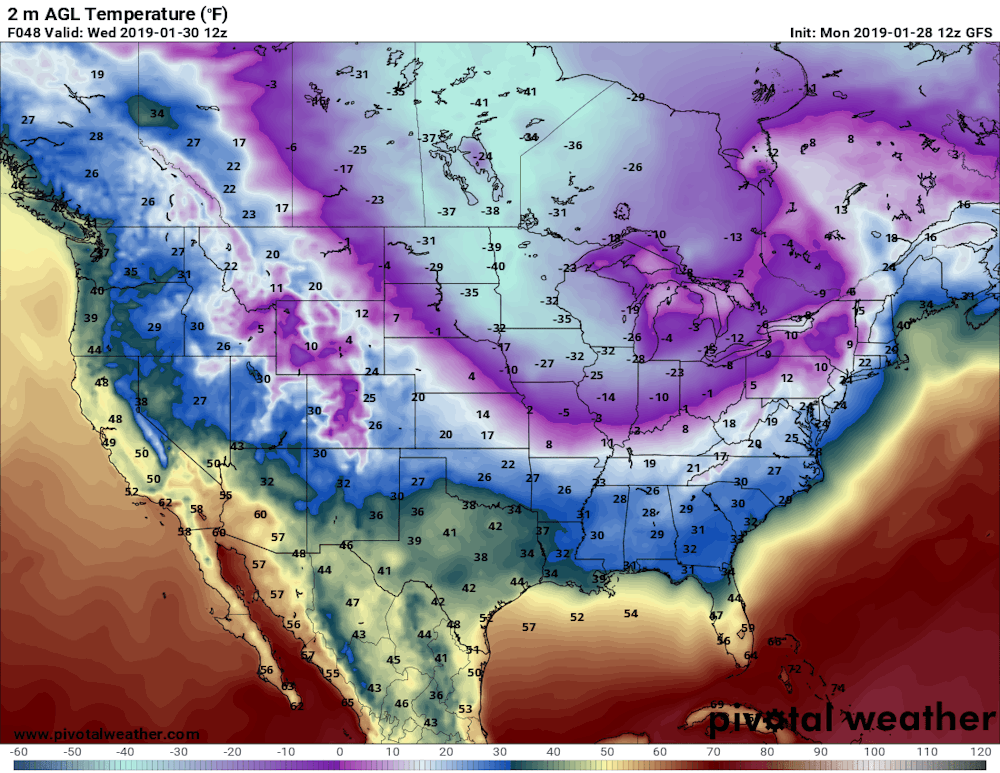
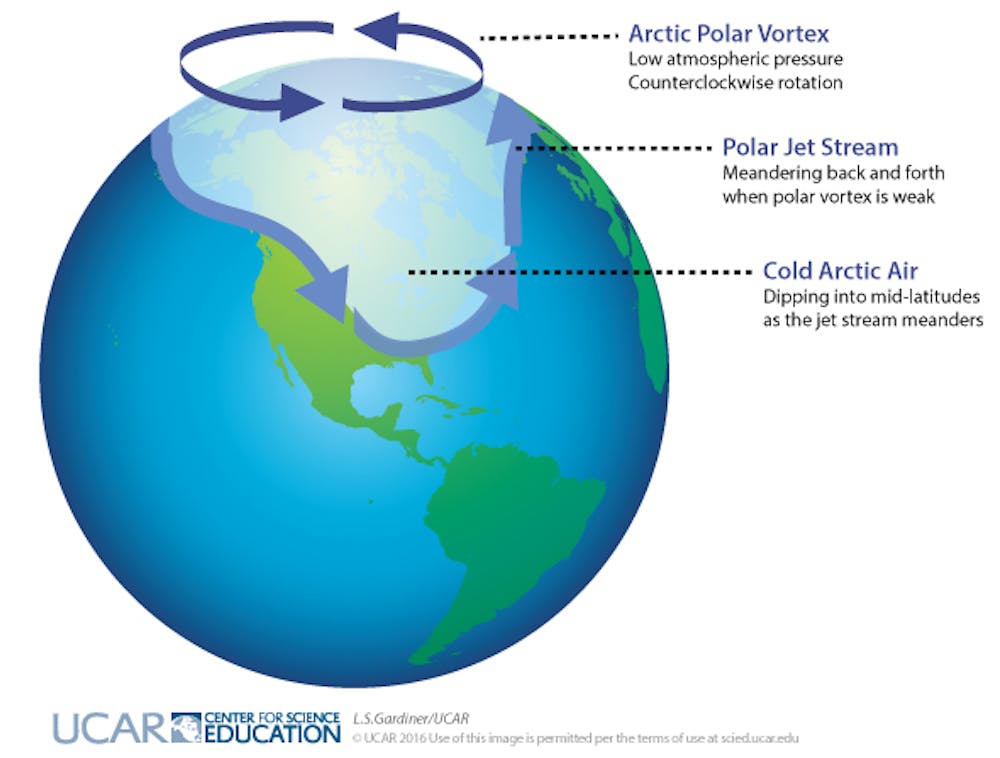
The jet stream is getting more wavy and a more wavy jet stream makes it easier for cold air to move out of the Arctic and for warm air to move into the Arctic, so this 'Open Doors Feedback' is a self-reinforcing feedback that further accelerates warming in the Arctic.

During the northern winter, the Arctic is increasingly getting warmer than North America, Europe and Siberia. This increases the temperature difference between these continents and the oceans, which at times is causing winds to strongly speed up over the North Atlantic and the North Pacific, making an already wavy jet stream extend even further over the Arctic Ocean, reaching areas well beyond the North Pole.

Atmospheric river of heat reaches the North Pole; temperatures were as high as 1.1°C or 34.1°F on February 25, 2018
As the jet stream makes this detour, a huge amount of heat enters the Arctic from the south.

Temperatures above 6°C at Kap Morris Jesup, Greenland's northernmost weather station, on February 25, 2018

These events were preceded by the Polar Vortex splitting up. On February 9, 2018, the Polar Vortex was split up into 4 vortices and reached speeds as fast as 425 km/h or 264 mph.

Polar Vortex split up into 4 vortices
A Sudden Stratospheric Warming event occurred on February 16, 2018, with temperatures reaching as high as 8.9°C or 47.9°F over Hudson Bay.

Polar Vortex splitting up into 4 vortices with a Sudden Stratospheric Warming event occurring on February 16, 2018
The heat that has accumulated in the Arctic Ocean is further illustrated by the February 2018 NASA temperature anomalies image below.


Below is an animation of sea ice thickness, from the Naval Research Laboratory.


Arctic sea ice extent was at record low for the time of the year on February 26, 2018, at 14.159 million km². Arctic sea ice extent typically reaches its maximum in March, but maximum extent in 1991-2000 was reached on February 24. So, there is a chance that Arctic sea ice extent will go all downhill from now on this year.


Zero sea ice volume is within the margins of the trend depicted on the image above on the right. Decline of the snow and ice cover in the Arctic comes with a huge loss in albedo, which means that huge amounts of sunlight that were previously reflected back into space instead get absorbed by the Arctic. Loss of sea ice also means loss of the buffer that until now has consumed huge amounts of heat.

The Buffer has gone, feedback #14 on the Feedbacks page
Peak SST near Svalbard rose from
12.4°C or 55.4°F on Feb 23, 2018,
to 15.6°C or 60°F on Mar 2, 2018.
The danger is that a sudden influx of heat can no longer be absorbed by the sea ice and will instead warm up sediments at the seafloor of the Arctic Ocean that can contain huge quantities of methane in the form of hydrates and free gas.

Destabilization of hydrates can occur in a relatively small area as a result of a relatively small temperature rise. Destabilization comes with a 160 times expansion in volume of the methane, which will send out shock waves that can destabilize nearby hydrates, causing them to destabilize as well, resulting in an eruption of huge quantities of methane over a large area.

Here's another warning sign. Peak sea surface temperature near Svalbard rose from 12.4°C or 55.4°F on February 23, 2018, to 15.6°C or 60°F on March 2, 2018, as illustrated by the red line on the image on the right, with the blue line showing the 1981-2011 average.

And here's another warning sign. High methane releases followed this chain of events on February 27, 2018, pm, likely originating from the seafloor of the East Siberian Arctic Shelf (ESAS).

Methane levels as high as 2892 ppb on February 27, 2018
On March 1, 2018, methane levels as high as 3087 were recorded. Note the solid magenta-colored areas over the ESAS on the image below.


The image below, with measurement by another satellite, shows that methane levels were again very high over the ESAS the next day, i.e. March 2, 2018, confirming earlier indications that this is where the very high methane releases did occur.

As the image below shows, methane levels on March 4, 2018, were still very high, i.e. as high as 2964 ppb.

The image below shows the highest mean global methane readings on March 10 over the years from 2013 through 2018, for selected altitudes corresponding to 945 mb (close to sea level) to 74 mb.

[ click on images to enlarge ]

The table below shows the altitude equivalents in feet (ft), meter (m) and millibar (mb).
57,016 ft44,690 ft36,850 ft30,570 ft25,544 ft19,820 ft14,385 ft 8,368 ft1,916 ft
17,378 m13,621 m11,232 m 9,318 m 7,786 m 6,041 m 4,384 m 2,551 m 584 m
 74 mb 147 mb 218 mb 293 mb 367 mb 469 mb 586 mb 742 mb 945 mb

An earlier analysis calculated that seafloor methane could cause a warming of 1.1°C within one decade. Given a possible additional warming of 2.7°C due to just two elements (i.e. Arctic albedo changes and associated changes, and seafloor methane), a further warming of 2.1°C due to extra water vapor in the warmer atmosphere does seem well possible within a decade. Add up the impact of all warming elements of this analysis and the rise in mean global temperatures from preindustrial could be more than 10°C within one decade, as illustrated by the images below.


A rise of a few degrees Celsius would be devastating, especially when considering that the speed at which such a rise could occur leaves little or no time for plants and animals to adapt, let alone in case of a 10°C rise.


The situation is dire and calls for comprehensive and effective action, as described in the Climate Plan.

Links

• Climate Plan
https://arctic-news.blogspot.com/p/climateplan.html

• Feedbacks in the Arctic
https://arctic-news.blogspot.com/p/feedbacks.html

• Extinction
https://arctic-news.blogspot.com/p/extinction.html

• Ten Dangers of Global Warming
https://arctic-news.blogspot.com/p/ten-dangers-of-global-warming.html

• Methane Erupting From Arctic Ocean Seafloor
https://arctic-news.blogspot.com/2017/03/methane-erupting-from-arctic-ocean-seafloor.html

• Warning of mass extinction of species, including humans, within one decade
https://arctic-news.blogspot.com/2017/02/warning-of-mass-extinction-of-species-including-humans-within-one-decade.html


Monday, February 16, 2015

Climate Changed

Our climate has changed, as illustrated by the image below (Forecast for Feb. 23, 2015, 1200 UTC, run on Feb. 16, 2015).


The left map shows temperatures of 40 degrees below zero moving down into North America from the Arctic, while temperatures in much of Alaska are above freezing point. The right map shows temperature anomalies over large parts of North America at both the top end (red) and the bottom end (purple) of the scale. Temperature anomaly forecasts for the week from Feb 19 to 26, 2015, feature in the video below.


Below is an update showing operational temperature anomalies recorded on February 23, 2015.


As parts of North America experienced record cold, part of Alaska was more than 20°C (36°F)
warmer than it used to be (compared to 1985-1996). And despite the cold weather in parts of Canada and Greenland, the Arctic as a whole is forecast to reach, on February 26, temperature anomalies as much as 3.32°C (6°F) above what temperatures used to be from 1979 to 2000 (Climate Reanalyzer forecast data).

What has caused our climate to change in this way? The image below shows that the jet stream, which once used to move over North America horizontally, has become more wavy, pushing warm air north on the left, while drawing cold air from the Arctic south on the right.


Importantly, while the jet stream is becoming more wavy or elongated vertically, the speed at which it crosses the oceans can increase dramatically. This can be the case where low temperatures over land and high sea surface temperatures combine to create huge temperature differences that drive up the jet stream's speed over oceans.

This is illustrated by the image below showing the Jet Stream reaching speeds as high as 410 km/h (or 255 mph) at the green circle near Greenland on January 9, 2015 (left), and speeds as high as 403 km/h (or 250 mph) at the green circle near Greenland on February 20, 2015 (right).


The reference map on the right shows the location of the continents for the same orthgraphic coordinates as the maps above and below.

Similarly, the Polar Vortex can reach high speeds, driving cold air downward over North America and driving warm air upward over Greenland and the North Atlantic.

The image below shows the Polar Vortex reaching speeds as high as 346 km/h (or 215 mph) at the green circle near Svalbard on January 18, 2015 (left), and speeds as high as 316 km/h (or 196.4 mph) at the green circle over the Arctic Ocean on February 9, 2015 (right).


Almost one year ago, the Polar Vortex also reached speeds as high as 410 km/h (or 255 mph), as discussed in an earlier post. Changes to the polar vortex and the jet stream are caused by emissions, and the situation looks set to deteriorate even further.


Above image illustrates that, on February 16, 2015, waves higher than 10 m (32.81 ft) were recorded off the east coast of North America and south of Iceland, while waves as high as 8.15 m (26.74 ft) were recorded in between Norway and Svalbard.

As above images also illustrate, changed wind patterns are carrying warm air high up into the Arctic.

The air that is moving north is much warmer than it used to be, as sea surface temperatures off the east coast of North America are much higher than they used to be (image left and as discussed in an earlier post).

Strong winds increase the volume of warm water that the Gulf Stream carries into the Arctic Ocean. They can also cause rain storms that can devastate Arctic ice and glaciers

Arctic sea ice currently has about the lowest extent for the time of the year since satellite measurements started in 1979.

The image below shows that, on February 17, 2015, Arctic sea ice had reached an extent of merely 14.406 million square kilometers.

click on image to enlarge
The Arctic sea-ice Monitor image below shows an extent of 13,774,725 km2 for February 18, 2015, with the red line illustrating the recent fall in extent even more dramatically.

Below is a 30-day animation showing sea ice thickness (in m) up to February 22, 2015 (and forecast up to March 2), from the U.S. Naval Research Laboratory.


As the Arctic's snow and ice cover decline, more sunlight gets absorbed that previously was reflected back into space. All this adds up to a very dangerous situation, since huge amounts of methane are contained in sediments under the seafloor of the Arctic Ocean, and they can get destabilized as the water warms up.

In conclusion, feedbacks make that the Arctic is warming more rapidly than the rest of the globe and they threaten to trigger huge methane eruptions from the seafloor of the Arctic Ocean.

Methane concentrations over the Arctic Ocean are very high at the moment. The image below shows the very high peak methane levels that have recently been recorded, against a background image showing high methane levels over the East Siberian Arctic Shelf on February 20, 2015.


The situation is dire and calls for comprehensive and effective action, as discussed at the Climate Plan blog.


Saturday, November 22, 2014

How melting Arctic ice is driving harsh winters

by Nick Breeze

The very least 'global warming' could do for us is to give us warmer winters, right? Wrong, writes Nick Breeze, who met climate scientist and meteorologist Jennifer Francis in his attempt to understand the complex interactions of jet stream, polar vortex, the melting Arctic, and the extreme snowfall that's hitting the northeast US right now.

"Historic" snowfalls have the US northeast this week, with Buffalo, New York under an astonishing 2.4m (8ft) of snow - enough to cause some roofs to cave in under the pressure.

It's just the latest chapter in 2014 unprecedented range of weather extremes - from persistent storms that battered, and flooded much of the UK at the beginning of the year, before going on to record the hottest October since records began.

And in the US, extremes have ranged from California's record drought, to the early snows now under way in the northeast - and let's not forget the 'polar vortex' that hit much of the US in January, bringing Arctic conditions as far south as Texas and Florida, causing flights to be cancelled in Chicago as aviation fuel froze in the -38.3C (-37F) temperatures.


Scientists now have evidence that these persistent extreme weather patterns are increasing in their frequency, due to the rapid heating up of the Arctic that is changing the behaviour of the jet stream, and in turn, the polar vortex.

And Jennifer Francis of Rutgers University, one of the leading US scientists studying the relationship between Arctic warming and changes in the jet stream, believes that it's thanks to 'global warming' that northern hemisphere weather is becoming more extreme - and it's not about to get any better.

Screenshot from Youtube video further below

The 'vast river of wind' that makes our weather

"The Arctic is generally very cold", she told me, "and the areas farther south are warm, and that difference in temperature between those two areas is really what fuels that vast river of wind moving high over our head that we call the jet stream."

"The jet stream in turn creates most of the weather that we feel all around the northern hemisphere and the middle latitudes, so anything that affects this jet stream is going to affect weather patterns. So as the Arctic warms up much faster than the areas farther south, we're seeing this temperature difference between these two regions get smaller."

The result of that, she explains, is that the atmospheric forces driving the jet stream's circular motion are getting smaller - and that means the winds themselves in the jet stream are getting weaker, and moving more slowly.

"When that happens, the jet stream tends to take a wavier path as it travels around the northern hemisphere and those waves are actually what create the stormy patterns and the nice weather patterns. As those waves get larger because of this weakening of those winds of the jet stream, they tend to move more slowly from west to east."

"That means it feels like the weather patterns are sticking around longer, because those patterns are moving much more slowly and this then makes it more likely to have the kind of extreme events that are related to persistent weather patterns."


Are critical findings influencing policy?

These changes in climate have huge implications. As Dr Francis points out, there are "people who worry about whether there is enough fresh water to supply cities, whether there is enough snowpack on mountains to supply reservoirs, and for agriculture ..."

"Drought and agriculture is a big problem. Storminess in certain areas is another big problem. Yes, it has a huge impact for a whole range of issues that affect the way we live."

It's no wonder then that Dr Francis and her colleagues have attracted the attention of President Obama's chief science advisor, Dr John Holdren.

Dr Holdren has been reporting directly to the President on the real time effects of climate change and is keen to understand what this new research tells us about the future impact of changes to the jet stream.

Asked about this sudden interest in her work from the US Presidency, Francis muses thoughtfully. "Yes, we've had a lot of interest from policy makers", she acknowledges.

"I think we're starting to make a lot of progress now in getting policymakers to understand that this is a big problem they have to face ... I think decision makers and the policymakers at the local level get it much better because they're already seeing effects on their local areas.

"Sea level rise is an obvious one. They're already seeing changes in drought and agricultural problems and dealing with fresh water issues. It is really at the local level that we're having more success."

New research supports the case that Arctic sea ice loss is driving climate changes

So to understand the changes in the jet stream it's important to research how the vast atmospheric river of weather above our heads is connected to other climate mechanisms.

"It appears that over the north Atlantic, and towards Asia, there's a mechanism that appears to be quite robust, and several groups have found this mechanism using completely different analysis techniques", says Francis referring to new research by colleagues at the University of Alaska that has emerged in the last couple of months.

"So what we're finding is that there's an area, north of Scandinavia in the Arctic, where the ice has been disappearing particularly rapidly. When that ice disappears ... there is unfrozen ocean underneath, and that ocean absorbs a lot more energy from the sun through the summertime. So it becomes very warm there."

"Then as the fall comes around, all that heat that's been absorbed all summer long, where the ice has retreated, is put back in the atmosphere and that creates a big bubble of hot air ... over that region where the ice was lost."

And in turn, that goes on to disrupt the circumpolar winds whose behaviour determines much the weather across the northern hemisphere.

The gigantic bubble of warm air "tends to create a northward bulge in the jet stream", and in turn, "that creates a surface high pressure area that circulates in the clockwise direction. That sucks cold air down from the Arctic over northern Eurasia, and that creates a southward dip in the jet stream."


The bulging jet stream disrupts the polar vortex

"So what we're getting is this big northward bulge up over Scandinavia and a southward dip over Asia ... creating, first the tendency for a larger wave in the jet stream, which tends to move more slowly, but also we're seeing this mechanism that creates these colder winters that have been observed over Central Asia."

"Once the jet stream gets into this wavier pattern, it sends wave energy up into the highest levels of the atmosphere, which is called the stratosphere, where we have the polar vortex, which is kind of similar to the jet stream but it's much higher up in the atmosphere and it travels much faster."

"So as that wave energy gets sent up from this larger wave below, up into the stratosphere, it breaks down that polar vortex so that it becomes wavier as well. That wavier polar vortex sends energy back down to the lower atmosphere and it creates an even wavier jet stream in February."

"So we're seeing this connection of mechanisms that starts with Arctic sea ice loss and it makes a wavier jet stream for different reasons all the way through winter."

Will the jet stream continue to cause changes in climate?

By identifying these mechanisms and linking them back directly to loss of the Arctic sea ice, Dr Francis and her colleagues are demonstrating how man-made global warming is creating feedbacks that are changing the climate conditions in the northern hemisphere - and not for the better.

It may be counterintuitive, and it when it first happened it took scientists by surprise - but now it looks like this is one of the most important ways in which 'global warming' is hitting North America. Melting ice in the Arctic Ocean is indirectly pushing frigid Arctic air south across the continent, creating the perfect conditions for massive snowfall.

Which is all very well ... but what's coming next? "We are using these climate models, or computer simulations ... to try and project what we're expecting to see happen in the future, as greenhouse gases continue to increase.

"The early indications are that these large wavy patterns in the jet stream are going to become more frequent in the future, as far as we can tell. It is preliminary research that I haven't published yet but it does look as if they are going to increase."


Nick Breeze is a film maker and writer on climate change and other environmental topics. He has been interviewing a range of experts relating to the field of climate change and science for over four years. These include interviews with Dr James Hansen, Professor Martin Rees, Professor James Lovelock, Dr Rowan Williams, Dr Natalia Shakhova, Dr Michael Mann, Dr Hugh Hunt, among others.

Additional articles can also be read on his blog Envisionation.

Jennifer Francis is a research professor at the Institute of Marine and Coastal Sciences at Rutgers University, where she studies Arctic climate change and the link between Arctic and global climates. She has authored more than 40 peer-reviewed publications on these topics. She was also the co-founder of the Rutgers Climate and Environmental Change Initiative.

Article earlier posted at TheEcologist.org


Related


Friday, May 16, 2014

More extreme weather can be expected


The heaviest rains and floods in 120 years have hit Serbia and Bosnia this week, Reuters and Deutsche Welle report.

The animation below shows the Jet Stream's impact on the weather. Cold temperatures have descended from the Arctic to Serbia and Bosnia in Europe and all the way down to the Gulf of Mexico in North America, while Alaska, California, and America's East Coast are hit by warm temperatures. In California, 'unprecedented' wildfires and fierce winds lead to 'firenadoes', reports CNN.

Saturday, February 15, 2014

Extreme weather strikes around the globe - update

As the weather gets more extreme, disaster strikes around the globe. The Guardian reports three people killed as storms continue to batter southern UK. The Vancouver Sun reports that a U.S. Northeast snowstorm kills 25. And the Sacramento Bee reports Six dead and 1,000 injured in fresh Japan snow storm.

What is the story behind these extreme weather events? The image below tells the story. The Arctic has been much warmer than it used to be, due to numerous feedbacks that accelerate warming in the Arctic. This reduces the temperature differential between the Arctic and lower latitudes, which changes the Jet Stream and Polar Vortex, in turn making the weather at many places ever more extreme.

 earlier forecasts by cci-reanalyzer.org
Above image illustrates the situation, showing an Arctic Ocean that is warmer than the higher latitudes of the Asian and North American continents.

Arctic sea ice has meanwhile reached record lows, as illustrated by the image below.


The situation can be expected to get even worse. The image below shows sea ice extent, as measured by the NSIDC, which is one day ahead compared to above image.


Below, two regular contributors to the Arctic-news blog comment on the situation.

Monday, February 10, 2014

Extreme weather strikes around the globe

  Editorial note: this post has meanwhile been updated as
Extreme weather strikes around the globe update.


As the weather gets more extreme, disaster strikes around the globe.

Here's a snapsnot from today's news. In London, the BBC reports, flooded homes along the River Thames are being evacuated and thousands more are at risk. In Japan, reports Reuters, eleven people died, more than a thousand were injured and tens of thousands lost power when the worst snowstorm in decades hit Tokyo and areas around the Japanese capital before heading north to blanket the tsunami-hit Pacific coast. Many countries in the Middle East were hit by snow. The BBC reports that heavy snow in northern Iran has left around 480,000 homes without power and some towns and villages cut off.

What is causing these extreme weather events? The image below tells the story. While at times it has been cold at many places around the world, when averaged over the past 30 days, temperatures around the globe have actually been several degrees higher than they used to be. The Arctic has been hit hardest, with anomalies as high as 21°C over this 30 day period. This affects the Jet Stream and Polar Vortex, which in turn is making the weather ever more extreme.


The situation is further illustrated by the cci-reanalyzer.org forecasts below.


And while the sea ice didn't look too bad at the start of the year, growth has meanwhile stopped, as illustrated by the image below.


Added below are two videos by Paul Beckwith, further discussing the situation.


Editor's note: Reanalysis of temperature anomaly Jan 12 - Feb 10, 2014.
Meanwhile, I've added another image (above), created with NOAA's reanalysis, which compares temperatures to a larger dataset, and the colors look a lot different, so NOAA may indeed have mixed the colors up somewhat in the initial image, as Albert suggested at the Facebook discussion (click on image below).

Anyway, the point made in the post remains, i.e. that as global warming continues, warming in the Arctic accelerates more rapidly than at lower latitudes, which weakens the polar vortex and jet stream in a self-reinforcing feedback that causes the Arctic to warm up even further compared with lower latitudes.

As said, the situation calls for comprehensive and effective action, as discussed at the Climate Plan blog.