
Note: This page was created in 2016 - for an update, see the pre-industrial page
Calculating the temperature rise from 1750 to 2016

 The image on the right, an early Paleomap by Chris Scotese, shows average temperatures during warm and cool periods over the past 2 billion years. The average temperature over the past 400,000 was about 11°C. The Paleomap shows that the typical temperature in a cool period is 12°C, while the typical temperature in a warm period is 22°C, i.e. a difference of 10°C.
The image below, from an earlier post, shows that temperatures moved up and down by roughly 10°C (18°F) between glacial and inter-glacial phases of ice ages, in line with the Milankovitch cycles, which made temperatures go up and down between 16°C and 6°C over the past 400,000 years (image below).
The average global temperature in 1966 was about 14°C. Without emissions by people, the temperature in 1966 would have been somewhat lower, and the temperature would have been falling, had it not been for emissions by people which instead made the average global temperature go up to about 15°C in 2016.
As the image below also shows, rises of some 100 ppm in the level of carbon dioxide in the atmosphere and of some 300 ppb in the level of methane in the atmosphere go hand in hand with a rise in temperature of some 10°C. In other words, it looks like high levels of greenhouse gases in the atmosphere have already locked in an upcoming temperature rise of 10°C, i.e. a further rise of 10°C is already baked into the cake (ed.: see also the Global warming in the pipeline, by James Hansen et al., 2022).
Indeed, temperatures look set to go well beyond any of the peaks in the Milankovitch cycles over the past 400,000 years. If average temperatures were to rise from 1750 to 2026 by 8.1°C (details below), they would reach a level virtually unprecedented in the entire history of Earth.

The extinction page describes the elements contributing to such a potential temperature rise of more than 8.1°C from 1750. Note that this 8.1°C rise would come on top of the temperature rise that already occurred due to emissions caused by people from pre-industrial to 1750.

Below follow some links and calculations used to obtain the figures in above image.
How much warming have emissions by people caused between pre-industrial and 2016?
In 1951-1980 (i.e. 1966 ±15 years or NASA's default baseline), the temperature was 14°C (57.20°F).
In 1900, it was 13.72°C (56.70°F), assuming that temperatures had risen by 0.28°C from 1900 to the baseline of 1951-1980, as the trend line below indicates (from an earlier post).

In 1750, it was 13.42°C (56.16°F), as discussed in an earlier post, assuming that the rise from 1750 to the baseline of 1951-1980 was 0.58°C.
Note that emissions by people did already cause temperatures to rise before 1750, as discussed at the pre-industrial page.
Different ways to calculate the rise from 1750
The above 0.58°C for the rise from 1750 to 1951-1980 can be calculated in a number of ways, such as:
- By using 0.3°C for the rise from 1750 to 1900, and adding 0.28°C for rise 1900 to 1951-1980.
- Or, by using 0.29°C for the rise from 1750 to 1900, and adding 0.29°C for rise 1900 to 1951-1980.
 |
| 1. Rise 1951-1980 to 2015 |
In 2015 (Jan-Dec), the temperature was 0.85°C above the 1951-1980 baseline (as the top image on the right shows). Using this figure, it was 14.85°C (58.73°F) in 2015.
 |
| 2. Rise 1951-1980 to 2016 |
In 2016 (Jan-Dec), it was 1.00°C above baseline (as illustrated by image 2., captured in January 2017). Using this figure, the temperature was 15.00°C (59.00°F) in 2016.
In 2026, it could be 23.10°C (73.62°F) if temperatures were to rise by a further 8.10°C (i.e. from 2016 to 2026). A monthly peak could take the temperature up even higher, to 23.44°C (or, more than 10°C above 1750). In case the clouds tipping point got crossed, the temperature could rise by an additional 8°C, as discussed at the clouds feedback page.
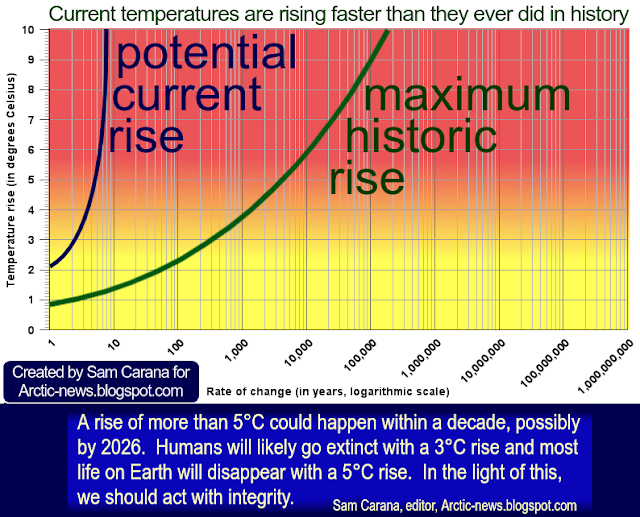
Such temperatures would be hotter than it has been for 500 million years. Note also that the high temperatures during mass extinctions were reached gradually over many years, whereas the current rise threatens to reach such a peak in just ten years time. Up to 96% of all marine species and 70% of terrestrial vertebrate species became extinct when temperatures rose by 8 °C (14 °F) during the Permian-Triassic extinction, or the Great Dying, 252 million years ago. During the Paleocene/Eocene Thermal Maximum (PETM), which occurred 55 million years ago, global temperatures rose by 5°C in ~13 years.
Next to the size of the temperature rise, the rate of change is also important.
 |
| [ image added later, from a 2022 post ] |
 |
| 3. Rise 1890-1910 to 1951-1980 |
In 1966 (i.e. 1951-1980, NASA's default baseline), the temperature was 14°C (57.20°F) and in 2016, it was about 15°C.
Global Temperature Rise (images 3., 4. and 5.)
3. Global rise 1890-1910 to 1951-1980 (0.29°C)
 |
| 4. Rise 1890-1910 to 2016 |
In 1900, the temperature was 0.29°C (0.522°F) below the temperature in 1966, or rather below the 1890-1910 temperature, as the top NASA image on the right shows. Using above figures would make the temperature in 1900 13.71°C (56.68°F) or about 1.28°C below the temperature in 2016.
Next step. To get the full rise from 1750 to 2016, the rise from 1750 to 1900 must be added. How much was the rise from pre-industrial (1750) to 1900?
 |
| 5. Rise 1951-1980 to 2016 |
Had people not raised greenhouse gas levels, temperatures would also have been a bit lower due to a natural fall in line with the Milankovitch cycles, which would have made temperatures a bit lower than what they were in 1900.
 |
| 6. Land-only rise 1890-1910 to 1951-1980 |
The temperature rise from 1900 to 2016 is about 1.28°C, so the full temperature rise 1750 to 2016 is 1.58°C, i.e. well above the aspirational guideline of the Paris Agreement. Further calculations follow below.
 |
| 7. Land-only rise 1890-1910 to 2016 |
4. Global rise 1890-1910 to 2016 (1.26°C)
The NASA image (image 4.) on the right shows that in 2016, it was 1.26°C warmer than in 1900 ±10 years (or 1890-1910).
Adding 1.26°C to the above 13.71°C would make the temperature in 2016 14.97°C.
5. Global rise 1951-1980 to 2016 (0.99°C)
 |
| 8. Land-only rise 1890-1910 to 2016 |
 |
| 9. February rise 1890-1910 to 1951-1980 |
Temperature Rise on Land (images 6., 7. and 8.)
Below are the same images, but instead of the global temperature rise, they show temperature for the land-only rise.
6. Land rise 1890-1910 to 1951-1980 (0.39°)
The land-only temperature rise from 1890-1910 to 1951-1980 was 0.39°C, according to the NASA image on the right (image 6. on the right).
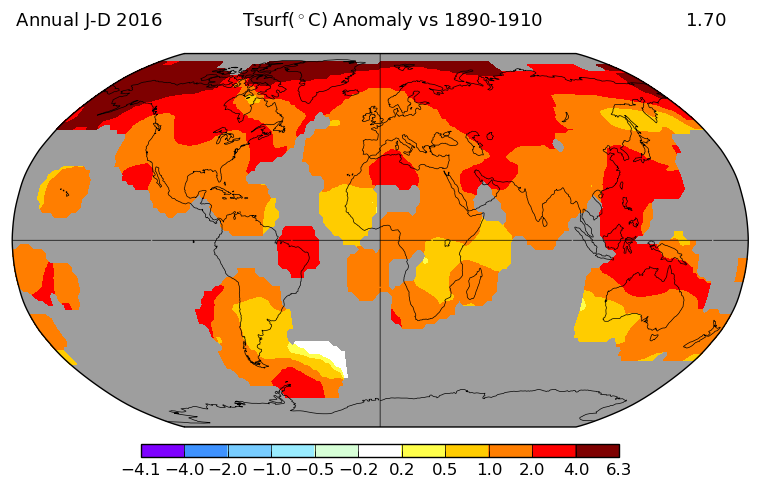
7. Land rise 1890-1910 to 2016 (1.7°C)
 |
| 10. February rise 1951-1980 to February 2016 |
8. Land rise 1951-1980 to 2016 (1.23°)
The land-only rise from 1951-1980 to 2016 was 1.23°C, according to the NASA image on the right (image 8. on the right).
 |
| 11. February rise 1890-1910 to February 2016 |
This 1.57°C is well above the 1.5°C guardrail set by the Paris Agreement. The rise was even more for the monthly average for February 2016, as discussed below. Furthermore, the temperature rise from 1750 to 2016 on land was 2°C or more, depending on what calculations are used. And of course, monthly peak rise on land was even more.
Peak global monthly temperature rise (images 9., 10. and 11.)
 |
| 12. February land rise 1890-1910 to February 1951-1980 |
Global peak monthly temperature anomalies were very high in February 2016.
9. Global February rise 1890-1910 to 1951-1980 (0.33°C)
The global February temperature in 1951-1980 was 0.33°C higher compared to 1890-1910.
10. Global rise 1951-1980 to February 2016 (1.33°C)
 |
| 13. February land rise 1951-1980 to February 2016 |
11. Global rise 1890-1910 to February 2016 (1.68°C)
The monthly temperature anomaly in February 2016 was 1.68°C compared to 1890-1910.
February land monthly temperature anomaly (images 12., 13. and 14.)
 |
| 14. February land rise 1890-1910 to February 2016 |
12. Land February rise 1890-1910 to 1951-1980 (0.5°C)
The land-only February temperature in 1951-1980 was 0.5°C higher compared to 1890-1910.
13. February land rise 1951-1980 to February 2016 (1.63°C)
The land-only monthly temperature anomaly in February 2016 was 1.63°C compared to 1951-1980.
14. Land rise 1890-1910 to February 2016 (2.32°C)
The land-only monthly temperature anomaly in February 2016 was 2.32°C compared to 1890-1910.
 |
| 15. Land December 2017 anomaly from 1890-1910 |
15. Land rise December 2017 from 1890-1910 (1.63°C)
The land-only monthly temperature anomaly in December 2017 was 1.63°C compared to 1890-1910.
The anomaly is even higher when looking at temperatures on land on the Northern Hemisphere only and when taking pre-industrial as baseline.
Links
• Climate Plan
https://arctic-news.blogspot.com/p/climateplan.html
• Pre-industrial
https://arctic-news.blogspot.com/p/pre-industrial.html
• Extinction page
https://arctic-news.blogspot.com/p/extinction.html
• How much warming have humans caused?
http://arctic-news.blogspot.com/2016/05/how-much-warming-have-humans-caused.html
• Mean methane levels reach 1800 ppb
http://arctic-news.blogspot.com/2013/06/mean-methane-levels-reach-1800-ppb.html
• NASA, The Elusive Absolute Surface Air Temperature (SAT)
http://data.giss.nasa.gov/gistemp/faq/abs_temp.html
• NASA, decadal temperature
http://earthobservatory.nasa.gov/Features/WorldOfChange/decadaltemp.php
• Horizontal graph by Chris Scotese
https://science.nasa.gov/science-news/science-at-nasa/2000/ast20oct_1
• The original vertical graph by Chris Scotese from the wayback machine
http://web.archive.org/web/20000823191223im_/http://www.scotese.com/images/globaltemp.jpg
• August 2016 another month above Paris Agreement guardrail
http://arctic-news.blogspot.com/2016/09/august-2016-another-month-above-paris-agreement-guardrail.html
• The Paleocene-Eocene Thermal Maximum (PETM)
https://www.wunderground.com/climate/PETM.asp
• Permian-Triassic extinction, or the Great Dying
1 comment:
The Climate Plan calls for comprehensive action through multiple lines of action implemented across the world and in parallel, through effective policies such as local feebates. The Climate Plan calls for a global commitment to act, combined with implementation that is preferably local. In other words, while the Climate Plan calls for a global commitment to take comprehensive and effective action to reduce the danger of catastrophic climate change, and while it recommends specific policies and approaches how best to achieve this, it invites local communities to decide what each works best for them, provided they do indeed make the progress necessary to reach agreed targets. This makes that the Climate Plan optimizes flexibility for local communities and optimizes local job and investment opportunities.
Click for more on multiple lines of action, on recommended policies, and on the advantages of feebates.
New comments are not allowed.