Many people could face unbearable temperatures soon.
Temperature anomalies on land in the Northern Hemisphere (red) are spread out much wider and they are more than 0.5°C higher than global land+ocean anomalies (blue).
Temperature anomalies on land in the Northern Hemisphere (red) are spread out much wider and they are more than 0.5°C higher than global land+ocean anomalies (blue).

The pale green and grey trends are both long-term trends based on January 1880-August 2020 NOAA data. The short-term red and blue trends, based on January 2013-August 2020 NOAA data, are added to show the potential for a rapid rise. How could temperatures possibly rise this fast?
A rapid temperature rise could eventuate by 2026 due to a number of contributing factors:
• crossing of the latent heat and methane tipping points
• moving toward an El Niño
• entering solar cycle 25
• changes in aerosols
• feedbacks kicking in more strongly as further tipping points get crossed.
Crossing the Latent Heat and Methane Hydrate Tipping Points
The image below, updated from an earlier post, shows two such tipping points.

The August 2020 ocean temperature anomaly on the Northern Hemisphere was 1.13°C above the 20th century average. The image shows a trend based on January 1880-August 2020 NOAA data. The latent heat tipping point is estimated to be 1°C above the 20th century average. Crossing the latent heat tipping point threatens to cause the methane hydrates tipping point to be crossed, estimated to be 1.35°C above the 20th century average.
Keep in mind that above images show temperature anomalies from the 20th century average, which is NOAA's default baseline. As an earlier analysis points out, when using a 1750 baseline and when using ocean air temperatures and higher Arctic anomalies, we may have already crossed both the 1.5°C and the 2°C thresholds that politicians at the Paris Agreement pledged would not get crossed.
Keep in mind that above images show temperature anomalies from the 20th century average, which is NOAA's default baseline. As an earlier analysis points out, when using a 1750 baseline and when using ocean air temperatures and higher Arctic anomalies, we may have already crossed both the 1.5°C and the 2°C thresholds that politicians at the Paris Agreement pledged would not get crossed.
Natural Variability - El Niño and Solar Cycle
Currently, we are currently in a La Niña period, which suppresses air temperatures.
Only a thin layer of sea ice remained left in the Arctic, with extent almost as low as it was in 2012 around this time of year, as discussed in the previous post. As air temperatures dropped in September 2020, Arctic sea ice extent started to increase again about September 15, 2020. This made that a patch of sea ice remained present at the surface of the Arctic Ocean, despite the dramatic thinning of the sea ice.
Only a thin layer of sea ice remained left in the Arctic, with extent almost as low as it was in 2012 around this time of year, as discussed in the previous post. As air temperatures dropped in September 2020, Arctic sea ice extent started to increase again about September 15, 2020. This made that a patch of sea ice remained present at the surface of the Arctic Ocean, despite the dramatic thinning of the sea ice.
When an El Niño event returns, conditions will get worse.

How long will it take before we'll reach the peak of the upcoming El Niño? NOAA says:
El Niño and La Niña episodes typically last nine to 12 months, but some prolonged events may last for years. While their frequency can be quite irregular, El Niño and La Niña events occur on average every two to seven years. Typically, El Niño occurs more frequently than La Niña.
The temperature rise is strongest in the Arctic, as illustrated by the zonal mean temperature anomaly map below. The map has latitude on the vertical axis and shows anomalies as high as 4.83°C or 8.69°F in the Arctic. The North Pole is at the top of the map, at 90° North, the Equator is in the middle, at 0°, and the South Pole is at the bottom, at -90° South. And yes, NASA's default baseline is 1951-1980, so anomalies are even higher when using a 1750 baseline.

So, what could make the difference next year is an upcoming El Niño. Solar irradiance is also on the rise, in line with the 11-year Solar Cycle.

Above image shows a NOAA graph depicting the current Solar Cycle (24) and the upcoming Solar Cycle (25).

In 2019, Tiar Dani et al. analyzed a number of studies and forecasts pointing at the maximum in the upcoming Solar Cycle occurring in the year 2023 or 2024.
The analysis found some variation in intensity between forecasts, adding images including the one on the right, which is based on linear regression and suggests that the Solar Cycle 25 may be higher than the previous Solar Cycle 24.
In 2012, Patrick (Pádraig) Malone analyzed factors critical in forecasting when an ice-free day in the Arctic sea first might occur.
Patrick concluded that once solar activity moved out of the solar minimum, Arctic sea ice extent would start to crash. Accordingly, a Blue Ocean Event could occur as early as 2021, as illustrated by the image below.
Patrick concluded that once solar activity moved out of the solar minimum, Arctic sea ice extent would start to crash. Accordingly, a Blue Ocean Event could occur as early as 2021, as illustrated by the image below.

Further Tipping Points and Feedbacks
Further tipping points and feedbacks can start kicking in more strongly as one tipping point gets crossed. At least ten tipping points apply to the Arctic, as discussed in an earlier post and it looks like the latent heat tipping point has already been crossed.
Ocean heat is very high in the North Atlantic and the North Pacific, and heat continues to enter the Arctic Ocean.

Arctic sea surface temperatures and air temperature are now high since ocean heat, previously consumed by sea ice, is now coming to the surface where the sea ice has disappeared.

As above image shows, sea surface temperature anomalies in the Arctic Ocean on September 14, 2020, were as high as 9.3°C or 16.8°F (at the location marked by green circle), compared to the daily average during the years 1981-2011.
Part of this ocean heat is rising into the atmosphere over the Arctic Ocean, resulting in high air temperatures that in turn prevent formation of sea ice thick enough to survive until the next melting season. The image on the right shows a forecast of Arctic air temperatures (2 m) that are 5°C higher than 1979-2000 (forecast for October 5, 2020, 18Z run Sep 26, 2020 06Z).
Methane Danger is High

Ominously, peak methane levels of 2762 parts per billion (ppb) were recorded by the MetOp-1 satellite on the morning of September 20, 2020, at 586 milibar (mb), as above image shows.

Mean methane levels of 1925 ppb were recorded by the MetOp-1 satellite on the morning of September 20, 2020, at 293 mb, as above image shows.

Peak methane levels of 2813 ppb were recorded by the MetOp-1 satellite on the afternoon of September 30, 2020, at 469 mb, as above image shows.


Methane has been rising most at higher altitudes over the past few years. On September 26, 2020 pm, the MetOp-1 satellite recorded a mean global methane level of 1929 ppb at 293 mb, which is equivalent to a height of 9.32 km or 30,57 ft, i.e. in the lower stratosphere over the North Pole (the top of the troposphere over the Equator is higher, at about 17 km).
Why methane is so important
As illustrated by the image on the right, from an earlier post, high methane levels could be reached within decades, and such a scenario could unfold even without sudden big bursts, but merely due to a continuation of a trend based on data up to 2014. This would obviously result in a huge rise in global temperature.
A huge rise in global temperature would eventuate even earlier in case of a big burst of methane erupting from the seafloor of the Arctic Ocean.
A huge rise in global temperature would eventuate even earlier in case of a big burst of methane erupting from the seafloor of the Arctic Ocean.
How high are current methane levels? NOAA's May 2020 level for methane was 1874.7 ppb.
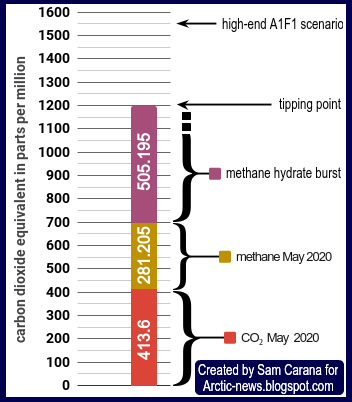
Using a GWP of 150, this translates into 1.8747 x 150 = 281.205 ppm CO₂e.
NOAA's figures are conservative, given that NOAA measures methane at marine surface level.
NOAA's figures are conservative, given that NOAA measures methane at marine surface level.
Anyway, when using this conservative NOAA methane figure of 1874.7 ppb which at a GWP of 150 results in 281.205 ppm CO₂e, and when using an additional 413.6 ppm for recent carbon dioxide levels (NOAA's global May 2020 CO₂ level), these two add up to 694.805 ppm CO₂e, which is 505.195 CO₂e away from the cloud feedback tipping point (1200 CO₂e) that can, on its own, raise global temperatures instantly by 8°C.
This is illustrated by the image on the right, an update from an earlier post.
This is illustrated by the image on the right, an update from an earlier post.
 An additional eruption of methane from the Arctic Ocean into the atmosphere of 505.195 CO₂e translates into 505.195 / 150 = 3.368 ppm or 3368 ppb of methane.
 If the current amount of methane in the atmosphere is about 5 Gt, then 3368 ppb of methane corresponds with an amount of methane just under 9 Gt.
Coincidently, a peak level of 3369 ppb was recorded on August 31, 2018, pm. Granted, there is a large difference between a local peak level and a global mean level, but then again, a much smaller burst of methane can trigger the clouds feedback.
Even a relatively small burst of methane could trigger the clouds feedback, given that it will cause huge heating of the Arctic both directly and indirectly, in turn triggering further eruptions of methane from the seafloor of the Arctic Ocean.
Huge direct heating of the Arctic could occur due to methane's high immediate GWP and its even higher Local Warming Potential (LWP) given that the release takes place in the Arctic, while huge indirect heating of Arctic would occur due to the resulting decline of sea ice and of much of the permafrost on land.
Even a relatively small burst of methane could cause not only albedo losses but also releases of carbon dioxide, methane and nitrous oxide and further fast feedbacks such as a rise in clouds and water vapor, especially over the Arctic Ocean, as illustrated by the image on the right, from the extinction page and an earlier post.
Importantly, the initial trigger to a huge temperature rise by 2026 could be an event that is typically categorized under natural variability, such as an El Niño, increased solar irradiance or a storm causing a sudden large influx of hot, salty water into the Arctic Ocean and causing an eruption of seafloor methane. Indeed, a seemingly small forcing can result in total collapse that takes place so rapidly that any political action will be too little, too late.
The video below illustrates the importance of the Precautionary Principle. The video shows how a seemingly small bump by a forklift causes all shelves in a warehouse to collapse.
The situation is dire and calls for immediate, comprehensive and effective action, as described in the Climate Plan.
Links
• NOAA Global Climate Report - August 2020
https://www.ncdc.noaa.gov/sotc/global/202008
• Multivariate El Niño/Southern Oscillation (ENSO) Index Version 2 (MEI.v2)
https://www.ncdc.noaa.gov/sotc/global/202008
• Multivariate El Niño/Southern Oscillation (ENSO) Index Version 2 (MEI.v2)
https://oceanservice.noaa.gov/facts/ninonina.html
• NASA zonal mean anomalies
https://data.giss.nasa.gov/gistemp/zonal_means/index.html
• NASA zonal mean anomalies
https://data.giss.nasa.gov/gistemp/zonal_means/index.html
• NOAA ISIS Solar Cycle Sunspot Number Progression
• Multiple regression analysis predicts Arctic sea ice - by Patrick Malone (Pádraig) Malone
https://www.facebook.com/Amber.and.Patrick/posts/1140053003062976
https://www.facebook.com/Amber.and.Patrick/posts/1140053003062976
https://iopscience.iop.org/article/10.1088/1742-6596/1231/1/012022
• A rise of 18°C or 32.4°F by 2026?
• Methane Hydrates Tipping Point threatens to get crossed
https://arctic-news.blogspot.com/2020/08/methane-hydrates-tipping-point-threatens-to-get-crossed.html
• Arctic Hit By Ten Tipping Points
https://arctic-news.blogspot.com/2020/04/arctic-hit-by-ten-tipping-points.html
• Crossing the Paris Agreement thresholds
https://arctic-news.blogspot.com/p/crossing.html
• 2°C crossed
https://arctic-news.blogspot.com/2020/03/2c-crossed.html
• NOAA - Trends in Artmospheric Methane
• Trends in Atmospheric Carbon Dioxide - global
• When will we die?
• Methane Hydrates Tipping Point threatens to get crossed
https://arctic-news.blogspot.com/2020/08/methane-hydrates-tipping-point-threatens-to-get-crossed.html
• Arctic Hit By Ten Tipping Points
https://arctic-news.blogspot.com/2020/04/arctic-hit-by-ten-tipping-points.html
• Crossing the Paris Agreement thresholds
https://arctic-news.blogspot.com/p/crossing.html
• 2°C crossed
https://arctic-news.blogspot.com/2020/03/2c-crossed.html
• Most Important Message Ever
• Blue Ocean Event
https://arctic-news.blogspot.com/2018/09/blue-ocean-event.html
• Record Arctic Warming
https://arctic-news.blogspot.com/2018/09/blue-ocean-event.html
• Record Arctic Warming
https://arctic-news.blogspot.com/2016/04/record-arctic-warming.html
• Warning of mass extinction of species, including humans, within one decade
• Warning of mass extinction of species, including humans, within one decade
https://arctic-news.blogspot.com/2017/02/warning-of-mass-extinction-of-species-including-humans-within-one-decade.html
• Extinction
https://arctic-news.blogspot.com/p/extinction.html
• Climate Plan
https://arctic-news.blogspot.com/p/climateplan.html
• Extinction
https://arctic-news.blogspot.com/p/extinction.html
• Climate Plan
https://arctic-news.blogspot.com/p/climateplan.html


