Arctic sea ice area
Arctic sea ice area has been at a record daily low since the start of February 2025.

Arctic sea ice area was 1.34 million km² lower on March 19, 2025, compared to March 19, 2012. The comparison with the year 2012 is important, since Arctic sea ice area reached its lowest minimum in 2012. Arctic sea ice area was only 2.24 million km² on September 12, 2012, i.e. 1.24 million km² above a Blue Ocean Event.
The size of the sea ice can be measured either in extent or in area. What is the difference between sea ice area and extent? Extent is the total region with at least 15% sea ice cover. Extent can include holes or cracks in the sea ice and melt ponds on top of the ice, all having a darker color than ice. Sea ice area is the total region covered by ice alone.
Blue Ocean Event (BOE)
A Blue Ocean Event (BOE) occurs when the size of the sea ice falls to 1 million km² or less, which could occur in Summer 2025 in the Northern Hemisphere for Arctic sea ice. If the difference between 2012 and 2025 continues to be as large as it is now, there will be a Blue Ocean Event in September 2025.
A BOE is often defined as crossing a tipping point that is crossed when sea ice reaches or falls below 1 million km² in extent. However, it make more sense to look at sea ice area, rather than at sea ice extent, since sea ice area is a more critical measure in regard to albedo. Loss of sea ice area (and thus of albedo) is a self-reinforcing feedback that causes the temperature to rise, resulting in further melting of sea ice and thus further accelerating the temperature rise.
A BOE occurs when the size of the sea ice falls to 1 million km² or less, which could occur in Summer 2025 in the Northern Hemisphere for Arctic sea ice. Arctic sea ice area was only 1.24 million km² above a BOE on September 12, 2012. If the difference between 2012 and 2025 continues to be as large as it is now, there will be a BOE in September 2025.
Arctic sea ice volume and thickness
Volume and thickness are two further measures to assess the health of Arctic sea ice, and they are critical in regard to the latent heat buffer, which decreases as sea ice, permafrost and glaciers disappear.
Latent heat is energy associated with a phase change, such as the energy consumed when ice turns into water. During a phase change, the temperature remains constant. As long as there is ice, additional heat will be absorbed by the process of ice turning into water, so the temperature doesn't rise at the surface.
The amount of energy absorbed by melting ice is as much as it takes to heat an equivalent mass of water from zero to 80°C. The energy required to melt a volume of ice can raise the temperature of the same volume of rock by as much as 150ºC.
Warmer water flowing into the Arctic Ocean causes Arctic sea ice to lose thickness and thus volume, diminishing its capacity to act as a buffer that consumes ocean heat entering the Arctic Ocean from the North Atlantic. This means that - as sea ice thickness decreases - a lot of incoming ocean heat can no longer be consumed by melting the sea ice from below, and the heat will therefore contribute to higher temperatures of the water of the Arctic Ocean. Similarly, there is a point beyond which thawing of permafrost on land and melting of glaciers can no longer consume heat, and all further heat will instead warm up the surface.

Warmer water flowing into the Arctic Ocean causes Arctic sea ice to lose thickness and thus volume, diminishing its capacity to act as a buffer that consumes ocean heat entering the Arctic Ocean from the North Atlantic. This means that - as sea ice thickness decreases - a lot of incoming ocean heat can no longer be consumed by melting the sea ice from below, and the heat will therefore contribute to higher temperatures of the water of the Arctic Ocean. Similarly, there is a point beyond which thawing of permafrost on land and melting of glaciers can no longer consume heat, and all further heat will instead warm up the surface.
 |
| [ from earlier post ] |
 |
| [ Arctic sea ice volume, click to enlarge ] |
The image on the right shows that Arctic sea ice volume has been at a record daily low for more than a year, reflecting loss of the latent heat buffer.
Loss of the latent heat buffer constitutes a tipping point. Beyond a certain point, further ocean heat arriving in the Arctic Ocean from the Atlantic Ocean and the Pacific Ocean will no longer be able to be consumed by melting sea ice from below.
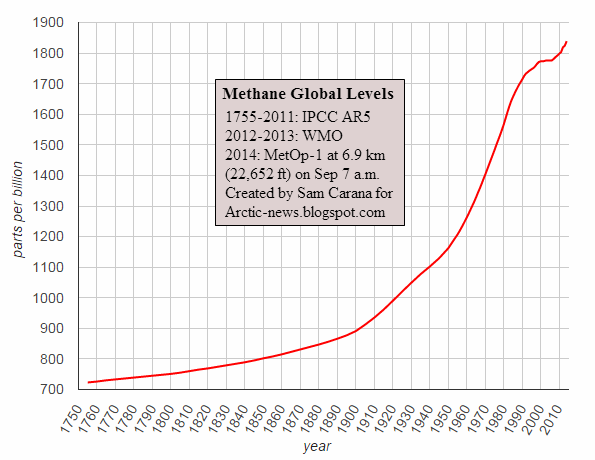
Further incoming heat therefore threatens to instead reach the seafloor of the Arctic Ocean and destabilize methane hydrates contained in sediments at the seafloor, resulting in eruptions of huge amounts of methane, in turn threatening increased loss of permafrost, resulting in additional emissions, as illustrated by the above image.
The danger is especially large in the East Siberian Arctic Shelf (ESAS), which contains huge amounts of methane and which is hit strongly by the temperature rise. The image below shows that high February 2025 sea surface temperature anomalies are present in the Arctic Ocean, including over ESAS.

The bathymetry map in the right panel of above image shows how shallow seas in the Arctic Ocean can be. The water over the ESAS is quite shallow, making that the water can warm up very quickly during summer heat peaks and heat can reach the seafloor, which comes with the risk that heat will penetrate cracks in sediments at the seafloor. Melting of ice in such cracks can lead to abrupt destabilization of methane hydrates contained in sediments.
 |
| [ from earlier post, click on images to enlarge ] |
Large abrupt methane releases will quickly deplete the oxygen in shallow waters, making it harder for microbes to break down the methane, while methane rising through waters that are shallow can enter the atmosphere very quickly.
The situation is extremely dangerous, given the vast amounts of methane present in sediments in the ESAS, given the high global warming potential (GWP) of methane immediately following its release and given that over the Arctic there is very little hydroxyl in the air to break down the methane.
 |
| [ from earlier post ] |
High temperatures
On March 20, 2025, the temperature was 14.29°C (57.72°F), an anomaly of 0.78°C (1.4°F) above 1991-2020 and the highest daily temperature on record for this day of the year. It is significant that this record was reached despite the presence of La Niña conditions that suppress the temperature.

ENSO variations (El Niño/La Niña/neutral) are indicated by the color of the shading. El Niño and La Niña are opposite phases of a natural climate pattern across the tropical Pacific Ocean that swings back and forth every 3-7 years on average, so a period of three years can suffice to reflect this pattern. The graph covers a period of roughly 3 years (end 2022 to end 2025) and is based on 829 daily data (December 13, 2022, to March 20, 2025).
Both trends indicate acceleration of the temperature rise, despite the presence of La Niña conditions. The black trend is a straight line, while the red non-linear trend can bend and thus follow short-term variables more closely, such as ENSO variations (El Niño/La Niña) and sunspots, and it can also warn that further mechanisms can jointly speed up the temperature rise very rapidly, as discussed in many earlier posts such as this one.

NOAA doesn't expect a new El Niño to emerge soon (image above), which makes it even more significant that temperature anomalies currently are this high. One of the mechanisms that is pushing up temperatures is albedo loss, partly due to low sea ice. The image below shows that the global sea ice area has been at a record daily low since the start of February 2025. The associated albedo loss constitutes an important self-reinforcing feedback mechanism accelerating the temperature rise.

Meanwhile, the Northern Hemisphere reached a temperature of 12.32°C on March 14, 2025, a record daily high and 1.59°C higher than 1979-2000.
A recent analysis led by James Curran concludes that the rate of natural sequestration of CO₂ from the atmosphere by the terrestrial biosphere peaked in 2008. Natural sequestration is now declining by 0.25% per year. A recent analysis led by Rongbo Dai concludes that phytoplankton is reduced due to ocean acidification and stratification.
Concentration of CO₂ in the atmosphere will rise as sinks turn into sources. Furthermore, more emissions can be expected from seafloor methane hydrate eruptions, from thawing permafrost, from flooded areas, and from fires (including fires in forests, peatland, grassland, urban waste in backyards and landfills, and fires in buildings - especially warehouses that contain flammable materials, chemicals and fluorinated gases). Mechanisms that are accelerating the temperature rise are discussed in this earlier post.

A recent analysis led by Joseph Williamson concludes that many species that live together appear to share remarkably similar thermal limits. That is to say, individuals of different species can tolerate temperatures up to similar points. This is deeply concerning as it suggests that, as ecosystems warm due to climate change, species will disappear from an ecosystem at the same time rather than gradually, resulting in sudden biodiversity loss. It also means that ecosystems may exhibit few symptoms of heat stress before a threshold of warming is passed and catastrophic losses occur.
A recent analysis led by Thiago Gonçalves-Souza concludes that species turnover does not rescue biodiversity in fragmented landscapes.

Ominously, very high temperature anomalies are forecast over the Arctic Ocean for November 2025.
 |
| [ Very high temperature anomalies forecast over Arctic Ocean, from earlier post ] |
Further mechanisms accelerating the temperature rise
Concentration of CO₂ in the atmosphere will rise as sinks turn into sources. Furthermore, more emissions can be expected from seafloor methane hydrate eruptions, from thawing permafrost, from flooded areas, and from fires (including fires in forests, peatland, grassland, urban waste in backyards and landfills, and fires in buildings - especially warehouses that contain flammable materials, chemicals and fluorinated gases). Mechanisms that are accelerating the temperature rise are discussed in this earlier post.
Human extinction at 3°C
If the temperature does indeed keep rising rapidly, the anomaly compared to pre-industrial may soon be higher than 3°C, implying that humans are already functionally extinct, especially if no decisive, comprehensive and effective action is taken.
Analysis by Shona and Bradshaw (2019) finds that, due to co-extinction, global biodiversity collapse occurs at around 5°C heating, as discussed in this 2019 post. The post adds the warning that a rise of more than 5°C could happen within a decade, possibly by 2026, and that humans who depend on many other species will likely go extinct with a 3°C rise.
Analysis by Shona and Bradshaw (2019) finds that, due to co-extinction, global biodiversity collapse occurs at around 5°C heating, as discussed in this 2019 post. The post adds the warning that a rise of more than 5°C could happen within a decade, possibly by 2026, and that humans who depend on many other species will likely go extinct with a 3°C rise.
Climate Emergency Declaration
The situation is dire and the precautionary principle calls for rapid, comprehensive and effective action to reduce the damage and to improve the situation, as described in this 2022 post, where needed in combination with a Climate Emergency Declaration, as discussed at this group.

Links
• Kevin Pluck - seaice.visuals.earth
https://seaice.visuals.earth
• NSIDC - What is the difference between sea ice area and extent?
https://nsidc.org/learn/ask-scientist/what-difference-between-sea-ice-area-and-extent
https://nsidc.org/learn/ask-scientist/what-difference-between-sea-ice-area-and-extent
• Albedo, latent heat, insolation and more
https://arctic-news.blogspot.com/p/albedo.html
• Feedbacks
https://arctic-news.blogspot.com/p/feedbacks.html
• Heat flux forecast to enter Arctic early February 2025
https://arctic-news.blogspot.com/2025/01/heat-flux-forecast-to-enter-arctic-early-february-2025.html
• Danish Meteorological Institute - daily temperature Arctic
https://ocean.dmi.dk/arctic/meant80n.uk.php
• Danish Meteorological Institute - Arctic sea ice volume and thickness
https://ocean.dmi.dk/arctic/icethickness/thk.uk.php
• Arctic and Antarctic Data Archive System (ADS) of the National Institute of Polar Research of Japan
https://ads.nipr.ac.jp
• Copernicus
https://pulse.climate.copernicus.eu
• NOAA - ENSO: Recent Evolution, Current Status and Predictions (17 March 2025)
https://www.cpc.ncep.noaa.gov/products/analysis_monitoring/lanina/enso_evolution-status-fcsts-web.pdf
• NOAA - El Niño and La Niña: Frequently asked questions
https://www.climate.gov/news-features/understanding-climate/el-ni%C3%B1o-and-la-ni%C3%B1a-frequently-asked-questions
• Sunspots
https://arctic-news.blogspot.com/p/sunspots.html
• Sunspots
https://arctic-news.blogspot.com/p/sunspots.html
• Climate Reanalyzer
https://climatereanalyzer.org
• Natural sequestration of carbon dioxide is in decline: climate change will accelerate - by James Curran et al.
https://rmets.onlinelibrary.wiley.com/doi/10.1002/wea.7668
https://climatereanalyzer.org
• Natural sequestration of carbon dioxide is in decline: climate change will accelerate - by James Curran et al.
https://rmets.onlinelibrary.wiley.com/doi/10.1002/wea.7668
discussed on facebook at:
• Eukaryotic phytoplankton drive a decrease in primary production in response to elevated CO₂ in the tropical and subtropical oceans - by Rongbo Dai et al. discussed on facebook at:
• University of Bremen - sea ice
https://seaice.uni-bremen.de/start
• Tropical Tidbits
https://www.tropicaltidbits.com
• When will we die?
https://arctic-news.blogspot.com/2019/06/when-will-we-die.html
• Species turnover does not rescue biodiversity in fragmented landscapes - by Thiago Gonçalves-Souza et al.
https://www.nature.com/articles/s41586-025-08688-7
discussed on facebook at:
https://www.facebook.com/groups/arcticnews/posts/10162452301209679
• Transforming Society
https://arctic-news.blogspot.com/2022/10/transforming-society.html
• Climate Plan
https://arctic-news.blogspot.com/p/climateplan.html
• Climate Emergency Declaration
https://arctic-news.blogspot.com/p/climate-emergency-declaration.html
• Transforming Society
https://arctic-news.blogspot.com/2022/10/transforming-society.html
• Climate Plan
https://arctic-news.blogspot.com/p/climateplan.html
• Climate Emergency Declaration
https://arctic-news.blogspot.com/p/climate-emergency-declaration.html
For comments and discussion of this post on facebook, click below.


