|
| [ click on images to enlarge ] |
Differences between datasets are mainly due to the ways temperatures are measured, e.g. ERA5 measures the temperature of the air above oceans, whereas NASA and NOAA measure the surface temperature of the water, which is lower. There can also be differences in how temperatures are measured in areas with sea ice - the sea ice can be measured, or the water underneath the sea ice, or the air above the sea ice. Also, in some areas there once was sea ice that has meanwhile disappeared. Different ways of measuring things can raise the temperature record by as much as 0.2°C and even more in case of earlier years, where the margin of error is also larger.
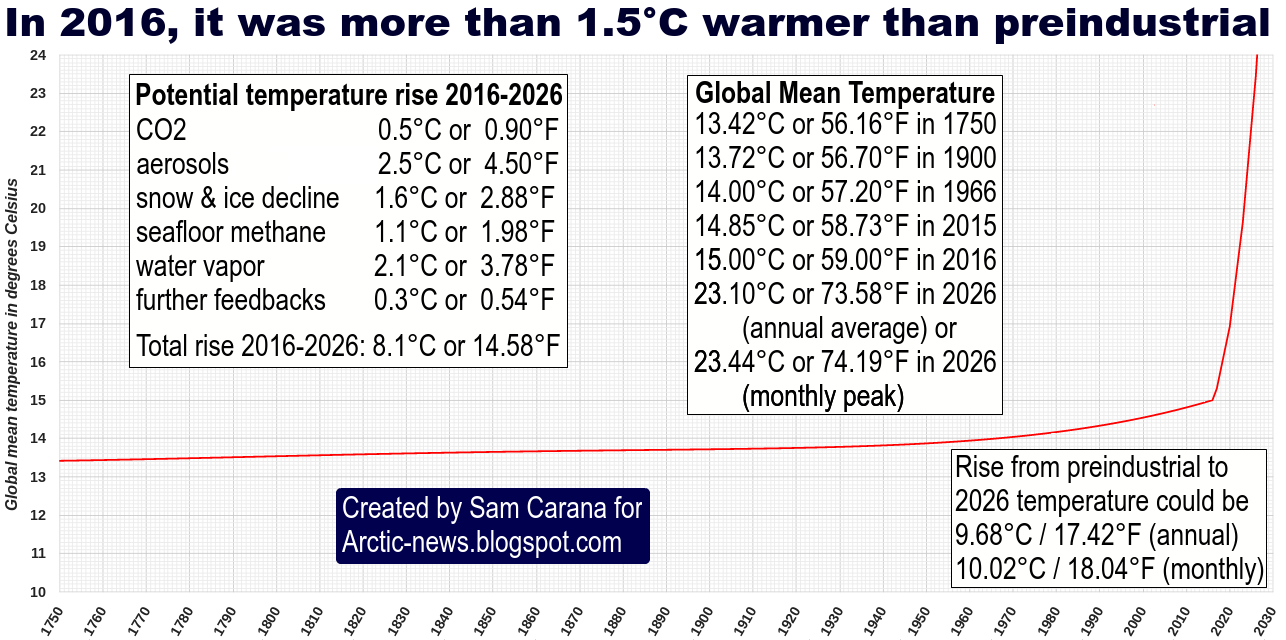
Importantly, the temperature rise in the above image is compared to the period 1850-1900, which is not pre-industrial. When using a genuinely pre-industrial base, the temperature anomaly may already have been above the 2°C threshold in 2015, when politicians at the Paris Agreement pledged that this threshold wouldn't be crossed.
Importantly, the temperature rise in the above image is compared to the period 1850-1900, which is not pre-industrial. When using a genuinely pre-industrial base, the temperature anomaly may already have been above the 2°C threshold in 2015, when politicians at the Paris Agreement pledged that this threshold wouldn't be crossed.
 |
| [ from earlier post ] |
“Individual years pushing past the 1.5 degree limit do not mean the long-term goal is shot", UN Secretary-General Antóno Guterres says: “It is important to emphasize that a single year of more than 1.5°C for a year does NOT mean that we have failed to meet Paris Agreement long-term temperature goals, which are measured over decades rather than an individual year", WMO Secretary-General Celeste Saulo adds.
However, for this argument to hold, the average anomaly would need to fall to under 1.5°C from now. Should we really have to wait for another decade or two, before a confirmation is allowed to be issued that 1.5°C has been crossed. Isn't such a mandate part of downplaying how dire the situation is, an effort to delay the necessary action? Moreover, does such a mandate make sense?
 |
| [ click on images to enlarge ] |
 |
| [ for more background, also view the Extinction page ] |
To illustrate this point, the above image uses NASA anomalies (blue dots) that are conservatively compared to NASA's default 1951-1980 base, with data going back to 2010. The image thus shows a 30-year review period centered around January 1, 2025. Eight imaginary years of data have been added beyond existing data, extending the trend into the future (yellow dots). The wide pink trend is based on both NASA existing data and these imaginary data, jointly covering data from 2010-2032. The narrow black trend is not based on imaginary data, it is purely based on existing data, from 2010-2024, showing the potential for such a trend to eventuate when using existing (i.e. past) data only.
In case such a trend would indeed eventuate, confirmation of the crossing of the 1.5°C threshold should NOT be delayed until all the years of a 30-year period have been entirely completed. In fact, 2°C (vs 1951-1980) would already be crossed early 2026. In the course of 2032, a 16°C rise would be reached, while the average anomaly for the period 2010-2032 would be higher than 3°C (vs 1951-1980) with still 7 years to go before the 30-year period would be completed.
Warnings about the potential for such a rise have been sounded before, e.g. see the extinction page and the update of the image below with daily data and added trends.
 |
| [ Temperature anomaly with ENSO shading, trends added, click on images to enlarge ] |
While La Niña conditions are definitely present in January 2025, the La Niña is expected to be short-lived. Temperatures are typically suppressed during La Niña. Despite temperatures being suppressed, the global surface air temperature reached 13.28°C on January 24, 2025, the highest temperature on record for the time of year, according to ERA5 data. Temperatures keep rising, as indicated by the trends added to the data, despite La Niña. Will a new El Niño emerge in the course of 2025?
Human extinction at 3°C
Analysis by Shona and Bradshaw (2019) finds that, due to co-extinction, global biodiversity collapse occurs at around 5°C heating, as discussed in this 2019 post. The post adds the warning that a rise of more than 5°C could happen within a decade, possibly by 2026, and that humans who depend on many other species will likely go extinct with a 3°C rise.

A recent study by Joseph Williamson et al. finds that many species that live together appear to share remarkably similar thermal limits. That is to say, individuals of different species can tolerate temperatures up to similar points. This is deeply concerning as it suggests that, as ecosystems warm due to climate change, species will disappear from an ecosystem at the same time rather than gradually, resulting in sudden biodiversity loss. It also means that ecosystems may exhibit few symptoms of heat stress before a threshold of warming is passed and catastrophic losses occur.
Antarctic sea ice
Antarctic sea ice is losing thickness, as illustrated by the images below, showing thickness from August 27, 2024, to January 21, 2025.

 |
| [ click on images to enlarge ] |
Measuring polar temperatures
As mentioned above, different ways of measuring polar temperatures can lead to different results. The combination image below illustrates that using a different smoothing radius for Arctic measurements can result in different anomalies. Gray areas signify missing data. Ocean data are not used over land nor within 100 km of a reporting land station.


The above image raises the question as to what caused the low anomalies over Greenland and Baffin Bay, compared to the rest of the Arctic. This could be caused by changes to wind and ocean currents.
Changes to wind and ocean currents
While the wind overall is strengthening, the wind mainly appears to be strengthening in latitudinal directions. The Coriolis Effect contributes to that, but strengthening of latitudinal winds appears to be getting stronger over the years. Loss of sea ice at the poles comes with loss of albedo, a self-reinforcing feedback that contributes to polar amplification of the temperature rise, which contributes to the reasons why longitudinal wind is not strengthening as much as latitudinal wind.
Polar amplification of global warming narrows the difference in temperature between the Equator and the Poles, which results in a relative slowing down of the speed at which heat flows from the Equator to the poles (longitudinal wind). This causes changes in both wind patterns and ocean currents, such as deformation of the Jet Stream, slowing down of the Atlantic meridional overturning circulation (AMOC), and changes in ocean currents around Antarctica that carry heat from the Southern Ocean closer to Antarctica and from there to the deeper ocean.
Polar amplification of global warming narrows the difference in temperature between the Equator and the Poles, which results in a relative slowing down of the speed at which heat flows from the Equator to the poles (longitudinal wind). This causes changes in both wind patterns and ocean currents, such as deformation of the Jet Stream, slowing down of the Atlantic meridional overturning circulation (AMOC), and changes in ocean currents around Antarctica that carry heat from the Southern Ocean closer to Antarctica and from there to the deeper ocean.

Deformation of the Jet Stream can cause cold air from the Arctic to descend deep over the continents.
 |
| [ temperature of -37°C in Colorado ] |
Very low North American temperatures occurred, while sea surface temperatures kept increasing. Such conditions can strongly increase the temperature difference between land and sea, especially during the northern summer. This can in turn further strengthen latitudinal wind.
On January 25, 2025 07:00 UTC, wind at 250 hPa (Jet Stream) at the green circle is forecast to reach a speed of 401 km/h and wind power density of 271.3 kW/m².
 |
| [ strong wind over the North Atlantic, click on images to enlarge ] |
While such conditions vary with the weather, all such mechanisms can contribute to strengthening wind speed, especially in latitudinal directions, as illustrated by the image below.

The above image shows the wind speed anomaly in December 2024 at 250 hPa (Jet Stream). The image below shows how this keeps cold air in December 2024 at 250 hPa over elevated land in the Arctic in place, thus keeping temperatures low over Greenland and Baffin Island.

As temperatures rise, stronger horizontal (latitudinal) wind will result in more heat accumulating in the Atlantic ocean, the Pacific Ocean and the Indian Ocean.
At times, though, wind can abruptly and dramatically strengthen in vertical (longitudinal) direction. This can be facilitated by geological features, e.g. in the North Atlantic, there is an easy pathway northward from the Gulf of Mexico to the Arctic Ocean. At times, the wind and ocean currents along this path can be accelerated by weather conditions such as storms and hurricanes.
At times, though, wind can abruptly and dramatically strengthen in vertical (longitudinal) direction. This can be facilitated by geological features, e.g. in the North Atlantic, there is an easy pathway northward from the Gulf of Mexico to the Arctic Ocean. At times, the wind and ocean currents along this path can be accelerated by weather conditions such as storms and hurricanes.

As an example, the above image shows a forecast for February 2, 2025 12Z, of strong wind at 250 hPa over the North Atlantic. The image below shows a forecast for February 2, 2025 12Z, of temperature anomalies.

As temperatures rise, a lot of heat is accumulating in the North Atlantic and at its surface. Much of that heat can be pushed abruptly into the Arctic by strong longitudinal wind, accompanied by sudden acceleration of the Gulf Stream and its extension northward. Accordingly, this can cause a huge temperature peak in the Arctic. Similar hazards apply to the water and sea ice around Antarctica.
The impact of extreme weather events can be missed in climate models that average away peaks in temperature and wind strength. However, wind peaks can contribute to massive storm damage, flooding and fire hazards. The joint impact of high temperature peaks and high humidity can cause fatal heat stress. High temperatures and strong wind can also cause a sudden decline of sea ice that can contribute to cause huge amounts of methane to erupt abruptly from the seafloor, in turn contributing strongly to temperature rises that are not foreseen in many climate models.
Arctic sea ice
Meanwhile, ocean heat keeps increasing, resulting in melting of sea ice from below. The image below shows Arctic sea ice extent through January 19, 2025.
 |
| [ Arctic sea ice extent, click on images to enlarge ] |
During the first few months of the year, Arctic sea ice is still growing in extent. In the above image, the red line and red marker shows 2025 sea ice extent. Dots mark Arctic sea ice extent on January 19 for the respective year and Arctic sea ice extent was at a record low for the time of year on January 19, 2025, despite La Niña conditions.
A new El Niño may emerge in the course of 2025, while both Arctic sea ice extent and volume are at record low, while numerous self-reinforcing feedbacks are kicking in with accelerating ferocity and while further mechanisms drive up temperatures such as high sunspots. Such a combination of mechanisms could cause a huge temperature rise and a Blue Ocean Event in 2025, threatening huge amounts of methane to erupt from the seafloor.
 |
| [ Northern Hemisphere sea surface temperature anomaly, click to enlarge] |
 |
| [ Arctic sea ice volume, click on images to enlarge] |
The above image shows a green circle south of Svalbard with a 5.1°C sea surface temperature on January 18, 2025, 3.4°C higher than 1981-2011.
High ocean temperatures result in low Arctic sea ice volume, as illustrated by the image on the right and as discussed in this earlier post.
Guy McPherson discussed the consequences of an ice-free Arctic Ocean in the video below, adding that "a near-term, ice-free Arctic Ocean—the so-called Blue Ocean Event—is the extinction-causing event over which we have the least control. The rate of environmental change in the wake of such an event will suffice to cause the extinction of all life on Earth.
I’m not a fan."
Climate Emergency Declaration
The situation is dire and the precautionary principle calls for rapid, comprehensive and effective action to reduce the damage and to improve the situation, as described in this 2022 post, where needed in combination with a Climate Emergency Declaration, as discussed at this group.

Links
• WMO confirms 2024 as warmest year on record at about 1.55°C above pre-industrial level
https://wmo.int/news/media-centre/wmo-confirms-2024-warmest-year-record-about-155degc-above-pre-industrial-level
https://www.metoffice.gov.uk/about-us/news-and-media/media-centre/weather-and-climate-news/2025/2024-record-breaking-watershed-year-for-global-climate
• Berkeley Earth - Global Temperature Report for 2024
https://berkeleyearth.org/global-temperature-report-for-2024
• NASA - Goddard Institute Surface Temperature (GISTEMP v4) analysis
https://data.giss.nasa.gov/gistemp
https://data.giss.nasa.gov/gistemp
• NASA - Temperatures Rising: NASA Confirms 2024 Warmest Year on Record
• NOAA - 2024 was the world’s warmest year on record
https://www.noaa.gov/news/2024-was-worlds-warmest-year-on-record
• Paris Agreementhttps://www.noaa.gov/news/2024-was-worlds-warmest-year-on-record
https://unfccc.int/process-and-meetings/the-paris-agreement
• pre-industrial
• When will we die?
https://arctic-news.blogspot.com/2019/06/when-will-we-die.html
• Clustered warming tolerances and the nonlinear risks of biodiversity loss on a warming planet - by Joseph Williamson et al.
also discussed on Facebook at:
• Sunspots
https://arctic-news.blogspot.com/p/sunspots.html
• Climate Reanalyzer
https://climatereanalyzer.org
• Arctic and Antarctic Data Archive System (ADS) of the National Institute of Polar Research of Japan
https://ads.nipr.ac.jp
• nullschool.net
https://earth.nullschool.net
https://arctic-news.blogspot.com/p/sunspots.html
• Climate Reanalyzer
https://climatereanalyzer.org
• Arctic and Antarctic Data Archive System (ADS) of the National Institute of Polar Research of Japan
https://ads.nipr.ac.jp
• nullschool.net
https://earth.nullschool.net
• NOAA - Understanding the Arctic polar vortex
https://www.climate.gov/news-features/understanding-climate/understanding-arctic-polar-vortex
also discussed on facebook at:
https://www.facebook.com/groups/arcticnews/posts/10162311831389679
https://www.climate.gov/news-features/understanding-climate/understanding-arctic-polar-vortex
also discussed on facebook at:
https://www.facebook.com/groups/arcticnews/posts/10162311831389679
• Double Blue Ocean Event 2025?
• Guy McPherson - consequences of an ice-free Arctic Ocean
https://ocean.dmi.dk/arctic/icethickness/thk.uk.php
• The first ice-free day in the Arctic Ocean could occur before 2030 - by Céline Heuzé et al. https://www.nature.com/articles/s41467-024-54508-3
also discussed on facebook at:
• Transforming Society
https://arctic-news.blogspot.com/2022/10/transforming-society.html
• Climate Plan
https://arctic-news.blogspot.com/p/climateplan.html
• Climate Emergency Declaration
https://arctic-news.blogspot.com/p/climate-emergency-declaration.html