Showing posts with label forcing. Show all posts

Thursday, July 6, 2023

Dire situation gets more dire every day

Conditions are dire


The world temperature was at a record high 17.23°C or 63.01°F on July 6, 2023 (black). The maximum temperature in 2022 (orange) and in 2016 (grey) was 16.92°C or 62.46°F (on July 24, 2022, and on August 13+14, 2016). The year 2016 is important, since there was a strong El Niño in 2016 and we're now again in an El Niño. 

As the image below adds, the 17.23°C temperature recorded on July 6, 2023, is a daily value, but if indicative for July 2023, the closest value for CMIP5 RCP8.5 would be 17.255°C, projected to occur in July 2035 (13 years away from now).

[ The international consortium Coupled Model Intercomparison Project (CMIP)
defines scenarios for use in climate projections. Its CMIP5 scenario (an average of
39 models of near-surface temperature and precipitation, and mean sea level pressure)
can be used in combination with Representative Concentration Pathways (RCP). ]

Why is the temperature rising so fast? 

The image below mentions a number of contributors, with charts added from an earlier post

[ click on images to enlarge ]

1. Emissions are high and greenhouse gas levels keep rising, increasing Earth's Energy Imbalance

2. We did come out of a La Niña that has for years been suppressing temperatures and we are now in an El Niño. A 2023 study led by Tao Lian predicts the current El Niño to be strong. Moving from the bottom of a La Niña to the peak of a strong El Niño could make a difference of more than half a degree Celsius, as discussed in an earlier post. Temperature anomalies can be very high during an El Niño. The image below shows that February 2016 on land was 3.28°C (5.904°F) hotter than 1880-1896, and 3.68°C (6.624°F) hotter compared to February 1880 on land. Note that 1880-1896 is not pre-industrial, the rise will be even larger when using a genuinely pre-industrial base.
The above image, from an earlier post, adds a poignant punchline: Looking at global averages over long periods is a diversion, peak temperature rise is the killer!

[ click on images to enlarge ]
3. The June 2023 number of sunspots is more than twice as high as predicted, as illustrated by the image on the right, from an earlier post and adapted from NOAA. If this trend continues, the rise in sunspots forcing from May 2020 to July 2025 may well make a difference of more than 0.25°C, a recent analysis found.

4. The January 2022 submarine volcano eruption near Tonga did add a huge amount of water vapor to the atmosphere, as discussed in an earlier post and also at facebook. Since water vapor is a potent greenhouse gas, this further contributes to speeding up the temperature rise. A 2023 study calculates that the eruption will have a warming effect of 0.12 Watts/m² over the next few years.

5. There are further things that contribute to the temperature rise, such as reductions of Sahara dust and of sulfur aerosols co-emitted with fossil fuel combustion that previously masked the temperature rise. 

The above points apply to the global temperature rise. The North Atlantic sea surface temperature is rising even stronger than the global rise, due to the following points:
  • The narrowing temperature difference between the Arctic and the Tropics is slowing down the flow of air from the Tropics to the Arctic, deforming the Jet Stream, and that can strongly prolong and amplify extreme weather events in the Northern Hemisphere, and result in stronger heating up of the North Atlantic.
  • This is also slowing down AMOC, causing more hot water to accumulate in the North Atlantic and to reach the Arctic Ocean, resulting in strong melting of sea ice from below and thus strong thinning.
  • Additionally, as temperatures rise, increased stratification further speeds up the sea surface temperature rise.
  • As the North Atlantic Ocean heats up and as cold air from the Arctic can more deeply descend over North America (due to Jet Stream deformation), the temperature difference between land and oceans widens, especially during the Northern Winter, and this can result in storms abruptly pushing strong wind along the path of the Gulf Stream, pushing ocean heat into the Arctic Ocean, with stronger evaporation occurring over the North Atlantic and with stronger precipitation (rain, snow, etc.) occurring further down the path of the Gulf Stream. This stronger evaporation cools the surface of the North Atlantic.
  • This cooling, together with cooling from increased meltwater, also results in formation of a cold freshwater lid on top of the North Atlantic, also because freshwater is less dense than saltwater.
  • This lid on top of the North Atlantic enables more hot water to flow underneath this lid into the Arctic Ocean, with the danger that more heat will reach sediments at the seafloor of the Arctic Ocean and destabilize hydrates, resulting in eruption of huge amounts of methane.
  • This sea surface cooling has until now covered up the full extent of the rise in ocean heat in the North Atlantic, but - as illustrated by the image below - the continued rise in ocean heat now is overwhelming this cooling.
The image below shows that the North Atlantic sea surface temperature was 23.3°C on June 21, 2023 (on the black line), 0.9°C higher than the 22.4°C on June 21, 2022 (on the orange line). A record high of 24.9°C was reached on September 4, 2022, even while La Niña at the time was suppressing the temperature, whereas there now is an El Niño, so the outlook is grim.

[ from earlier post ]
Feedbacks and developments that make the outlook even more threatening

Globally, methane rose to 1924.99 ppb in December 2022. The image below has a polynomial trend added that is based on April 2018 to December 2022 NOAA global methane data and is pointing at 1200 ppm CO₂e (carbon dioxide equivalent) getting crossed in 2027. The Clouds Tipping Point, at 1200 ppm CO₂e, could be crossed and this on its own could result in a further rise of 8°C. This tipping point could be crossed as early as in 2027 due to forcing caused by the rise in methane alone. When further forcing is taken into account, this could happen even earlier than in 2027.
[ from earlier post ]
[ click on images to enlarge ]
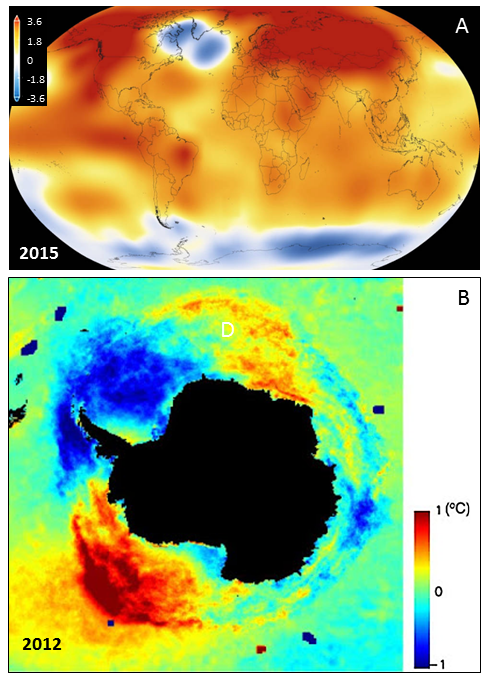
On February 22, 2023, Antarctic sea ice area was only 1,050,708 km² in size, as discussed in an earlier post. Since that time, Antarctic sea ice has been growing at a much slower pace than in previous years. On July 4, 2023, Antarctic sea ice area was 9,385,739 km² in size, and sea ice has actually been falling in size recently, as illustrated by the Nico Sun image on the right. Less sea ice means that sunlight previously reflected back into space by the sea ice is now instead getting absorbed by the Southern Ocean, in a self-reinforcing feedback loop that results in further sea ice loss, in turn further speeding up the temperature rise and making the weather ever more extreme.

[ Two out of numerous feedbacks ]
This dire situation spells bad news regarding the temperature rise to come, the more so since, on top of these dire conditions, there are feedbacks and further developments that make the outlook even more threatening. 

A huge temperature rise could be triggered abruptly, due to a multitude of feedbacks and further developments that could strongly deteriorate the situation even further, such as by causing more water vapor to get added to the atmosphere, as discussed at Moistening Atmosphere and Extreme Heat Stress.

[ see the Extinction page ]
Changes in aerosols are discussed in earlier posts such as this post and this post. The upcoming temperature rise on land on the Northern Hemisphere could be so strong that much traffic, transport and industrial activity will grind to a halt, resulting in a reduction in cooling aerosols that are now masking the full wrath of global heating. These are mainly sulfates, but burning of fossil fuel and biomass also emits iron that currently helps photosynthesis of phytoplankton in oceans, as a 2022 study points out, and less iron means less drawdown of carbon dioxide. 

Without these emissions, the temperature is projected to rise strongly, while there could be an additional temperature rise due to an increase in warming aerosols and gases as a result of more biomass and waste burning and forest fires.

The image on the right, from the extinction page, includes a potential rise of 1.9°C by 2026 as the sulfate cooling effect falls away and an additional rise of 0.6°C due to an increase in warming aerosols by 2026, as discussed in this post and earlier posts.

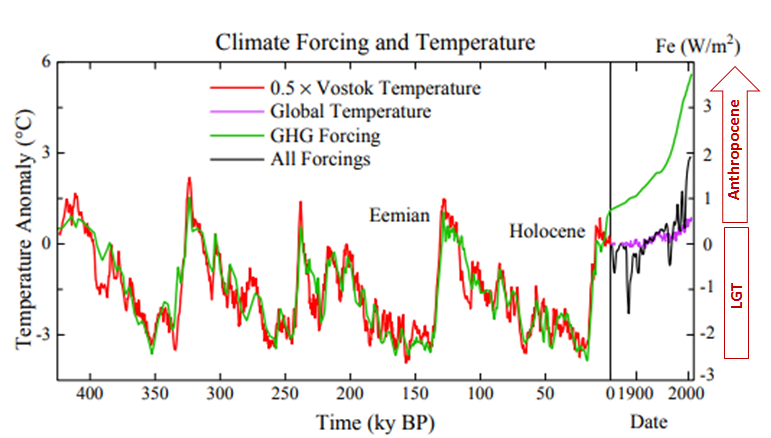
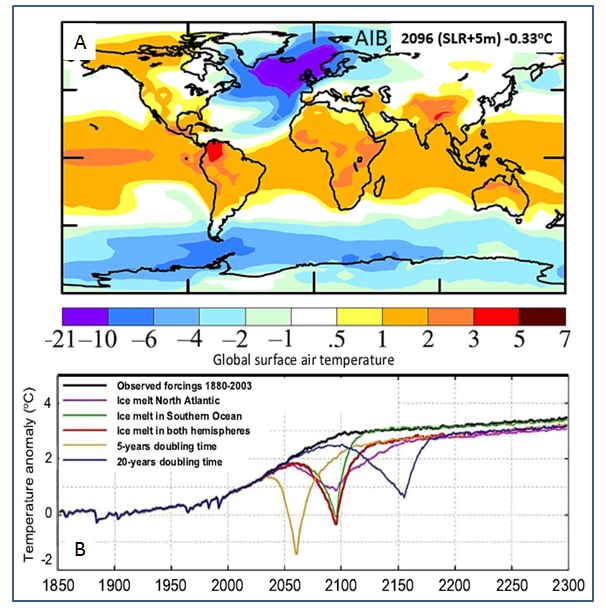
The image on the right indicates that the rise from pre-industrial to 2020 could be as much as 2.29°C. Earth's energy imbalance has grown since 2020, so the rise up to now may be even higher. 

Climate Tipping Points and further Events and Developments

The temperature could also be pushed up further due to reductions in the carbon sink on land. An earlier post mentions a study that found that the Amazon rainforest is no longer a sink, but has become a source, contributing to warming the planet instead; another study found that soil bacteria release CO₂ that was previously thought to remain trapped by iron; another study found that forest soil carbon does not increase with higher CO₂ levels; another study found that forests' long-term capacity to store carbon is dropping in regions with extreme annual fires; another earlier post discussed the Terrestrial Biosphere Temperature Tipping Point, coined in a study finding that at higher temperatures, respiration rates continue to rise in contrast to sharply declining rates of photosynthesis, which under business-as-usual emissions would nearly halve the land sink strength by as early as 2040.

This earlier post also discusses how CO₂ and heat taken up by oceans can be reduced. A 2021 study on oceans finds that, with increased stratification, heat from climate warming less effectively penetrates into the deep ocean, which contributes to further surface warming, while it also reduces the capability of the ocean to store carbon, exacerbating global surface warming. A 2022 study finds that ocean uptake of CO₂ from the atmosphere decreases as the Meridional Overturning Circulation slows down. An earlier analysis warns about growth of a layer of fresh water at the surface of the North Atlantic resulting in more ocean heat reaching the Arctic Ocean and the atmosphere over the Arctic, while a 2023 study finds that growth of a layer of fresh water decreases its alkalinity and thus its ability to take up CO₂, a feedback referred to as the Ocean Surface Tipping Point.

[ from Blue Ocean Event 2022? - click on images to enlarge ]
The above image depicts only one sequence of events, or one scenario out of many. Things may eventuate in different orders and occur simultaneously, i.e. instead of one domino tipping over the next one sequentially, many events may occur simultaneously and reinforce each other. Further events and developments could be added to the list, such as ocean stratification and stronger storms that can push large amounts of warm salty water into the Arctic Ocean.

While loss of Arctic sea ice and loss of Permafrost in Siberia and North America are often regarded as tipping points, Antarctic sea ice loss, and loss of the snow and ice cover on Greenland, on Antarctica and on mountaintops such as the Tibetan Plateau could also be seen as tipping points. Another five tipping points are: 

Extinction

Altogether, the rise from pre-industrial to 2026 could be more than 18.44°C, while humans are likely to go extinct with a rise of 3°C, as illustrated by the image below, from an analysis discussed in an earlier post.


This should act as a warning that near-term human extinction could occur soon. In the video below, Guy McPherson discusses how fast humans could go extinct. 


Conclusion

The dire situation is getting more dire every day, calling for a Climate Emergency Declaration and implementation of comprehensive and effective action, as described in the Climate Plan with an update at Transforming Society.


Links

• Climate Reanalyzer - World Daily 2-meter Air Temperature (90-90°N, 0-360°E)
https://climatereanalyzer.org/clim/t2_daily

• Climate Reanalyzer - CMIP5 RCP8.5 projection
https://climatereanalyzer.org/reanalysis/monthly_tseries

• NOAA - Solar cycle sunspot number progression
https://www.swpc.noaa.gov/products/solar-cycle-progression

• A Strong 2023/24 El Niño is Staged by Tropical Pacific Ocean Heat Content Buildup - by Tao Lian et al. (2023)
https://spj.science.org/doi/10.34133/olar.0011

• NSIDC - National Snow and Ice Data Center
https://www.nsidc.org

• NSIDC - Chartic interactive sea ice graph
https://nsidc.org/arcticseaicenews/charctic-interactive-sea-ice-graph

• Cryosphere Computing - by Nico Sun
https://cryospherecomputing.com

• Nullschool
https://earth.nullschool.net

• Climate Reanalyzer - sea ice based on NSIDC index V3
https://climatereanalyzer.org/clim/seaice

• NOAA - greenhouse gases - trends CH4 (methane)
• NOAA - Solar cycle progression

• NASA gistemp Monthly Mean Global Surface Temperature - Land Only

• NOAA - Annual Northern Hemisphere Land Temperature Anomalies 

• Tonga eruption increases chance of temporary surface temperature anomaly above 1.5 °C - by Stuart Jenkins et al. (2023)
https://www.nature.com/articles/s41558-022-01568-2


• Moistening Atmosphere
• Albedo, latent heat, insolation and more

• Latent Heat

• Blue Ocean Event

• Methane keeps rising

• A huge temperature rise threatens to unfold soon

• The Clouds Feedback and the Clouds Tipping Point
https://arctic-news.blogspot.com/p/clouds-feedback.html

• Human Extinction by 2025?

• 2020: Hottest Year On Record

• The Importance of Methane in Climate Change

• The underappreciated role of anthropogenic sources in atmospheric soluble iron flux to the Southern Ocean - by Mingxu Liu et al. (2022)
https://www.nature.com/articles/s41612-022-00250-w

• How close are we to the temperature tipping point of the terrestrial biosphere? - by Katharyn Duffy et al. (2021)

• Overshoot or Omnicide? 

• Upper Ocean Temperatures Hit Record High in 2020 - by Lijing Cheng et al. (2021)

• Reduced CO₂ uptake and growing nutrient sequestration from slowing overturning circulation - by Yi Liu et al. (2022)
https://www.nature.com/articles/s41558-022-01555-7

• Cold freshwater lid on North Atlantic
• Long-Term Slowdown of Ocean Carbon Uptake by Alkalinity Dynamics - by Megumi Chikamoto et al. (2023) 
• Ocean Surface Tipping Point Could Accelerate Climate Change

• When Will We Die?

• Edge of Extinction: Extinct - HOW FAST? - video by Guy McPherson

• Edge of Extinction: Destination Destruction - video by Guy McPherson


• Transforming Society
https://arctic-news.blogspot.com/2022/10/transforming-society.html

• Climate Emergency Declaration
https://arctic-news.blogspot.com/p/climate-emergency-declaration.html


Sunday, September 1, 2019

Blueprints of future climate trends

Blueprints of future climate trends

Extreme GHG and temperature rise rates question linear climate projections

Andrew Glikson
Earth and climate scientist
Australian National University
geospec@iinet.net.au

Abstract

The extreme greenhouse gas (GHG) and temperature rise rates since the mid-1970th raise questions over linear climate projections for the 21st century and beyond. Under a rise of CO₂-equivalent reaching +500 ppm and 3.0 W/m⁻² relative to 1750, the current rise rates of CO₂ by 2.86 ppm per and recent global temperature rise rate (0.15-0.20°C per decade) since 1975 are leading to an abrupt shift in state of the terrestrial climate and the biosphere. By mid-21st century at >750 ppm CO₂-e climate tipping points indicated by Lenton et al. 2008 and Schellnhuber 2009 are likely to be crossed. Melting of the Greenland and Antarctic ice sheets has increased by a factor of more than 5 since 1979–1990. As the ice sheets and sea ice melt, the albedo flip between reflective ice surfaces and dark infrared-absorbing water results in significant increase of radiative forcing, and complete removal of Arctic sea ice would result in a forcing of about 0.7 W/m⁻² (Hudson, 2011). The confluence of climate events, including a breach of the circum-Arctic jet stream boundary and a polar-ward migration of climate zones at a rate of 56-111 km per decade, induce world-wide extreme weather events including bushfires, methane release from Arctic permafrost and sediments. For a climate sensitivity of 3±1.5°C per doubling of atmospheric CO₂, global warming has potentially reached between +2°C to +3°C above mean pre-industrial temperatures at a rate exceeding the fastest growth rate over the last 55 million years. As ice melt water flow into the oceans temperature polarities between warming continents and cooling tracts of ocean would further intensify extreme weather events under non-linear climate trajectories. The enrichment of the atmosphere in GHG, constituting a shift in state of the terrestrial climate, is predicted to delay the onset of the next glacial state by some 50,000 years.

GHG and temperature rise

The paleoclimate record suggests that no event since 55 million years ago, the Paleocene-Eocene Thermal Maximum (PETM), when global temperatures rose by more than +5 to +8°C over a period of ~20,000 years, with a subsequent warming period of up to 200,000 years, has been as extreme as atmospheric disruption since the onset of the industrial age about 1750 AD (the Anthropocene), accelerating since 1975. During this period greenhouse gas levels have risen from ~280 ppm to above >410 ppm and to 496 ppm CO₂-equivalent (Figure 1), the increase of CO₂ reaching near-47 percent above the original atmospheric concentration. However, linear climate change projections are rare in the recent climate history (Figure 2) and linear future climate projections may not account for the effects of amplifying feedbacks from land and oceans. Given an Anthropocene warming rate faster by ~X200 times than the PETM (Figure 3), linear warming trajectories such as are projected by the IPCC may overlook punctuated tipping points, transient reversals and stadial events.
Figure 1. Growth of CO₂-equivalent level and the annual greenhouse gas Index (NOAA AGGI).
Measurements of CO₂ to the 1950s are from (Keeling et al., 2008) and from air trapped in ice and
snow between CO₂ concentrations and radiative forcing from all long-lived greenhouse gases.

According to NOAA, GHG forcing in 2018 has reached 3.101 W/m⁻² relative to 1750 (CO₂ = 2.044 W/m⁻²; CH₄ = 0.512 W/m⁻²; N₂O = 0.199 W/m⁻²; CFCs = 0.219 W/m⁻²) with a CO₂-equivalent of 492 ppm (Figure 1). The rise in GHG forcing during the Anthropocene since about 1800 AD, intensifying since 1900 AD and sharply accelerating since about 1975, has induced a mean of ~1.5°C over the continents above pre-industrial temperature, or >2.0°C when the masking role of aerosols is discounted, implying further warming is still in store.

According to Hansen et al. 2008, the rise in radiative forcing during the Last Glacial Termination (LGT - 18,000 -11,000 years BP), associated with enhancing feedbacks, has driven GHG radiative forcing by approximately ~3.0 W/m⁻² and a mean global temperature rise of ~4.5°C (Figure 2), i.e. of similar order as the Anthropocene rise since about 1900. However the latter has been reached within a time frame at least X30 times shorter than the LGT, underpinning the extreme nature of current global warming.
Figure 2. (Hansen et al. 2008). Glacial-temperature and GHG forcing for the last 420,000 years based on the Vostok
ice core, with the time scale expanded for the Anthropocoene. The ratio of temperature and forcing scales is 1.5°C
per 1 W/m⁻². The temperature scale gives the expected equilibrium response to GHG change including slow feedback
surface albedo change. Modern forcings include human-made aerosols, volcanic aerosols and solar irradiance.
The CO₂-equivalent levels and radiative forcing levels constitute a rise from Holocene levels (~280 ppm CO₂) to >410 ppm compared with Miocene-like levels (300-600 ppm CO₂), at a rate reaching 2 to 3 ppm/year, within a century or so, driving the fastest temperature rise rate recorded since 55 million years ago (Figure 3).

Figure 3. A comparison between rates of mean global temperature rise during: (1) the last Glacial Termination
(after Shakun et al. 2012); (2) the PETM (Paleocene-Eocene Thermal Maximum, after Kump 2011);
(3) the late Anthropocene (1750–2016), and (4) an asteroid impact. In the latter instance temperature
due to CO₂ rise would lag by some weeks or months behind aerosol-induced cooling

Considering the transient mitigating albedo effects of clouds, seasonal land surface albedo, ice albedo, atmospheric aerosols including sulphur dioxide and nitrate, the potential rise of land temperature could have reached -0.4 to -0.9 W/m⁻² in 2018, masking approximately 0.6 to 1.3°C potential warming once the short lived aerosol effect is abruptly reduced.

Accelerated melting of the ice sheets

The fast rate of the Anthropocoene temperature rise compared to the LGT and PETM (Figure 3) ensues in differences in terms of the adaptation of flora and fauna to new conditions. The shift in state of the Earth’s climate is most acutely manifested in the poles, where warming leads to weakening of the jet stream boundaries which are breached by outflow of cold air fronts, such as the recent “Beast from the East” event, and penetration of warm air masses.

As the poles keep warming, to date by a mean of ~2.3°C, the shrinking of the ice sheets per year has accelerated by a factor of more than six fold (Figure 4). Warming of the Arctic is driven by the ice-water albedo flip, where dark sea-water absorbing solar energy alternates with high-albedo ice and snow, and by the weakening of the polar boundary and jet stream.

Greenland. The threshold of collapse of the Greenland ice sheet, retarded by hysteresis, is estimated in the range of 400-560 ppm CO₂, already transgressed at the current 496 ppm CO₂equivalent (Figure 4). The Greenland mass loss increased from 41 ± 17 Gt/yr in 1990–2000, to 187 ± 17 Gt/yr in 2000–2010, to 286 ± 20 Gt/yr in 2010–2018, or six fold since the 1980s, or 80 ± 6 Gt/yr per decade, on average.

Antarctica. The greenhouse gas level and temperature conditions under which the East Antarctic ice sheet formed during the late Eocene 45-34 million years ago are estimated as ~800–2000 ppm and up to 4 degrees Celsius above pre-industrial values, whereas the threshold of collapse is estimated as 600 ppm CO₂ or even lower. The total mass loss from the Antarctic ice sheet increased from 40 ± 9 Gt/yr in 1979–1990 to 50 ± 14 Gt/yr in 1989–2000, 166 ± 18 Gt/yr in 1999–2009, and 252 ± 26 Gt/yr in 2009–2017. Based on satellite gravity data, the East Antarctic ice sheet is beginning to breakdown in places (Jones 2019), notably the Totten Glacier (Rignot et al., 2019), which may be irreversible. According to Mengel and Levermann (2014), the Wilkes Basin in East Antarctica alone contains enough ice to raise global sea levels by 3–4 meters.

Figure 4. (A) New elevation showing the Greenland and Antarctic current state of the ice sheets accurate to a few meters in height, with elevation changes indicating melting at record pace, losing some 500 km³ of ice per-year into the oceans; (B) Ice anomaly relative to the 2002-2016 mean for the Greenland ice sheet (magenta) and Antarctic ice sheet (cyan). Data are from GRACE; (C) the melting of sea ice 1978-2017, National Snow and Ice Data Center (NCIDC)

C. Migration of climate zones

The expansion of warm tropical zones and the polar-ward migration of subtropical and temperate climate zones are leading to a change in state in the global climate pattern. The migration of arid subtropical zones, such as the Sahara, Kalahari and central Australian deserts into temperate climate zones ensues in large scale droughts, such in inland Australia and southern Africa. In the northern hemisphere expansion of the Sahara desert northward, manifested by heat waves across the Mediterranean and Europe (Figure 5).
Figure 5. (A) Migration of the subtropical Sahara climate zone (red spots) northward into the Mediterranean climate
zone leads to warming, drying and fires over extensive parts of Spain, Portugal, southern France, Italy, Greece and
Turkey, and to melting of glaciers in the Alps. Migration, Environment and Climate Change, International
Organization for Migration Geneva – Switzerland (GMT +1); Source: https://environmentalmigration.iom.int/maps

Figure 5. (B) Southward encroachment of Kalahari Desert conditions (vertical lines and red spots) leading to
warming and drying of parts of southern Africa. Source: https://environmentalmigration.iom.int/maps
Figure 5. (C) Drying parts of southern Australia, including Western Australia, South Australia and parts of the
eastern States, accompanied with increasing bushfires. Source: https://environmentalmigration.iom.int/maps
Climate extremes

Since the bulk of terrestrial vegetation has evolved under glacial-interglacial climate conditions, where GHG range between 180 - 300 ppm CO₂, global warming is turning large parts of Earth into a tinderbox, ignited by natural and human agents. By July and August 2019, as fires rage across large territories, including the Amazon forest, dubbed the Planet’s lungs as it enriches the atmosphere in oxygen. When burnt the rainforest becomes of source of a large amount of CO₂ (Figure 6.B), with some 72,843 fires in Brazil this year and extensive bushfires through Siberia, Alaska, Greenland, southern Europe, parts of Australia and elsewhere, the planet’s biosphere is progressively transformed. As reported: ‘Climate change is making dry seasons longer and forests more flammable. Increased temperatures are also resulting in more frequent tropical forest fires in non-drought years. And climate change may also be driving the increasing frequency and intensity of climate anomalies, such as El Niño events that affect fire season intensity across Amazonia.’

Extensive cyclones, floods, droughts, heat waves and fires (Figure 6.B) increasingly ravage large tracts of Earth. However, despite its foundation in the basic laws of physics (the black body radiation laws of Planck, Kirchhoff' and Stefan Boltzmann), as well as empirical observations around the world by major climate research bodies (NOAA, NASA, NSIDC, IPCC, World Meteorological Organization, Hadley-Met, Tindale, Potsdam, BOM, CSIRO and others), the anthropogenic origin, scale and pace of climate change remain subject to extensively propagated denial and untruths.

Figure 6. (A) Extreme weather events around the world 1980-2018,
including earthquakes, storms, floods, droughts. Munich Re-insurance.
Figure 6. (B) A satellite infrared image of South America fires (red dots) during July and August, 2019, NASA.

An uncharted climate territory

Whereas strict analogies between Quaternary and Anthropocene climate developments are not possible, elements of the glacial-interglacial history are relevant for an understanding of current and future climate events. The rise of total greenhouse gas (GHG), expressed as CO₂-equivalents, to 496 ppm CO₂-e (Figure 1), within less than a century represents an extreme atmospheric event. It raised GHG concentrations from Holocene levels to the range of the Miocene (34–23 Ma) when CO₂ level was between 300 and 530 ppm. As the glacial sheets disintegrate, cold ice-melt water flowing into the ocean ensue in large cold water pools, a pattern recorded following peak interglacial phases over the last 450,000 years, currently manifested by the growth of cold regions in north Atlantic Ocean south of Greenland and in the Southern Ocean fringing Antarctica (Figure 7).

Warming of +3°C to +4°C above pre-industrial levels, leading to enhanced ice-sheet melt, would raise sea levels by at least 2 to 5 meters toward the end of the century and, delayed by hysteresis, likely by 25 meters in the longer term. Golledge et al. (2019) show meltwater from Greenland will lead to substantial slowing of the Atlantic overturning circulation, while meltwater from Antarctica will trap warm water below the sea surface, increasing Antarctic ice loss. Whereas the effect of low-density ice melt water on the surrounding oceans is generally not included in many models, depending on amplifying feedbacks, prolonged Greenland and Antarctic melting and consequent cooling of surrounding ocean sectors as well as penetration of freezing air masses through weakened polar boundaries may have profound effect on future climate change trajectories (Figure 8).

Figure 7. (A) Global warming map (NASA 2018). Note the cool ocean regions south of Greenland and 
along the Antarctic. Credits: Scientific Visualization Studio/Goddard Space Flight Center; 
(B) 2012 Ocean temperatures around Antarctica (NASA 2012).
Climate projections for 2100-2300 by the IPCC AR5 Synthesis Report, 2014 portray predominantly linear to curved models of greenhouse gas, global temperatures and sea level changes. These models however appear to take limited account of amplifying feedbacks from land and ocean and of the effects of cold ice-melt on the oceans. According to Steffen et al. (2018) “self-reinforcing feedbacks could push the Earth System toward a planetary threshold” and “would lead to a much higher global average temperature than any interglacial in the past 1.2 million years and to sea levels significantly higher than at any time in the Holocene”.

Amplifying feedbacks of global warming include:
  • The albedo-flip of melting sea ice and ice sheets and the increase of the water surface area and thereby sequestration of CO₂. Hudson (2011) estimates a rise in radiative forcing due to removal of Arctic summer sea ice as 0.7 W/m², a value close to the total of methane release since 1750.
  • Reduced ocean CO₂ intake due to lesser solubility of the gas with higher temperatures.
  • Vegetation desiccation and burning in some regions, and thereby released CO₂ and reduced evaporation and its cooling effect. This factor and the increase of precipitation in other regions lead to differential feedbacks from vegetation as the globe warms (Notaro et al. 2007).
  • An increase in wildfires, releasing greenhouse gases (Figure 6).
  • Release of methane from permafrost, bogs and sediments and other factors.
Linear temperature models appear to take limited account of the effects on the oceans of ice melt water derived from the large ice sheets, including the possibility of a significant stadial event such as already started in oceanic tracts fringing Greenland and Antarctica (Figure 7) and modeled by Hansen et al, (2016). In the shorter to medium term sea level rises would ensue from the Greenland ice sheet (6-7 meter sea level rise) and West Antarctic ice sheet melt (4.8 meter sea level rise). Referring to major past stadial events, including the 8200 years-old Laurentian melt and the 12.7-11.9 younger dryas event, a protracted breakdown of parts of the Antarctic ice sheet could result in major sea level rise and extensive cooling of southern latitudes and beyond, parallel with warming of tropical and mid-latitudes (Figure 8) (Hansen et al. 2016). The temperature contrast between polar-derived cold fronts and tropical air masses is bound to lead to extreme weather events, echoed among other in Storms of my grandchildren (Hansen, 2010).

Figure 8. (A) Model Surface-air temperature (°C) for 2096 relative to 1880–1920 (Hansen et al. 2016).
The projection betrays major cooling of the North Atlantic Ocean, cooling of the circum-Antarctic Ocean
and further warming in the tropics, subtropics and the interior of continents; (B) Modeled surface-air
temperatures (°C) to 2300 AD relative to 1880–1920 for several ice melt rate scenarios, displaying a stadial cooling event at a time dependent on the ice melt doubling time (Hansen et al., 2016). Courtesy Prof James Hansen;.
Within and beyond 2100-2300 projections (Figure 8.A, B) lies an uncharted climate territory, where continuing melting of the Antarctic ice sheet, further cooling of neighboring sectors of the oceans and climate contrasts with GHG-induced warming of land areas (Figure 8.A), ensue in chaotic climate disruptions (Figure 8.B). Given the thousands to tens of thousands years longevity of atmospheric greenhouse gases (Solomon et al., 2009; Eby et al 2009), the onset of the next ice age is likely to be delayed on the scale of tens of thousands of years (Berger and Loutre, 2002) through an exceptionally long interglacial period (Figure 9).

These authors state: ‘The present day CO₂ concentration (now >410 ppm) is already well above typical interglacial values of ~290 ppmv. This study models increases to up to 750 ppmv over the next 200 years, returning to natural levels by 1000 years. The results suggest that, under very small insolation variations, there is a threshold value of CO₂ above which the Greenland Ice Sheet disappears. The climate system may take 50,000 years to assimilate the impacts of human activities during the early third millennium. In this case, an “irreversible greenhouse effect” could become the most likely future climate. If the Greenland and west Antarctic Ice Sheets disappear completely, then today’s “Anthropocene” may only be a transition between the Quaternary and the next geological period.’

Figure 9. Simulated Northern Hemisphere ice volume (increasing downward) for the period 200,000 years BP to 130,000 years in the future, modified after a part of Berger and Loutre 2002. Time is negative in the past and positive in the future. For the future, three CO2 scenarios were used: last glacial-interglacial values (solid line), a human-induced concentration of 750 ppm (dashed line), and a constant concentration of 210 ppm inducing a return to a glacial state (dotted line).
As conveyed by leading scientists “Climate change is now reaching the end-game, where very soon humanity must choose between taking unprecedented action or accepting that it has been left too late and bear the consequences” (Prof. Hans Joachim Schellnhuber) …“We’ve reached a point where we have a crisis, an emergency, but people don’t know that ... There’s a big gap between what’s understood about global warming by the scientific community and what is known by the public and policymakers” (James Hansen).

Climate scientists find themselves in a quandary similar to medical doctors, committed to help the ill, yet need to communicate grave diagnoses. How do scientists tell people that the current spate of extreme weather events, including cyclones, devastating islands from the Caribbean to the Philippine, floods devastating coastal regions and river valleys from Mozambique to Kerala, Pakistan and Townsville, and fires burning extensive tracts of the living world, can only intensify in a rapidly warming world? How do scientists tell the people that their children are growing into a world where survival under a mean temperature higher than +2 degrees Celsius (above pre-industrial temperature) is likely to be painful and, in some parts of the world, impossible, let alone under +4 degrees Celsius projected by the IPCC?

Summary and conclusions
  1. The current growth rate of atmospheric greenhouse gas is the fastest recorded for the last 55 million years.
  2. By the mid-21st century, at the current CO₂ rise rates of 2 to 3 ppm/year, a CO₂-e level of >750 ppm is likely to transcend the climate tipping points indicated by Lenton et al. 2008 and Schellnhuber 2009.
  3. The current extreme rise rates of GHG (2.86 ppm CO₂/year) and temperature (0.15-0.20°C per decade since 1975) raise doubt with regard to linear future climate projections.
  4. Global greenhouse gases have reached a level exceeding the stability threshold of the Greenland and Antarctic ice sheets, which are melting at an accelerated rate.
  5. Allowing for the transient albedo-enhancing effects of sulphur dioxide and other aerosols, mean global temperature has reached approximately 2.0 degrees Celsius above per-industrial temperatures.
  6. Due to hysteresis the large ice sheets would outlast their melting temperatures.
  7. Land areas would be markedly reduced due to a rise to Miocene-like sea levels of approximately 40±15 meters above pre-industrial levels.
  8. Cold ice melt water flowing from the ice sheets into the oceans at an accelerated rate is reducing temperatures in large tracts in the North Atlantic and circum-Antarctic.
  9. Strong temperature contrasts between cold polar-derived and warm tropical air and water masses are likely to result in extreme weather events, retarding habitats and agriculture over coastal regions and other parts of the world.
  10. In the wake of partial melting of the large ice sheets, the Earth climate zones would continue to shift polar-ward, expanding tropical to super-tropical regions such as existed in the Miocene (5.3-23 million years ago) and reducing temperate climate zones and polar ice sheets.
  11. Current greenhouse gas forcing and global mean temperature are approaching Miocene Optimum-like composition, bar the hysteresis effects of reduced ice sheets (Figure 4.A).
  12. The effect of high atmospheric greenhouse gas levels would be for the next ice age to be delayed on a scale of tens of thousands of years, during which chaotic tropical to hyperthermal conditions would persist until solar radiation and atmospheric CO₂ subsided below ~300 ppm.
  13. Humans will survive in relatively favorable parts of Earth, such as sub-polar regions and sheltered mountain valleys, where gathering of flora and hunting of remaining fauna may be possible.

A Postscript

The author, while suggesting the projections made in this paper are consistent with the best climate science with which he is aware, sincerely hopes the implications of these projections would not eventuate.


Friday, June 21, 2019

Beyond climate tipping points

Beyond climate tipping points
Greenhouse gas levels exceed the stability limit of the
Greenland and Antarctic ice sheets

by Andrew Glikson

Abstract

The pace of global warming has been grossly underestimated. As the world keeps increasing its carbon dioxide (CO₂) emissions, rising in 2018 to a record 33.1 billion ton of CO₂ per year, the atmospheric greenhouse gas level has now exceeded 560 ppm (parts per million) CO-equivalent, namely when methane and nitrous oxide are included. This level surpasses the stability threshold of the Greenland and Antarctic ice sheets. The term “climate change” is thus no longer appropriate, since what is happening in the atmosphere-ocean system, accelerating over the last 70 years or so, is an abrupt calamity on a geological dimension, threatening nature and human civilization. Ignoring what the science says, the powers-that-be are presiding over the sixth mass extinction of species, including humanity.

As conveyed by leading scientists “Climate change is now reaching the end-game, where very soon humanity must choose between taking unprecedented action, or accepting that it has been left too late and bear the consequences” (Prof. Hans Joachim Schellnhuber) ... “We’ve reached a point where we have a crisis, an emergency, but people don’t know that ... There’s a big gap between what’s understood about global warming by the scientific community and what is known by the public and policymakers” (Prof. James Hansen).


Rising greenhouse gases and temperatures

By May 2019 CO₂ levels (measured at Mauna Loa, Hawaii) reached 414.66 ppm, growing at a rate of 3.42 ppm/year, well above the highest rate recorded for the last 65 million years. The total CO, methane (CH) and nitrous oxide (NO) expressed as CO-equivalents has reached at least 560.3 ppm (Table 1) (at a very low forcing value for methane ¹), the highest concentration since 34 - 23 Million years ago, when atmospheric CO ranged between 350 and 500 ppm.

Table 1. Total atmospheric CO2e from CO2, CH4 and N2O
CO2
CO2 rate
CH4
CH4 rate
N2O
414.66 ppm 
3.42 ppm/year
1865.4 ppb
9.2 ppm/year
332ppb
CO2 ppm 
rise/year
CH4 forcing ≥25 CO2e
CH4 ppb
rise/year
N2O forcing = 298 CO2e
CO2 ppm 
414.7

CH4 ppm forcing
1.865 x ≥25 =
46.6 ppm CO2e 
(equivalent)

N2O ppm forcing
0.332 x 298 =
99 ppm CO2e 
(equivalent)

Total CO2e: 414.7+46.6+99 = >560.3 ppm CO2
¹A methane forcing value of 25 x CO2 is very low. Higher forcing values are more appropriate.
Plus: SF₆, CHF3, CH2F2, CF4, C2F6, C3F8, C4F10, C4F8, C5F12, C6F1


Figure 1. Projected CO₂ levels for IPCC emission scenarios

The current rise of the total greenhouse gas levels to at least 560 ppm CO-equivalent, twice the pre-industrial CO2 level of 280 ppm, implies that global warming has potentially reached +2°C to +3°C above pre-industral temperature. Considering the mitigating albedo/reflection effects of atmospheric aerosols, including sulphur dioxide, dust, nitrate and organic carbon, the mean rise of land temperature exceeds +1.5°C (Berkeley Earth institute).

The threshold for collapse of the Greenland ice sheet is estimated in the range of 400-560 ppm CO₂ at approximately 2.0 - 2.5 degrees Celsius above pre-industrial temperatures, and is retarded by hysteresis (where a physical property lags behind changes in the effect causing it). The threshold for the breakdown of the West Antarctic ice sheet is similar. The greenhouse gas level and temperature conditions under which the East Antarctic ice sheet formed about 34 million years ago are estimated as ~800–2000 ppm at 4 to 6 degrees Celsius above pre-industrial values. Based mainly on satellite gravity data there is evidence the East Antarctic ice sheet is beginning to melt in places (Jones, 2019), with ice loss rates of approximately 40 Gt/y (Gigaton of ice per year) in 1979–1990 and up to to 252 Gt/y in 2009–2017 (Rignot et al., 2019).

The cumulative contribution to sea-level rise from Antarctic ice melt was 14.0 ± 2.0 mm since 1979. This includes 6.9 ± 0.6 mm from West Antarctica, 4.4 ± 0.9 mm from East Antarctica, and 2.5 ± 0.4 mm from the Antarctic Peninsula (Rignot et al., 2019). Based on the above the current CO-equivalent level of at least 560 ppm closely correlates with the temperature peak at ~16 million tears ago (Figures 2 and 5), when the Greenland ice sheet did not exist and large variations affected the Antarctic ice sheet (Gasson et al., 2016).

Figure 2. Updated Cenozoic pCO₂ and stacked deep-sea benthic foraminifer oxygen isotope curve for 0 to
65 Ma (Zachos et al., 2008) converted to the Gradstein timescale (Gradstein et al., 2004).
ETM2 = Eocene Thermal Maximum 2, PETM = Paleocene/Eocene Thermal Maximum.

Transient melt events

As the glacial sheets disintegrate, cold ice-melt water flowing into the ocean ensue in large cold water pools, a pattern recorded through the glacial-interglacial cycles of the last 450,000 years, manifested by the growth of cold regions in the north Atlantic Ocean south of Greenland and in the Southern Ocean fringing Antarctica (Figures 3 and 4). The warming of the Arctic is driven by the ice-water albedo flip (where dark sea-water absorbing solar energy alternate with high-albedo ice and snow) and by the weakening of the polar boundary and jet stream. Penetration of Arctic-derived cold air masses through the weakened boundary results in extreme weather events in North America, Europe and northern Asia, such as the Beast from the East event.

Warming of +3°C to +4°C above pre-industrial levels, leading to enhanced ice-sheet melt, would raise sea levels by 2 to 5 meters toward the end of the century, and likely by 25 meters in the longer term. Golledge et al. (2019) show meltwater from Greenland will lead to substantial slowing of the Atlantic overturning circulation, while meltwater from Antarctica will trap warm water below the sea surface, increasing Antarctic ice loss. The effects of ice sheet-melt waters on the oceans were hardly included in IPCC models. Depending on the amplifying feedbacks, prolonged Greenland and Antarctic melting (Figures 3 and 4) and a consequent freeze event may ensue, lasting perhaps as long as two to three centuries.


Figure 3. (A) Global warming map (NASA 2018). Note the cool ocean regions south of Greenland
and along the Antarctic. Credits: Scientific Visualization Studio/Goddard Space Flight Center;
(B) 2012 Ocean temperatures around Antarctica, (NASA 2012).

21st–23rd centuries uncharted climate territory

Modelling of climate trends for the 2100-2300 by the IPCC AR5 Synthesis Report, 2014 portrays predominantly linear models of greenhouse gas rise, global temperatures and sea levels. These models however appear to take little account of amplifying feedbacks from land and ocean and of the effects of cold ice-melt water on the oceans. According to Steffen et al. (2018) “self-reinforcing feedbacks could push the Earth System toward a planetary threshold” and “would lead to a much higher global average temperature than any interglacial in the past 1.2 million years and to sea levels significantly higher than at any time in the Holocene”.

Amplifying feedbacks of global warming include:
  • The albedo-flip in melting sea ice and ice sheets and the increase of the water surface area and thereby the sequestration of CO₂. Hudson (2011) estimates a rise in radiative forcing due to removal of Arctic summer sea ice of 0.7 Watt/m², a value close to the total of methane release since 1750.
  • Reduced ocean CO₂ intake due to lesser solubility of the gas with higher temperatures.
  • Vegetation desiccation and loss in some regions, and thereby reduced evaporation with its cooling effect. This factor and the increase of precipitation in other regions lead to a differential feedbacks from vegetation as the globe warms (Notaro et al. 2007).
  • An increase in wildfires, releasing greenhouse gases.
  • Release of methane from permafrost, bogs and sediments and other factors.
Linear temperature models do not appear to take into account the effects on the oceans of ice melt water derived from the large ice sheets, including the possibility of a major stadial event such as already started in oceanic tracts fringing Greenland and Antarctica (Figure 3). In the shorter term sea level rises include the Greenland ice sheet (6-7 meter sea level rise) and West Antarctic ice sheet melt (4.8 meter sea level rise). Referring to major past stadial events, including the 8200 years-old Laurentian melt event and the 12.7-11.9 younger dryas event, a prolonged breakdown of parts of the Antarctic ice sheet could result in major sea level rise and extensive cooling of northern and southern latitudes, parallel with warming of tropical and mid-latitudes (Figure 4) (Hansen et al., 2016). The clashes between polar-derived cold weather fronts and tropical air masses are bound to lead to extreme weather events, echoed in Storms of my grandchildren (Hansen, 2010).

Figure 4. Model Surface-air temperature (°C) for 2096 relative to 1880–1920 (Hansen et al. 2016).
The projection portrays major cooling of the North Atlantic Ocean, cooling of the circum-Antarctic Ocean 

and further warming in the tropics, subtropics and the interior of continents, including Siberia and Canada.

Summary and conclusions
  1. Global greenhouse gases have reached a level exceeding the stability threshold of the Greenland and Antarctic ice sheets, melting at an accelerated rate
  2. The current growth rate of atmospheric greenhouse gas of 3.42 ppm CO₂/year is the fastest recorded for the last 55 million years
  3. Allowing for the transient albedo enhancing effects of sulphur dioxide and other aerosols, mean global temperature has reached about 2 degrees Celsius above pre-industrial temperatures. 
  4. Due to hysteresis the large ice sheets outlast their melting temperatures. 
  5. Cold ice melt water flowing from the ice sheets at an accelerated rate will reduce the temperature of large ocean tracts in the North Atlantic and circum-Antarctic. Strong temperature contrasts between cold polar-derived air and water masses and tropical air and water masses would result in extreme weather events, retarding agriculture in large parts of the world. 
  6. Humans will survive in relatively favorable parts of Earth, such as sub-polar regions and sheltered mountain valleys, where hunting of surviving fauna may be possible.
  7. In the wake of partial melting of the large ice sheets, the Earth climate would shift to polarized conditions including reduced polar ice sheets and tropical to super-tropical regions such as existed in the Miocene (5.3 - 23 million years ago) (Figure 5). 
Figure 5. Late Oligocene–Miocene inferred atmospheric CO2 fluctuations and effects on global temperature
based on Stromata index (SI) of 25 and 12 Ma (late Oligocene to late middle Miocene) fossil leaf remains;
(A) Reconstructed late Oligocene–middle Miocene CO2 levels based on individual independently
calibrated tree species; (B) Modeled temperature departure of global mean surface temperature from
present day, calculated from mean CO2 estimates by using a CO2–temperature sensitivity study. Red
discontinuous lines: 2019 CO2-e levels and 2019 temperatures (discounting the aerosol masking effects).
Current greenhouse gas forcing and global mean temperature are approaching Miocene Optimum-like composition, bar the hysteresis effects of reduced ice sheets (Figure 5). Strong temperature polarities are suggested by the contrasts between reduced Antarctic ice sheet and super-tropical conditions in low to mid-latitudes. Land areas would be markedly reduced due to a sea level rise of approximately 40 ± 15 meters.
Andrew Glikson


Dr Andrew Glikson
Earth and climate scientist
Australian National University
Canberra, Australian Territory, Australia
geospec@iinet.net.au

Books:
The Archaean: Geological and Geochemical Windows into the Early Earth
The Asteroid Impact Connection of Planetary Evolution
Asteroids Impacts, Crustal Evolution and Related Mineral Systems with Special Reference to Australia
Climate, Fire and Human Evolution: The Deep Time Dimensions of the Anthropocene
The Plutocene: Blueprints for a Post-Anthropocene Greenhouse Earth
Evolution of the Atmosphere, Fire and the Anthropocene Climate Event Horizon
From Stars to Brains: Milestones in the Planetary Evolution of Life and Intelligence

From Stars to Brains: Milestones in the Planetary Evolution of Life and Intelligence

The Plutocene: Blueprints for a Post-Anthropocene Greenhouse Earth

Added below is a video with an August 6, 2019, interview of Andrew Glikson by Guy McPherson and Kevin Hester, as edited by Tim Bob.