Showing posts with label Paul Beckwith. Show all posts

Wednesday, April 27, 2022

Carbon dioxide crosses 422 ppm

Carbon dioxide (CO₂) reached an average daily concentration of 422.06 ppm on April 26, 2022, at Mauna Loa, Hawaii.


Furthermore, very high methane (CH₄) concentrations were recorded recently at Mauna Loa, Hawaii, with surface flask readings appearing to be as high as 1955 ppb.  


Clouds tipping point

A methane concentration of 1955 ppb corresponds, at a Global Warming Potential (GWP) of 200, with a carbon dioxide equivalent (CO₂e) of 391 ppm. Together with the above daily average CO₂ concentration of 422.06 ppm this adds up to a joint CO₂e of 813.06 ppm, i.e. less than 387 ppm away from the clouds tipping point (at 1200 ppm CO₂e) that on its own could raise the global temperature by 8°C.

Such a 387 ppm CO₂e could be added almost immediately by a burst of seafloor methane less than the size of the methane that is currently in the atmosphere (about 5 Gt). There is plenty of potential for such an abrupt release, given the rising ocean heat and the vast amounts of methane present in vulnerable sediments at the seafloor of the Arctic Ocean, as discussed in posts such as this one.


The 1200 ppm CO₂e clouds tipping point could also be crossed even without such an abrupt seafloor methane release. Carbon dioxide and methane levels are rising rapidly. The above image shows carbon dioxide concentration with a trend added, based on NOAA 1980-2021 mean global annual carbon dioxide data, illustrating how carbon dioxide concentration could cross 750 ppm by the end of the year 2029.

[ see also the importance of methane ]

The above image shows methane concentration with a trend added, based on NOAA 2008-2021 mean global annual methane data, illustrating how methane concentration could cross 4100 ppb by the end of the year 2029 and how methane's impact could cross 820 ppm CO₂e by the end of the year 2029.

As illustrated by the image below, 750 ppm carbon dioxide and 820 ppm CO₂e methane would together yield a joint CO₂e of 1570 ppm and thus would have already raised the global temperature by 8°C due to the clouds feedback much earlier than 2029, while the temperature rise would also have been driven up by the higher carbon dioxide and the methane concentrations. 


Furthermore, nitrous oxide is also rising and there are many further forcers, as discussed at the Extinction page. Altogether, there is the potential for a temperature rise of well over 18°C by 2026, as discussed in an earlier post.

Such high carbon dioxide concentrations could occur due to forest fires causing soils to burn (especially peat soils), which can also add vast amounts of methane to the atmosphere. 

The IPCC does contemplate high carbon dioxide scenarios (see image right), but as discussed in an earlier post, does not mention the clouds tipping point.

High carbon dioxide scenarios typically stop at the year 2100 and rarely do concentrations reach higher than 1200 ppm.

In the image on the right, from a 2020 analysis by Malte Meinshausen et al., the SSP5-8.5 scenario is extended to the year 2300 and a carbon dioxide concentration of well over 2100 ppm is reached around 2240.

In conclusion, there is plenty of scientific consideration of the potential for high concentrations of carbon dioxide and methane to eventuate, but it is typically ignored or waved away as too distant in the future to worry about. 

In other words, what's lacking is analysis of abrupt catastrophic climate change.

Climate change danger assessment

The image below expands risk assessment beyond its typical definition as the product of the severity of impact and probability, by adding a third dimension: timescale.


Water in soil and atmosphere

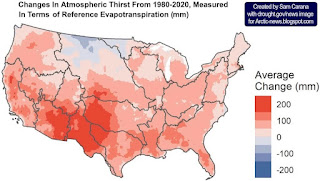
The image on the right, from a news release associated with a recent study, shows changes in atmospheric thirst, measured in terms of reference evapotranspiration from 1980-202 (in mm).

As temperatures rise due to people's emissions, more evaporation will take place over both land oceans, but not all water will return as precipitation, so more water vapor will stay in the air.
[ click on images to enlarge ]
The water-holding capacity of the atmosphere increases by about 7% for every 1°C (1.8°F) rise in temperature, in line with the Clausius–Clapeyron relation

In many cases, this means drier soils and vegetation, making vegetation more vulnerable to pests and diseases, and more prone to fire hazards. 

Water in the soil acts as a buffer, slowing down the temperature rise, so drier soil will heat up faster and further, causing land surface temperatures to rise even more and amplifying the impact of Urban heat island and Heat dome phenomena.

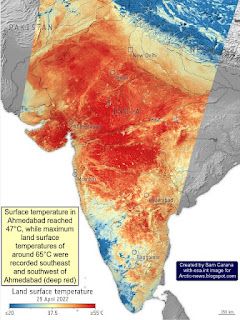
The image on the right, adapted from ESA, shows land surface temperatures as high as 65°C (149°F) in India on April 26, 2022. Note that land surface temperatures can be substantially higher than air temperatures. 

As temperatures rise, extreme weather events increase in frequency and intensity. The duration of extreme weather events can also increase, due to blocked weather patterns resulting from changes to the Jet Stream.

This contributes to shortages in food and water supplies. As long as glaciers are melting in the mountains, rivers will keep supplying some water, but the snow and ice cover is disappearing rapidly around the globe. 

The image on the right shows that food prices have risen strongly over the past few years and extreme weather events resulting from the global temperature rise have strongly contributed to the price rise. 

Further contributing to this rise is the rising demand for fertilizers that are currently all too often produced with fossil fuel, as political will to produce food in better ways remains lacking. 

Heat stress

Another issue is humidity. The more water vapor there is in the air, the harder temperature peaks are to bear.

The human body can cool itself by sweating, which has a physiological limit that is often described as a 35°C wet-bulb temperature

A 2020 study (by Raymond et al.) warned that this limit could be regularly exceeded with a temperature rise of less than 2.5°C (compared to pre-industrial).

Meanwhile, recent research found that in practice the limit will typically be lower and depending on circumstances could be as low as a wet-bulb temperature of 25°C.

In the video below, Paul Beckwith discusses the danger of combined high heat and humidity. 


In the video below, Guy McPherson also discusses the danger of combined high heat and humidity. 


Extinction

A 2018 study (by Strona & Bradshaw) indicates that most life on Earth will disappear with a 5°C rise. Humans, who depend for their survival on many other species, will likely go extinct with a 3°C rise, as illustrated by the image below, from an earlier post.


Conclusion

This further highlights the imminence of the danger and adds further urgency to the call for immediate, comprehensive and effective action, as described in the Climate Plan.


Links

• NOAA - Global Monitoring Laboratory, Recent Daily Average CO₂ at Mauna Loa, Hawaii, U.S. 
• NOAA - Global Monitoring Laboratory, Methane (surface flasks) at Mauna Loa, Hawaii, U.S. 
• The Importance of Methane
https://arctic-news.blogspot.com/p/the-importance-of-methane-in-climate.html

• Clouds feedback and tipping point
https://arctic-news.blogspot.com/p/clouds-feedback.html

• NOAA - Globally averaged marine surface annual mean carbon dioxide data
https://gml.noaa.gov/webdata/ccgg/trends/co2/co2_annmean_gl.txt

• NOAA - Globally averaged marine surface annual mean methane data
https://gml.noaa.gov/webdata/ccgg/trends/ch4/ch4_annmean_gl.txt

• NOAA - Mauna Loa CO2 weekly mean and historical comparisons
https://gml.noaa.gov/webdata/ccgg/trends/co2/co2_weekly_mlo.txt

• Methane rise is accelerating

• Runaway temperature rise by 2026?
• Extinction
https://arctic-news.blogspot.com/p/extinction.html

• Shortcomings of IPCC AR6 WGIII - Mitigation of Climate Change
https://arctic-news.blogspot.com/2022/04/shortcomings-of-ipcc-ar6-wgiii-mitigation-of-climate-change.html

• NOAA Mauna Loa CO₂ annual mean data
https://gml.noaa.gov/ccgg/trends/data.html

• NOAA globaly averaged marine surface annual mean methane data
https://gml.noaa.gov/ccgg/trends_ch4

• Is the IPCC creating false perceptions, again?
https://arctic-news.blogspot.com/2021/08/is-the-ipcc-creating-false-perceptions-again.html

• The shared socio-economic pathway (SSP) greenhouse gas concentrations and their extensions to 2500 - by Malte Meinshausen et al. 
https://gmd.copernicus.org/articles/13/3571/2020

• Clausius–Clapeyron relation

• Heat dome
https://en.wikipedia.org/wiki/Heat_dome

• ESA - Heatwave across India
https://www.esa.int/ESA_Multimedia/Images/2022/04/Heatwave_across_India

• Evaporative Demand Increase Across Lower 48 Means Less Water Supplies, Drier Vegetation, and Higher Fire Risk
https://www.drought.gov/news/evaporative-demand-increase-across-lower-48-means-less-water-supplies

• A Multidataset Assessment of Climatic Drivers and Uncertainties of Recent Trends in Evaporative Demand across the Continental United States - by Christine Albano et al.
https://journals.ametsoc.org/view/journals/hydr/23/4/JHM-D-21-0163.1.xml

• It could be unbearably hot in many places within a few years time
https://arctic-news.blogspot.com/2016/07/it-could-be-unbearably-hot-in-many-places-within-a-few-years-time.html

• The emergence of heat and humidity too severe for human tolerance - by Colin Raymond et al.
https://www.science.org/doi/10.1126/sciadv.aaw1838

• Evaluating the 35°C wet-bulb temperature adaptability threshold for young, healthy subjects (PSU HEAT Project) - by Daniel Vecellio et al.
https://pennstate.pure.elsevier.com/en/publications/evaluating-the-35c-wet-bulb-temperature-adaptability-threshold-fo

• Co-extinctions annihilate planetary life during extreme environmental change, by Giovanni Strona and Corey Bradshaw (2018)
https://www.nature.com/articles/s41598-018-35068-1

• Jet Stream
https://arctic-news.blogspot.com/p/jet-stream.html

• When Will We Die?
https://arctic-news.blogspot.com/2019/06/when-will-we-die.html

• Climate Plan
https://arctic-news.blogspot.com/p/climateplan.html


Friday, January 15, 2021

2020: Hottest Year On Record

NASA data show that 2020 was the hottest year on record.


The image below shows that high temperature in 2020 hit Siberia and the Arctic Ocean.

In above images, the temperature anomaly is compared to 1951-1980, NASA's default baseline. When using an earlier baseline, the data need to be adjusted. The image below shows a trendline pointing at an 0.31°C adjustment for a 1900 baseline. 


Additional adjustment is needed when using a 1750 baseline, while it also makes sense to add further adjustment for higher polar anomalies and for air temperatures over oceans, rather than sea surface water temperatures. In total, a 0.78°C adjustment seems appropriate, as has been applied before, such as in this analysis. For the year 2020, this translates in a temperature rise of 1.8029°C versus the year 1750.

Three trends: blue, purple and red

Will the global temperature rise to 3°C above 1750 by 2026? The blue trend below is based on 1880-2020 NASA Land+Ocean data and adjusted by 0.78°C to reflect a 1750 baseline, ocean air temperatures and higher polar anomalies, and it crosses a 3°C rise in 2026.


The trend shows a temperature for 2020 that is slightly higher than indicated by the data. This is in line with the fact that we're currently in a La Niña period and that we're also at a low point in the sunspot cycle, as discussed in an earlier post. The blue trend also shows that the 1.5°C treshold was already crossed even before the Paris Agreement was accepted. 


The second (purple) trend is based on a shorter period, i.e. 2006-2020 NASA land+ocean (LOTI) data, again adjusted by 0.78°C to reflect a 1750 baseline, ocean air temperatures and higher polar anomalies. The trend approaches 10°C above 1750 by 2026. The trend is based on 15 years of data, making it span a 30-year period centered around end 2020 when extended into the future for a similar 15 year period. The trend approaches 10°C above 1750 in 2026.

The trend is displayed on the backdrop of an image from an earlier post, showing how a 10°C rise could eventuate by 2026 when adding up the impact of warming elements and their interaction.


The stacked bars are somewhat higher than the trend. Keep in mind that the stacked bars are for the month February, when anomalies can be significantly higher than the annual average.

Temperature rise for February 2016 versus 1900.
In the NASA image on the right, the February 2016 temperature was 1.70°C above 1900 (i.e. 1885-1914). In the stacked-bar analysis, the February 2016 rise from 1900 was conservately given a value of 1.62°C, which was extended into the future, while an additional 0.3°C was added for temperature rise from pre-industrial to 1900.

Later analyses such as this one also added a further 0.2°C to the temperature rise, to reflect ocean air temperatures (rather than water temperatures) and higher polar anomalies (note the grey areas on the image in the right).

Anyway, the image shows two types of analysis on top of each other, one analysis based on trend analysis and another analysis based on a model using high values for the various warming elements. The stacked-bar analysis actually doesn't reflect the worst-case scenario, an even faster rise is illustrated by the next trend, the red line.

The third (red) trend suggests that we may have crossed the 2°C treshold in the year 2020. The trend is based on a recent period (2009-2020) of the NASA land+ocean data, again adjusted by 0.78°C to reflect a 1750 baseline, ocean air temperatures and higher polar anomalies.


Where do we go from here? 

It's important to acknowledge the danger of acceleration of the temperature rise over the next few years. The threat is illustrated by the image below and shows up most prominently in the red trend. 


Of the three trends, the red trend is based on the shortest period, and it does indicate that we have aready crossed the 2°C treshold and we could be facing an even steeper temperature rise over the next few years.

We're in a La Niña period and we're also at a low point in the sunspot cycle. This suppresses the temperature somewhat, so the 2020 temperature should actually be adjusted upward to compensate for such variables. Importantly, while such variables do show up more when basing trends on shorter periods, the data have not be adjusted for this in this case, so the situation could actually be even worse. 

At a 3°C rise, humans will likely go extinct, while most life on Earth will disappear with a 5°C rise, and as the temperature keeps rising, oceans will evaporate and Earth will go the same way as Venus, a 2019 analysis warned. 

Dangerous acceleration of the temperature rise 

There are many potential causes behind the acceleration of the temperature rise, such as the fact that the strongest impact of carbon dioxide is felt ten years after emission, so we are yet to experience the full wrath of the carbon dioxide emitted over the past decade. However, this doesn't explain why 2020 turned out to be the hottest year on record, as opposed to - say - 2019, given that in 2020 carbon dioxide emissions were 7% lower than in 2019.

James Hansen confirms that the temperature rise is accelerating, and he points at aerosols as the cause. However, most cooling aerosols come from industries such as smelters and coal-fired power plants that have hardly reduced their operations in 2020, as illustrated by the image below, from the aerosols page


Above image shows that on December 17, 2020, at 10:00 UTC, sulfate aerosols (SO₄) were as high as 6.396 τ at the green circle. Wind on the image is measured at 850 hPa.

Could the land sink be decreasing? A recent study shows that the mean temperature of the warmest quarter (3-month period) passed the thermal maximum for photosynthesis during the past decade. At higher temperatures, respiration rates continue to rise in contrast to sharply declining rates of photosynthesis. Under business-as-usual emissions, this divergence elicits a near halving of the land sink strength by as early as 2040. While this is a frightening prospect, it still doesn't explain why 2020 turned out to be the hottest year on record. 

Oceans are taking up less heat, thus leaving more heat in the atmosphere. The danger is illustrated by the image below. 


The white band around -60° (South) indicates that the Southern Ocean has not yet caught up with global warming, featuring low-level clouds that reflect sunlight back into space. Over time, the low clouds will decrease, which will allow more sunlight to be absorbed by Earth and give the world additional warming. A recent study finds that, after this 'pattern effect' is accounted for, committed global warming at present-day forcing rises by 0.7°C. While this is very worrying, it still doesn't explain why 2020 turned out to be the hottest year on record. 

Ocean stratification contributes to further surface warming, concludes another recent study
"The stronger ocean warming within upper layers versus deep water has caused an increase of ocean stratification in the past half century. With increased stratification, heat from climate warming less effectively penetrates into the deep ocean, which contributes to further surface warming. It also reduces the capability of the ocean to store carbon, exacerbating global surface warming. Furthermore, climate warming prevents the vertical exchanges of nutrients and oxygen, thus impacting the food supply of whole marine ecosystems."
"By uptaking ~90% of anthropogenic heat and ~30% of the carbon emissions, the ocean buffers global warming. [The] ocean has already absorbed an immense amount of heat, and will continue to absorb excess energy in the Earth’s system until atmospheric carbon levels are significantly lowered. In other words, the excess heat already in the ocean, and heat likely to enter the ocean in the coming years, will continue to affect weather patterns, sea level, and ocean biota for some time, even under zero carbon emission conditions."
Many feedbacks are starting to kick in with greater ferocity, with tipping points threatening to get crossed or already crossed, such as the latent heat tipping point, i.e. loss of the ocean heat buffer, as Arctic sea ice keeps getting thinner. As the above map also shows, the temperature rise is hitting the Arctic Ocean particularly hard. At least ten tipping points are affecting the Arctic, including the latent heat tipping point and the methane hydrates tipping point, as illustrated by the image below.
 
[ from an earlier post ]

A combination of higher temperatures and the resulting feedbacks such as stronger ocean stratification, stronger wind, decline of Arctic snow and ice and a distorted Jet Stream is threatening to cause formation of a lid at the surface of the North Atlantic Ocean that enables more heat to move to the Arctic Ocean. This could cause huge amounts of methane to erupt from the seafloor, thus contributing to cause the 1,200 ppm CO₂e cloud tipping point to get crossed, resulting in an extra 8°C rise, as an earlier post and a recent post warned.

Dangerous acceleration of the temperature rise

The danger is that methane is erupting in the Arctic from the seafloor and that this increasingly contributes to methane reaching the stratosphere. 

While methane initially is very potent in heating up the atmosphere, it is generally broken down relatively quickly, but in the atmosphere over the Arctic, there is very little hydroxyl to break down the methane. 

Methane also persists much longer in the stratosphere, which contributes to its accumulation there. 


Large amounts of methane may already be erupting from the seafloor of the Arctic Ocean, rising rapidly and even reaching the stratosphere

This danger is getting little public attention. The NOAA image on the right shows the globally-averaged, monthly mean atmospheric methane abundance derived from measurements from marine surface sites. Measurements that are taken at sea level do not reflect methane very well that is rising up from the seafloor of the Arctic Ocean, especially where the methane rises up high in plumes. 

Satellite measurements better reflect the danger. The image on the right shows that the MetOp-1 satellite recorded peak methane levels as high as 2715 ppb at 469 mb on the morning of January 6, 2021. 

Most of the high (magenta-colored) levels of methane are located over oceans and a lot of them over the Arctic Ocean. 

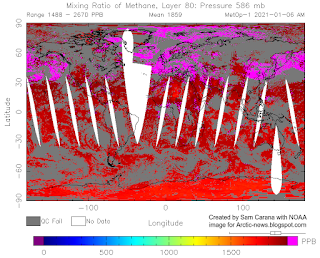
The next image on the right shows the situation closer to sea level, at 586 mb, where even less of the high levels of methane show up over land, indicating that the methane originated from the seafloor. 

The third image on the righ shows the situation even closer to sea level, at 742 mb, and almost all high levels of methane show up over the Arctic Ocean and over areas where the Atlantic Ocean and the Pacific Ocean border on the Arctic. 

Because methane is lighter than air and much lighter than water, methane erupting from the seafloor will quickly rise up vertically. While much of the methane that is released from the seabed can get broken down in the water by microbes, methane that is rising rapidly and highly concentrated in the form of plumes will leave little opportunity for microbes to break it down in the water column, especially where waters are shallow,
as is the case in much of the Arctic Ocean.

As methane hydrates destabilize, methane will erupt with an explosive force, since methane is highly compressed inside the hydrate (1 m³ of methane hydrate can release 160 m³ of gas). Such eruptions can destabilize further hydrates located nearby. Because of this explosive force, plumes of methane can rise at high speed through the water column. 

Because methane is so much lighter than water, large methane releases from the seafloor will form larger bubbles that merge and stick together, developing more thrust as they rise through the water.

Because of this thrust, methane plumes will keep rising rapidly after entering the atmosphere, and the plumes will more easily push away aerosols and gases that slow down the rise in the air of methane elsewhere, such as where methane is emitted by cows. 

A further image of another satellite is added on the right. The N2O satellite recorded methane levels as high as 2817 ppb at 487 mb on the morning of January 10, 2021. 

Such sudden and very high peaks can hardly be caused by agriculture or wetlands, but instead they are likely caused by destabilization of methane hydrates in sediments at the seafloor. 

Further contributing to the danger is the fact that little hydroxyl is present in the atmosphere over the Arctic, so it is much harder for this methane to get broken down in the air over the Arctic, compared to methane emissions elsewhere. 

Finally, the edge of the stratosphere is much lower over the Arctic, as discussed in an earlier post.

All this makes that methane that is erupting from the seafloor of the Arctic Ocean is more prone to accumulate in the stratosphere. Once methane is in the stratosphere, it's unlikely that it will come back into the troposphere.

The IPCC AR5 (2013) gave methane a lifetime of 12.4 years. The IPCC TAR (2001) gave stratospheric methane a lifetime of 120 years, adding that less than 7% of methane did reach the stratosphere at the time. According to IPCC AR5, of the methane that gets broken down by hydroxyl in the atmosphere, some 8.5% got broken down in the stratosphere.

Conclusions

The situation is dire and calls for immediate, comprehensive and effective action as described in the Climate Plan.

In the video below, Paul Beckwith discusses the situation: 


For another perspective, Guy McPherson discusses the situation in the video below, Edge of Extinction: Maybe I’m Wrong


Links

• Climate Plan
https://arctic-news.blogspot.com/p/climateplan.html

• NASA Global Land-Ocean Temperature Index
https://data.giss.nasa.gov/gistemp

• What are El Niño and La Niña?
https://oceanservice.noaa.gov/facts/ninonina.html

• Multivariate El Niño/Southern Oscillation (ENSO) Index Version 2 (MEI.v2)
https://psl.noaa.gov/enso/mei 
 
• Temperatures keep rising
https://arctic-news.blogspot.com/2020/12/temperatures-keep-rising.html

• There is no time to lose
https://arctic-news.blogspot.com/2020/11/there-is-no-time-to-lose.html

• Possible climate transitions from breakup of stratocumulus decks under greenhouse warming, by Tapio Schneider et al. (2019)
https://www.nature.com/articles/s41561-019-0310-1

• A rise of 18°C or 32.4°F by 2026?

• Greater committed warming after accounting for the pattern effect - by Chen Zhou et al. 

• Upper Ocean Temperatures Hit Record High in 2020 - by Lijing Cheng et al. 
https://link.springer.com/article/10.1007/s00376-021-0447-x

• How close are we to the temperature tipping point of the terrestrial biosphere? - by Katharyn Duffy et al.
https://advances.sciencemag.org/content/7/3/eaay1052

• Methane hydrates tipping point threatens to get crossed

• Temperatures threaten to become unbearable

• Cold freshwater lid on North Atlantic

• Aerosols

• NOAA - Trends in Atmospheric Methane
https://www.esrl.noaa.gov/gmd/ccgg/trends_ch4

•  COVID-19 lockdown causes unprecedented drop in global CO2 emissions in 2020 - Gobal Carbon Project
https://www.globalcarbonproject.org/carbonbudget/20/files/International_FutureEarth_GCB2020.pdf

• Global Average Temperatures in 2020 Reached a RECORD HIGH of 1.55 C above PreIndustrial in 1750 - by Paul Beckwith 
https://www.youtube.com/watch?v=O0lgTAEUYyA

• Edge of Extinction: Maybe I’m Wrong - by Guy McPherson
https://guymcpherson.com/2021/01/edge-of-extinction-maybe-im-wrong

• Extinction
https://arctic-news.blogspot.com/p/extinction.html


Wednesday, July 8, 2020

Arctic Sea Ice at Record Low for Time of Year

As temperatures keep rising, should the IPCC raise the alarm?


Some 1,750 jurisdictions in 30 countries have now declared a climate emergency, according to this post dated July 8, 2020. The United Nations does acknowledge the Climate Emergency, but its description is sourced from the IPCC Global Warming of 1.5°C report that was approved back in 2018. A lot has happened since, as described in many posts at Arctic-news. When a state of emergency is declared, doesn't one expect such a declaration to result in action, complete with updates on the effectiveness of the action?

Described below are some events taking place right now.

Arctic Sea Ice at Record Low for Time of Year

Arctic sea ice looks set to reach an all-time record low in September 2020.


In an earlier post, Paul Beckwith describes a Blue Ocean Event (BOE) and some of the consequences of the changes taking place in the Arctic. A BOE occurs when sea ice extent gets below 1 million km², which is important regarding the amount of sunlight absorbed/reflected in the Arctic (albedo feedback).

[ from earlier post ]
Arctic sea ice extent on July 20, 2020, was well below the minimum of the 1979-1990 average (the orange line among the blue lines on the image below).


If it continues on its current trajectory, Arctic sea ice may well be gone altogether in September 2020.


A BOE is one of the many tipping points that threaten to get crossed in the Arctic.

[ click on images to enlarge ]
As illustrated by the image on the right, sea ice is getting very thin, which threatens the latent heat tipping point to be crossed, meaning there is no buffer of sea ice left underneath the surface of the sea ice to absorb ocean heat.

Furthermore, the temperature rise in the Arctic is accelerating and the Arctic Ocean is getting very hot, threatening that the methane hydrates tipping point will get crossed.

The navy.mil animation below run on July 20, 2020, shows the fall in sea ice thickness over 30 days (last 8 frames are forecasts for July 21-28, 2020).


The combination image below illustrates the speed at which Arctic sea ice is disappearing, with sea ice thickness shown in meters from left to right at June 1, June 18, July 1 and July 18, 2020.


Meanwhile, fires and smoke are visible at a distance of as little as 1970 km or 1224 miles from the North Pole.


The image below shows open water on the edge of the sea ice, north of Greenland and the Canadian Archipelago, where the thickest sea ice used to be located.


Alarming acceleration of heating continues

The image below shows the global temperature rise through to June 2020.
[ click on images to enlarge ]
The red trend supports fears that the 2°C above preindustrial threshold has already been crossed this year, while loss of the aerosol masking effect and an emerging El Niño could trigger a huge further temperature rise.

Global temperature anomalies are typically lower in June (yellow circles) than the annual anomaly. The Copernicus image below shows twelve-month averages of global-mean surface air temperature anomalies relative to 1981-2010.

The shape of current anomalies is very similar to the peak reached around 2016. This is alarming because the peak around 2016 was reached under El Niño conditions, whereas the current temperatures are reached under conditions that are leaning toward La Niña, as illustrated by the images below.


In conclusion, one may wonder how much stronger the temperature rise will be once El Niño conditions do arrive.

[ click on images to enlarge ]
Furthermore, one may wonder how much current temperatures are elevated by a decrease in emissions due to COVID-19 restrictions, which in turn makes one wonder how much higher the temperature will be when the aerosol masking effect will fall away even further as the world phases out coal-fired power plants, bunker oil for shipping, etc. Guy McPherson concludes that a 1°C rise in global-average temperature will occur within a few days or weeks after industrial activity is reduced by as little as 20%.

Very high sea surface temperature anomalies in the Arctic Ocean

Sea surface temperature anomalies in the Arctic Ocean are very high. As discussed in a recent post, sea surface temperatures in the Bering Strait were as much as 15.1°C or 27.2°F hotter than 1981-2011 on June 20, 2020 (in Norton Sound, Alaska, at the green circle).


As the image below shows, the sea surface temperature at green circle used to be 0.3°C (32.6°F). It was 12°C (53.6°F) on July 18, 2020.


Much of the Arctic Ocean is quite shallow, making that the water can warm up very quickly during summer heat peaks and heat can reach the seafloor, which comes with the risk that heat will penetrate cracks in sediments at the seafloor. Melting of ice in such cracks can lead to abrupt destabilization of methane hydrates contained in sediments.

Very high peak methane levels

Ominously, as the 2020 Siberian heatwave continues, very high peak methane levels show up over the Arctic Ocean. The NOAA 20 satellite recorded a peak methane level of 2728 ppb at 399 mb on the afternoon of July 16, 2020.


The MetOp-1 satellite recorded a peak methane level of 2726 ppb on the afternoon of July 16, 2020. Also, a mean methane level of 1897 ppb was recorded at 469 mb and a mean methane level of 1908 ppb at 293 mb.

The situation is dire and calls for immediate, comprehensive and effective action, as described in the Climate Plan.


Links

• Arctic Data archive System
https://ads.nipr.ac.jp/vishop/vishop-extent.html

• Polar Portal - sea ice volume
http://polarportal.dk/en/sea-ice-and-icebergs/sea-ice-thickness-and-volume

• Fast Path to Extinction
https://arctic-news.blogspot.com/2020/06/fast-path-to-extinction.html

• NASA Worldview
https://worldview.earthdata.nasa.gov

• Surface air temperature for June 2020
https://climate.copernicus.eu/surface-air-temperature-june-2020

• ENSO: Recent Evolution, Current Status and Predictions - NOAA, July 6, 2020
https://www.cpc.ncep.noaa.gov/products/analysis_monitoring/lanina/enso_evolution-status-fcsts-web.pdf

• Arctic Hit By Ten Tipping Points
https://arctic-news.blogspot.com/2020/04/arctic-hit-by-ten-tipping-points.html

• The Myth of Sustainability - by Guy McPherson
https://opastonline.com/wp-content/uploads/2020/07/the-myth-of-sustainability-eesrr-20.pdf

• 2020 Siberian Heatwave continues
https://arctic-news.blogspot.com/2020/06/2020-siberian-heatwave-continues.html

• Climate Plan
https://arctic-news.blogspot.com/p/climateplan.html


Sunday, November 17, 2019

Arctic Ocean November 2019


On November 16, 2019, there was little sea ice between Greenland and Svalbard. For reference, the image below has been added, showing coastlines for the same area.


The image on the right shows that the average air temperature (2 m) on November 15, 2019, was 4°C higher over the Arctic than during 1979-2000.
Ocean heat is rising up from the Arctic Ocean, while a wavy jet stream enables cold air to leave the Arctic and descend over North America and Eurasia. On November 13, 2019, it was warmer in Alaska than in Alabama.

The image below shows temperatures north of 80°N. The red line on the image shows the 2019 daily mean temperature up to November 16, 2019. The temperature is now well above the 1958-2002 mean (green line). The image also shows the freezing point of fresh water (273.15K, 0°C or 32°F, blue line).

The freezing point for salt water is lower, at around -2°C, or 28.4°F, or 271.2°K. In other words, a rise in the salt content of the water alone can make ice melt, i.e. even when the temperature of the water doesn't rise.


The image below shows that Arctic sea ice volume has been at record low levels for the time of year for some time.


As the image below shows, Arctic sea ice extent in the Chukchi Sea is currently very low.

[ image by Zack Labe, uploaded November 13, 2019 ]
Oceans are absorbing more than 90% of global heating, as illustrated by the image below.


Arctic sea ice used to absorb 0.8% of global heating (in 1993 to 2003). Ocean heat keeps flowing into the Arctic Ocean, carried by ocean currents, as illustrated by the image below.


As peak heat arrives in the Arctic Ocean, it melts sea ice from below. In Summer 2019, a critical tipping point was crossed; ocean heat could no longer find further sea ice to melt, as the thick sea ice that hangs underneath the surface had disappeared. A thin layer of sea ice at the surface was all that remained, as air temperatures remained low enough to prevent it from melting from above.


This indicates that the buffer has gone that has until now been consuming ocean heat as part of the melting process. As long as there is sea ice in the water, this sea ice will keep absorbing heat as it melts, so the temperature will not rise at the sea surface. The amount of energy absorbed by melting ice is as much as it takes to heat an equivalent mass of water from zero to 80°C.


The images above and below shows very high sea surface temperature anomalies on the Northern Hemisphere for October 2015 and October 2019. In both cases, anomalies of 1.09°C or 1.96°F above the 20th century average were recorded.

The October 2015 anomaly occurred under El Niño conditions, whereas the equally-high anomaly in October 2019 occurred under El Niño/La Niña-neutral conditions, while another El Niño is likely to come in 2020. In other words, the threat is that even more ocean heat is likely to arrive in the Arctic Ocean in 2020.


The danger is particularly high in October, as Arctic sea ice starts growing in extent at the end of September, thus sealing off the water, meaning that less ocean heat will be able to escape to the atmosphere. This increases the danger that hot water will reach sediments at the Arctic Ocean seafloor and trigger massive methane eruptions.


Concentrations of carbon dioxide (CO₂, 407.8 ppm), methane (CH₄, 1869 ppb) and nitrous oxide (N₂O, 331.1 ppb) in 2018 surged by higher amounts than during the past decade, the WMO said in a recent news release and as illustrated by the image on the right, which shows that CH₄, CO₂ and N₂O levels in the atmosphere in 2018 were, respectively, 259%, 147% and 123% of their pre-industrial (before 1750) levels.

“There is no sign of a slowdown, let alone a decline, in greenhouse gases concentration in the atmosphere despite all the commitments under the Paris Agreement on Climate Change,” said WMO Secretary-General Petteri Taalas.

“It is worth recalling that the last time the Earth experienced a comparable concentration of CO2 was 3-5 million years ago. Back then, the temperature was 2-3°C warmer, sea level was 10-20 meters higher than now,” said Mr Taalas.

Global methane levels are very high. Mean global methane levels were as high as 1914 parts per billion on September 3, 2019, as discussed in a recent post. Peak methane levels as high as 2961 parts per billion were recorded by the MetOp-2 satellite on October 24, 2019, in the afternoon at 469 mb.

The situation is dire and calls for comprehensive and effective action, as described in the Climate Plan.

In the video below, Paul Beckwith discusses Arctic sea ice.


Links

• Climate Plan
https://arctic-news.blogspot.com/p/climateplan.html

• It’s warmer in Alaska than in Alabama today
https://www.al.com/news/2019/11/its-warmer-in-alaska-than-in-alabama-today.html

• 100 weather observing stations across the U.S. are forecast to tie or break their record low temperatures
https://twitter.com/NWS/status/1194381679483375616

• NOAA - Global Heat Content
https://www.nodc.noaa.gov/OC5/3M_HEAT_CONTENT

• Where is global warming going? | by John Cook (2010)
https://skepticalscience.com/Where-is-global-warming-going.html

• Danish Meteorological Institute - Daily mean temperatures for the Arctic area north of the 80th northern parallel
http://ocean.dmi.dk/arctic/meant80n.uk.php

• Polar portal - Sea Ice Thickness and Volume
http://polarportal.dk/en/sea-ice-and-icebergs/sea-ice-thickness-and-volume

• WMO - Greenhouse gas concentrations in atmosphere reach yet another high
https://public.wmo.int/en/media/press-release/greenhouse-gas-concentrations-atmosphere-reach-yet-another-high

• 2020 El Nino could start 18°C temperature rise
https://arctic-news.blogspot.com/2019/11/2020-el-nino-could-start-18-degree-temperature-rise.html

• Critical Tipping Point Crossed In July 2019
https://arctic-news.blogspot.com/2019/09/critical-tipping-point-crossed-in-july-2019.html

• IPCC Report Ocean and Cryosphere in a Changing Climate
https://arctic-news.blogspot.com/2019/09/ipcc-report-ocean-and-cryosphere-in-a-changing-climate.html

• Most Important Message Ever
https://arctic-news.blogspot.com/2019/07/most-important-message-ever.html

• When will we die?
https://arctic-news.blogspot.com/2019/06/when-will-we-die.html

• Arctic Ocean overheating
https://arctic-news.blogspot.com/2019/09/arctic-ocean-overheating.html

• How extreme will it get?
https://arctic-news.blogspot.com/2012/07/how-extreme-will-it-get.html

• Warning Signs
https://arctic-news.blogspot.com/2018/03/warning-signs.html