
The above image shows a forecast for August 2023 of the sea surface temperature anomaly in degrees Celsius, from tropicaltidbits.com. The forecast shows temperatures that are higher than average (based on 1984-2009 model climatology) for the tropical Pacific region indicative of an El Niño event.


By comparison, the above nullschool.net image shows the sea surface temperature anomaly for August 15, 2022, i.e. less than three months ago, when sea surface temperature anomalies in the tropical Pacific region were similar to what they are now, while anomalies in the Arctic were much higher than they are now.
Moving from the bottom of the current La Niña to the peak of a strong El Niño could make a difference of more than half a degree Celsius, as indicated by the image below, adapted from NOAA.


The NOAA image on the right confirms that we're still in the depths of a persistent La Niña. NOAA predicts a transition out of La Niña from now on. Note that the NOAA forecast goes up to June/July/August 2023.
Sunspots
The upcoming El Niño looks set to coincide with a peak in sunspots. The peak in sunspots looks set to reach a higher than expected maximum impact around July 2025. An analysis in an earlier post concludes that the rise in sunspots from May 2020 to July 2025 could make a difference of some 0.15°C.
Accordingly, the impact of the upcoming El Niño could make a difference of more than 0.5°C over the next few years. In addition, there will be a growing impact of sunspots, forecast to peak in July 2025.
Methane keeps rising at accelerating pace
Furthermore, there are a number of events and developments that could additionally speed up the temperature rise, including greenhouse gas emissions that keep rising. Methane is particularly important, due to its high potency as a greenhouse gas, and its abundance has also been growing at accelerating pace over the past few years.

The above image, adapted from Copernicus, shows a forecast for November 14, 2022, 03 UTC at 500 hPa, with high levels of methane showing up over the Arctic.

The above image shows a peak methane level of 2687 ppb (parts per billion) recorded by the NOAA-20 satellite at 399.1 mb on November 3, 2022 AM.

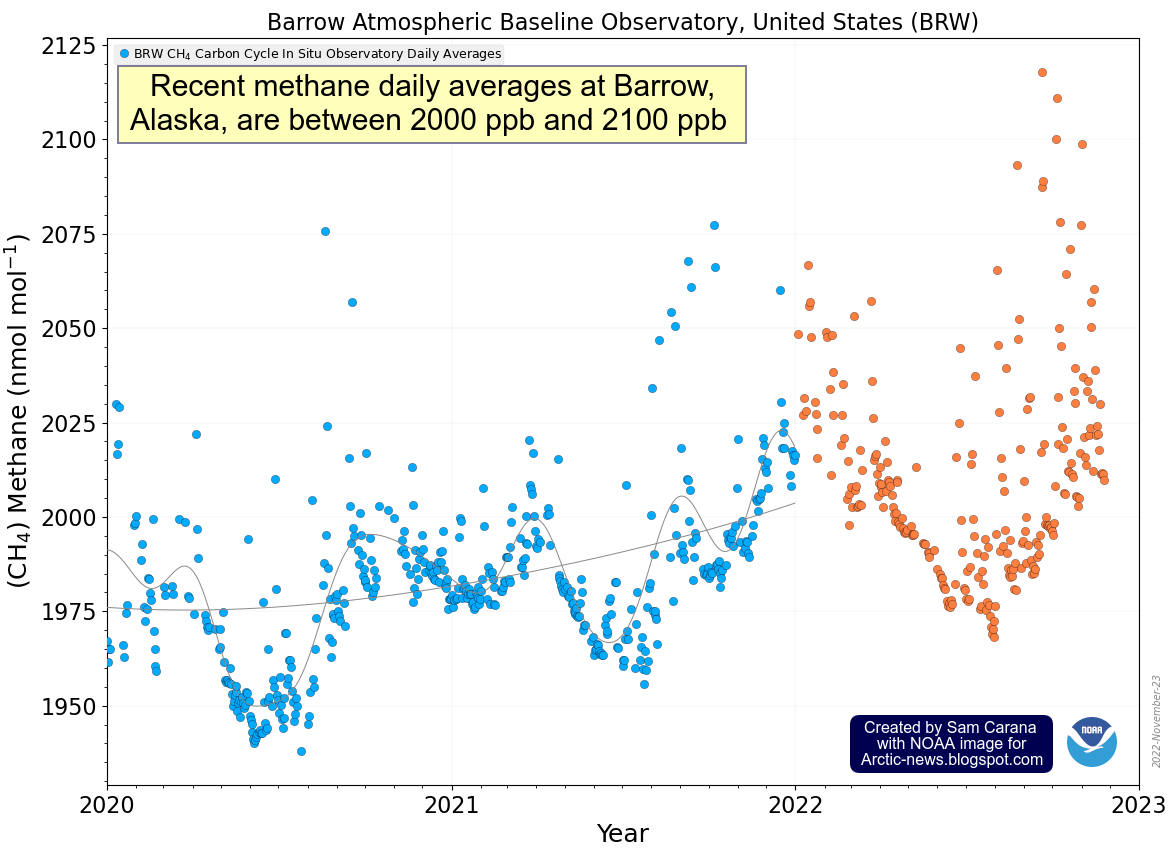
The above image shows that recent methane daily averages at Barrow, Alaska are even higher, between 2000 ppb and 2100 ppb.
Very threatening is a rise in methane that kept following the trend depicted in the above image, created with WMO 2015-2021 global annual surface mean methane abundances, with an added trend that points at a potential mean global abundance of methane of more than 700 ppm (parts per million) CO₂e by the end of 2026. The image warns that, if such a trend kept continuing, the clouds tipping point could be crossed as a result of the forcing of methane alone.
The rise in methane is alarming and further greenhouse gases also keep rising, such as nitrous oxide, water vapor and carbon dioxide, due to high emissions by people and due to feedbacks that are kicking in, such as forest and waste fires, flooding and further extreme weather events, permafrost loss in the Arctic and reduced carbon sinks. Furthermore, maximum warming occurs about one decade after a carbon dioxide emission, so the full warming wrath of the carbon dioxide emitted over the past decade is still to come, and an extra 0.5°C rise by 2026 seems possible due to carbon dioxide alone.
As an earlier post mentions, the upcoming temperature rise on land on the Northern Hemisphere could be so high that it will cause much traffic, transport and industrial activity to grind to a halt, resulting in a reduction in aerosols that are currently masking the full wrath of global warming.
The post points at a recent analysis that finds a stronger impact than previously thought for liquid water path adjustment, which supports the 2016 warning that by 2026 there could be a 1.9°C temperature rise due to a decrease in cooling aerosols, while there could be additionally be a 0.6°C temperature rise due to an increase in warming aerosols and gases as a result of more biomass and waste burning and forest fires by 2026.
 |
| [ from earlier post ] |
Further events and developments that could speed up the temperature rise
 |
| [ see the Extinction page ] |
When including further events and developments, the clouds tipping point could be crossed in a matter of years and even with far less methane than the above trend warns about.
As an earlier post mentions, the upcoming temperature rise on land on the Northern Hemisphere could be so high that it will cause much traffic, transport and industrial activity to grind to a halt, resulting in a reduction in aerosols that are currently masking the full wrath of global warming.
The post points at a recent analysis that finds a stronger impact than previously thought for liquid water path adjustment, which supports the 2016 warning that by 2026 there could be a 1.9°C temperature rise due to a decrease in cooling aerosols, while there could be additionally be a 0.6°C temperature rise due to an increase in warming aerosols and gases as a result of more biomass and waste burning and forest fires by 2026.
Furthermore, the 2016 analysis warns about an additional temperature rise of up to 1.6°C due to loss of Arctic sea ice and permafrost, and associated changes.
When including the temperature rise that has already unfolded from pre-industrial and the impact of all such events and developments, the temperature could rise by more than 10°C over the next few years, corresponding with a CO₂e of over 1200 ppm, which implies that the total temperature rise could be as high as 18.44°C by 2026.
When including the temperature rise that has already unfolded from pre-industrial and the impact of all such events and developments, the temperature could rise by more than 10°C over the next few years, corresponding with a CO₂e of over 1200 ppm, which implies that the total temperature rise could be as high as 18.44°C by 2026.
Keep in mind that humans are likely to go extinct with a rise of 3°C, as illustrated by the image below, from an analysis discussed in an earlier post.

The situation is dire and the right thing to do now is to help avoid or delay the worst from happening, through action as described in the Climate Plan.
Links
• The Clouds Feedback and the Clouds Tipping Point
https://arctic-news.blogspot.com/p/clouds-feedback.html
• Pre-industrial
https://arctic-news.blogspot.com/p/pre-industrial.html
• Invisible ship tracks show large cloud sensitivity to aerosol - by Peter Manhausen et al.
https://www.nature.com/articles/s41586-022-05122-0
• Extinction
https://arctic-news.blogspot.com/p/extinction.html
The situation is dire and the right thing to do now is to help avoid or delay the worst from happening, through action as described in the Climate Plan.
Links
• Tropicaltidbits.com
https://www.tropicaltidbits.com
• nullschool.net
https://earth.nullschool.net
• NOAA Climate Prediction Center - ENSO: Recent Evolution, Current Status and Predictions
https://www.cpc.ncep.noaa.gov/products/analysis_monitoring/lanina/enso_evolution-status-fcsts-web.pdf
https://www.cpc.ncep.noaa.gov/products/analysis_monitoring/lanina/enso_evolution-status-fcsts-web.pdf
• Cataclysmic Alignment
https://arctic-news.blogspot.com/2022/06/cataclysmic-alignment.html
https://arctic-news.blogspot.com/2022/06/cataclysmic-alignment.html
• NOAA National Centers for Environmental Information, State of the Climate: Monthly Global Climate Report for October 2022, retrieved November 16, 2022
• The Importance of Methane in Climate Change
https://arctic-news.blogspot.com/p/the-importance-of-methane-in-climate.html
https://arctic-news.blogspot.com/p/the-importance-of-methane-in-climate.html
• Copernicus methane at 500 hPa, forecast for November 78, 2022, 03 UTC
• NOAA-20 satellite
• NOAA - Global Monitoring Laboratory
https://gml.noaa.gov/dv/iadv
https://gml.noaa.gov/dv/iadv
• Methane Keeps rising
• The Clouds Feedback and the Clouds Tipping Point
https://arctic-news.blogspot.com/p/clouds-feedback.html
• Pre-industrial
https://arctic-news.blogspot.com/p/pre-industrial.html
• Invisible ship tracks show large cloud sensitivity to aerosol - by Peter Manhausen et al.
https://www.nature.com/articles/s41586-022-05122-0
• Extinction
https://arctic-news.blogspot.com/p/extinction.html
• When will we die?