Saturday, October 31, 2026

Arctic temperatures rising

Arctic temperatures rose by 0.48°C from -7.37°C on October 21, 2026, to -6.89°C on October 25, 2026, as illustrated by the image below, adapted from Climate Reanalyzer. The globe shows global anomalies vs 1991-2020 for that day, with the Arctic highlighted.


The image below shows the situation on October 31, 2026. The temperature anomaly has risen significantly in October 2026. 


On November 1, 2026, temperatures in an area near the North Pole were more than 20°C higher than they were in 1991-2020, as illustrated by the image below. 


How could Arctic temperatures be high and rising, at a time of year when the temperature normally is decreasing?

At times, polar amplification of the temperature rise hits the Arctic hard. Additionally, the rise in Arctic temperature is caused by the strengthening  El Niño. Furthermore, air temperatures in the Tropics are high. The image below, from an earlier post, shows surface air temperatures in the Tropics through October 24, 2026, when the temperature in the Tropics was 26.52°C, an anomaly of 1.42°C versus 1979-2000, the highest anomaly on record. The globe (inset top left) shows the surface air temperature anomaly versus 1991-2020 on October 24, 2026, with the Tropics highlighted.


A relatively wide difference in temperature between the Arctic and the Tropics increases the strength and speed of the wind from the Tropics to the Arctic, and the wind speed can increase dramatically particularly from the North Atlantic to the Arctic, where - over a long vertical stretch of ocean - prevailing winds typically are already strong and now they are getting even stronger as temperatures rise. What this can result in is illustrated by the combination image below, adapted from nullschool, showing a temperature of -21.6°C near the North Pole on October 25, 2026, and a temperature of 0.3°C at the same spot on October 31, 2026. 


El Niño strengthening

Furthermore, El Niño is strengthening. The combination image below, adapted from ECMWF, shows El Niño forecasts from November 1, 2026, for the Niño1+2 region (left) and the Niño3 region (right).


Situation in Antarctica even worse

[ high stratospheric temperature over Antarctica ]
The situation is even worse in Antarctica, where the change of seasons, the accelerating temperature rise and the strengthening El Niño combine to threaten an Antarctic Blue Ocean Event to occur soon, as discussed in earlier posts such as this one.

The image on the right, adapted from nullschool, show an unusually high temperature in the stratosphere over Antarctica, indicating that large amounts of heat have risen to stratospheric levels there.

The combination image below shows Antarctic sea ice on November 5, 2026. The panel on the left shows thickness by the University of Bremen, the panel at the center shows concentration by the University of Bremen and the panel on the right shows concentration by NSIDC.org. 

[ orange line on the right shows medium ice edge 1981-2010 ]
Feedbacks

Contributing to the rise in sea surface temperature anomalies around Antarctica and the decline of Antarctic sea ice are numerous feedbacks that speed up such developments, including: 
• albedo loss due to less lower clouds (#25),
• albedo loss due to cryosphere decline (#1) including loss of the latent heat buffer (#14), 
• stronger wind, fires and jet stream distortion (#19), 
• stronger evaporation and precipitation, and more water vapor in the atmosphere (#25), 
• ocean stratification (#29) and
• oceans taking up less heat (#19), 
• eruptions of seafloor methane (#16),
• rising salinity at the Southern Ocean's sea surface (#26), as also discussed below.


The above image shows some of these feedbacks, illustrating how they can combine and jointly strengthen the temperature rise and, as they do, amplify each other's impact and increase the heat in the atmosphere.

As an example, stratification and salinity changes in oceans can change circulation patterns in oceans, causing less heat to be taken up by the deep oceans, resulting in more heat accumulating at the sea surface and more heat remaining in the atmosphere. Some 91% of the extra heat resulting from Earth's Energy Imbalance is currently taken up by oceans, so even a small change in this percentage could leave vastly more heat in the atmosphere, as illustrated by the image below. 

[ image from earlier post ]

Rising salinity at the sea surface of the Southern Ocean 

The mechanism behind the rising salinity at the sea surface of the Southern Ocean is discussed below.

A recent study led by Robert Massom describes how stronger wind can causes stronger waves that can break up and pulverise ice floes into small fragments and slush, and that can also cause ice floes to flood over, resulting in ponds of seawater that enable algae growth. Unlike melt ponds, seawater wave ponds occur year-round. These feedbacks all reduce albedo, further speeding up the melting of sea ice. 

   [ Saltier water, less sea ice - from earlier post ]
Until 2015, rising temperatures resulted in melting of ice and enhanced precipitation that freshened the surface of the Southern Ocean, exacerbated by increasing stratification that prevented mixing. The temperature rise over the years also caused winds to be stronger, at the time causing the sea ice to spread out wider.

The higher the water's salt content, the lower its melting point. Seawater typically has a salinity of about 3.5% (35 grams of salt per liter of water). Sea ice starts melting when the temperature rises to about -2°C (28.4°F). By contrast, freshwater remains frozen as long as the temperature remains below 0°C (32°F).

A recent study led by Theo Spira finds that, in 2015, anomalously strong winds enhanced mixing across the thin Winter Water layer, entraining warm and salty subsurface waters, which broke down upper-ocean stratification. Another recent study led by Earle Wilson find that in 2015, intensified wind-driven upwelling reversed the freshening trends, releasing years of accumulated ocean heat that contributed to unprecedented sea ice loss.

A recent study led by Da Nian warns that Antarctic regions (60°S − 90°S) may warm by around 6°C due to the collapse of the Atlantic meridional overturning circulation (AMOC).

A recent study led by Aditya Narayanan finds that East Antarctic sea ice loss was primarily subsurface driven via enhanced upward circumpolar deep water flux, whereas West Antarctic sea ice loss was also forced by longwave radiative flux anomalies. Findings suggest that persistent upwelling-favorable conditions under anthropogenic forcing may push the Southern Ocean into a prolonged low sea ice state.

An earlier post discusses the finding of a study led by Alessandro Silvano that, around 2015, surface salinity in the Southern Ocean began rising sharply – just as sea ice extent started to crash.

The post also points at the danger that heat, previously stored in the deep ocean by sinking circumpolar waters, will instead remain at the surface and cause atmospheric temperatures to rise, as illustrated by the image on the right.

The post warns that higher temperatures come with feedbacks such as stronger wind and stronger evaporation, resulting in increased water vapor in the atmosphere.

The post further warns that, while much of the water vapor will return to the surface in the form of precipitation such as rain and snow, part of this precipitation will fall over Antarctica, with the net result of an increase in salinity of surface of the Southern Ocean, facilitating increased melting of Antarctic sea ice.

How high could temperatures rise in 2027?

The image below shows global daily surface air temperature anomaly in °C versus 1991-2020, based on December 1, 2022, through October 31, 2026, Copernicus ERA5 data with a trend added warning about a potential 7°C anomaly by end July 2027.

[ click on image to enlarge ]
The image below shows that on November 3, 2026, the temperature anomaly reached a record high, in a tie with November 17+18, 2023. 


Anomalies in the two above images are compared to 1991-2020, which isn't pre-industrial. When using a genuinely pre-industrial base, the data may have to be adjusted by more than +1°C, as discussed in earlier posts such as this one, which also discusses the use of linear versus non-linear trends. 

Huge temperature rise?
[ from the Extinction page ]
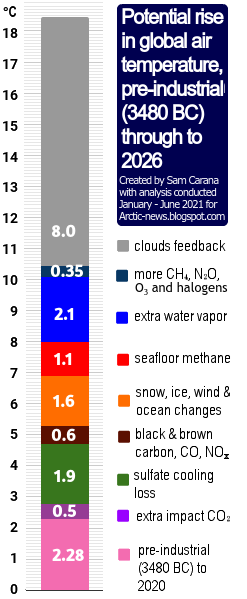
The image on the right is a later version of an image dating back to 2016 that warns about the importance of taking into account a potentially huge rise soon. Disappearance of Antarctic sea ice would be a horrendous climate disaster, increasing the likelihood of a subsequent Arctic Blue Ocean Event. The danger is that multiple feedbacks associated with sea ice loss, such as albedo loss, will strongly accelerate the temperature rise, as warned about at Double Blue Ocean Event and the Antarctica page.

Eruptions of methane from the seafloor could, on their own, cause the 1200 ppm CO₂e cloud feedback tipping point to be crossed, which in turn can cause global temperatures to rise by 8°C, as discussed in this earlier post.

Temperatures look set to rise further due to the falling away of sulfate aerosols, while there could be a additional temperature rises due to releases of other aerosols that have a net warming impact, such as black and brown carbon, which can increase dramatically due to more wood burning and forest fires taking place as industrial activity collapses.

Pursuing efforts?

Most nations have ratified the Paris Agreement, which means that politicians are legally obliged to adhere to the Paris Agreement thresholds. However, after more than a decade of pursuing efforts, little or no progress appears to have been made.

The temperature rise is clearly accelerating and denying such acceleration is yet another sick trick in the books of the politicians who control the IPCC, next to using an inappropriate base (instead of pre-industrial), ignoring parts of the current and future temperature rise, and inappropriately using linear trends, even when polynomials obviously work better.

Conclusion

The situation is dire and unacceptably dangerous, and the precautionary principle necessitates the danger to be acknowledged, while facilitating rapid, comprehensive and effective action to reduce the damage and to improve the outlook, where needed in combination with a Climate Emergency Declaration, as described in posts such as in this 2022 post and this 2025 post, and as discussed in the Climate Plan group.


The ClimatePlan by Sam Carana calls for implementation of sets of feebates, with fees imposed on sales of polluting products and the revenues from those fees used to fund rebates on cleaner alternatives. Sets of feebates are best implemented ASAP, separately and preferably locally, with disputes handled by Local People's Courts where randomly-chosen local residents deliver verdicts on whether policies confirm the weight of best-available science. Where needed, Climate Emergency Declarations can support progress.

Links

• Climate Reanalyzer
https://www.climatereanalyzer.org

• Will 2026 El Nino cause Antarctic Blue Ocean Event?
https://arctic-news.blogspot.com/2026/10/will-2026-el-nino-cause-antarctic-blue-ocean-event.html

• Nullschool.net
https://earth.nullschool.net

• ECMWF - European Centre for Medium-Range Weather Forecasts
https://charts.ecmwf.int

• Double Blue Ocean Event 2026-2027? - update June 2026
https://arctic-news.blogspot.com/2026/06/double-blue-ocean-event-2026-2027-update.html

• Copernicus
https://pulse.climate.copernicus.eu

• Transforming Society (2022)
https://arctic-news.blogspot.com/2022/10/transforming-society.html

• Climate Plan (2019)
https://arctic-news.blogspot.com/p/climateplan.html

• The Climate Plan by Sam Carana (2026)
https://arctic-news.blogspot.com/p/the-climate-plan-by-sam-carana.html

• Climate Emergency Declaration (2023)
https://arctic-news.blogspot.com/p/climate-emergency-declaration.html


Tuesday, October 20, 2026

Will 2026 El Nino cause Antarctic Blue Ocean Event?


The above image shows a record high sea surface temperature in the Niño 3.4 region of 30.21°C on October 25, 2026, 4.46°C higher than the 25.75°C recorded on January 9, 2026, and a record high anomaly of +3.6°C versus 1982-2010.

The map (inset at the bottom of the above image) shows sea surface temperature anomalies versus 1991-2020 on October 25, 2026, around the globe, with the Niño 3.4 region highlighted.

Temperature anomalies in the Niño 3.4 region are indicative of El Niño's strength. The 2015/2016 El Niño reached its peak strength late 2015. Similarly, the 2023/2024 El Niño reached its peak strength late 2023, as indicated by the grey square on the thick grey line on the above image. 


In the above image, issued by NOAA on October 19, 2026, the 2026/2027 El Niño doesn't yet show up, but it is forecast to reach peak strength late 2026, as illustrated by the image below.

[ image from earlier post ]
Strong melting of Antarctic sea ice typically occurs around the end of the year, so this year this is forecast to coincide with the strongest El Niño on record reaching peak strength.

Teleconnections

Air temperatures in the Tropics are high. The image below shows surface air temperatures in the Tropics through October 24, 2026, when the temperature in the Tropics was 26.52°C, an anomaly of 1.42°C versus 1979-2000, the highest anomaly on record. The globe (inset top left) shows the surface air temperature anomaly versus 1991-2020 on October 24, 2026, with the Tropics highlighted.


The image below, a forecast for October 29, 2026, shows atmospheric rivers carrying hot and moist air toward the poles, resulting in snowfall over Antarctica, thickening the snow layer there, while making the Southern Ocean more saline and thus making Antarctica sea ice more susceptible to melting, as discussed in an earlier post.


The combination image below, adapted from ClimateReanalyzer.org, shows daily averages for October 29, 2026, illustrating the mechanism of how conditions contribute to making Antarctic sea ice more susceptible to melting. 


The above combination image illustrates: 1. high sea surface temperatures in the Pacific Ocean (top left) and 2. high as well as very low temperatures over Antarctica, in places below -50°C (top center), resulting in 3. a distorted Jet Stream path with strong wind over Antarctica (top right), and in 4. atmospheric rivers pushing warm and moist air toward Antarctica, resulting in high precipitable water standardized deviation over Antarctica (bottom left), 5. high precipitation (bottom center), and 6. increased snow depth (bottom right).

The combination image below, adapted from nullschool.net, shows 3-hour Precipitation Accumulation as high as 18.8 mm over Antarctica on October 29, 2026, at the green circle (left) and at the same time and place a relative humidity of 100% at the green circle (right).


Snowfall over Antarctica thickens the snow layer over Antarctica, which contributes to an increase in salinity of the surface of the Southern Ocean, and thus makes Antarctic sea ice more susceptible to melting. as discussed in earlier posts such as this one and illustrated by the image below, adapted from Silvano et al. (2025). 


Prospect of an Antarctic Blue Ocean Event

On October 27, 2026, the global sea ice extent was 23.39 million km², the second lowest extent for the time of year, as illustrated by the image below, adapted from ads.nipr.ac.jp/vishop. The global sea ice extent can be expected to fall strongly over the next few months, due to the change in seasons and due to the 2026 El Niño gaining in strength. The image also highlights the year 2023 and the year 2016, which was a strong El Niño year. The 2026 El Niño is forecast to be even stronger.


Since September 29, 2026, the Antarctic sea ice area has been the lowest on record for the day and the deviation from 1981-2010 has not been below -4σ, while the deviation was as low as -5.36σ on October 14, 2026, as illustrated by the image below. 

On October 30, 2026, Antarctic sea ice area was 11.74 million km², again the lowest area on record for that day, while the deviation was -4.30σ. The dark blue band in the middle indicates 1σ deviation from the 1981-2010 average, while the light blue shading indicates 5σ deviation. The year 2023 is highlighted in blue and the year 2022 in purple. 


The above image shows a steep decline of Antarctic sea ice area in late 2022. The image below shows that the Antarctic sea ice area continued to be very low in early 2023. The light blue shading on the image below indicates 3σ deviation. On February 22, 2023, Antarctic sea ice area was 1.09 million km², very close to the 1 million km² threshold when a Blue Ocean Event could be called, while the deviation from 1981-2010 on that day was 3.03σ. 


Importantly, there was no strong El Niño present when the Antarctic sea ice reached its record low area in 2023. Instead, in 2022 and early 2023, La Niña conditions were present. By contrast, the 2026 El Niño is forecast to be very strong, its peak strength is forecast to occur late 2026, and the El Niño is forecast to extend into early 2027.

Greenhouse gas concentrations keep rising

Meanwhile, concentrations of greenhouse gases keep rising at an accelerating pace. 

While emissions by people did accelerate since the start of the Industrial Revolution and even more recently, the rise in emission by people had already started thousands of years ago with growth in agriculture, herding of animals and associated deforestation, as discussed in earlier posts such as this one. 

The accelerating rise from 1750 to 2025 in methane, carbon dioxide and nitrous oxide is illustrated by the image on the right, created with IPCC and WMO data. The acceleration has been strongest for methane, which in 2025 had a concentration of 267% relative to 1750.  

Conclusion

The situation is dire and unacceptably dangerous, and the precautionary principle necessitates the danger to be acknowledged, while facilitating rapid, comprehensive and effective action to reduce the damage and to improve the outlook, where needed in combination with a Climate Emergency Declaration, as described in posts such as in this 2022 post and this 2025 post, and as discussed in the Climate Plan group.


The ClimatePlan by Sam Carana calls for implementation of sets of feebates, with fees imposed on sales of polluting products and the revenues from those fees used to fund rebates on cleaner alternatives. Sets of feebates are best implemented ASAP, separately and preferably locally, with disputes handled by Local People's Courts where randomly-chosen local residents deliver verdicts on whether policies confirm the weight of best-available science. Where needed, Climate Emergency Declarations can support progress.


Links

• Climate Reanalyzer
https://www.climatereanalyzer.org

• NOAA - ENSO: Recent Evolution, Current Status and Predictions
https://www.cpc.ncep.noaa.gov/products/analysis_monitoring/lanina/enso_evolution-status-fcsts-web.pdf

• Kevin Pluck - sea ice visuals
https://seaice.visuals.earth

• Japanese National Institute of Polar Research - Arctic and Antarctic Data archive System
https://earth.nullschool.net

• Rising surface salinity and declining sea ice: A new Southern Ocean state revealed by satellites - by Alessandro Silvano et al. (2025)
https://www.pnas.org/doi/full/10.1073/pnas.2500440122
discussed on facebook at:
https://www.facebook.com/groups/arcticnews/posts/10162876582119679

• Double Blue Ocean Event (2026)
https://arctic-news.blogspot.com/p/double-blue-ocean-event.html

• Double Blue Ocean Event 2026-2027? - update June 2026
https://arctic-news.blogspot.com/2026/06/double-blue-ocean-event-2026-2027-update.html

• Antarctic sea ice increasingly in danger (2026)
https://arctic-news.blogspot.com/2026/08/antarctic-sea-ice-increasingly-in-danger.html

• Antarctica (2026)
https://arctic-news.blogspot.com/p/antarctica.html

• When Will We Die? (2019)
https://arctic-news.blogspot.com/2019/06/when-will-we-die.html

• Extinction (2016)
https://arctic-news.blogspot.com/p/extinction.html

• Transforming Society (2022)
https://arctic-news.blogspot.com/2022/10/transforming-society.html

• Climate Plan (2019)
https://arctic-news.blogspot.com/p/climateplan.html

• The Climate Plan by Sam Carana (2026)
https://arctic-news.blogspot.com/p/the-climate-plan-by-sam-carana.html

• Climate Emergency Declaration (2023)
https://arctic-news.blogspot.com/p/climate-emergency-declaration.html


Saturday, October 17, 2026

Global Warming from 1900

At the adoption of the Paris Agreement in 2015, nations pledged to hold the global average temperature rise to well below 2°C above pre-industrial levels and to pursue efforts to limit the temperature rise to 1.5°C above pre-industrial levels.

The image below, with the title Global Warming from 1900, featured in a 2016 post, now ten years ago.


In the above image, data are adjusted, showing the 1.5°C threshold crossed for two months in 2016. The added trend ominously shows the 1.5°C threshold getting crossed more permanently in 2022, while pointing at 2°C getting crossed in 2030.

What is pre-industrial?

The above 2016 image uses adjusted NASA data and a polynomial trend to illustrate the accelerating temperature rise from 1900. An adjustment of +0.28°C caters for the rise from 1900 to 1951-1980, since 1951-1980 is NASA's default base, which isn't a pre-industrial base. For more on such adjustment, also see this 2015 post. Of course, the year 1900 isn't pre-industrial either. For an analysis of the temperature rise going further back in time, have a look at the pre-industrial page and the image below. 

[ from earlier post ]
The issue is not merely a matter of which date is used as pre-industrial base, but also a matter of the elements that are included in the temperature to rise and what their respective size could be. An example is ocean temperature, the NOAA dataset uses sea surface temperatures, i.e. the temperature of the water, whereas the ERA5 dataset uses the temperature of the air above the water. Another issue is whether to measure the Arctic temperature by looking at the air over the ice, the ice itself or the water underneath the ice. Also important is that some areas are now open water, while there was previously sea ice. 

Elements of the temperature rise

The image below looks at elements to be looked at when calculating people's contribution to the temperature rise to date and the temperature rise to come. 

The IPCC regards the observed temperature as a temperature rise (or anomaly) from the period 1850-1900. The observed temperature rise is partly masked by aerosols (M). Aerosols could fall out of the air quickly in case of industrial collapse, removing the part of the temperature rise that is now masked, so the rise from 1850-1900 could quickly become only (O), instead of (O+M). 

The masking effect by aerosols results from industrial emissions, particularly sulfur dioxide (SO₂) emissions from fossil fuel burning that convert into sulfates through atmospheric oxidation. Airborne sulfate particles are white, reflecting incoming solar radiation back into space. 

Another type of aerosols is black carbon, which has a warming effect. Before the Industrial Revolution, people burned wood and crop residue for household heating, cooking and metallurgy, resulting in emissions of black carbon. A 2013 study calculates that black carbon has a warming effect of about 1.1 W/m² of which 0.17 W/m² can be attributed to pre-industral emissions of black carbon. In case of industrial collapse, part of the future rise (F) could be caused by more warming due to releases of other aerosols that have a net warming impact, such as black and brown carbon, which can increase dramatically as more wood burning and forest fires take place as industrial activity collapses and as more waste gets burned.

As said, the IPCC calculates the anomaly from the period 1850-1900, which ignores the rise before that period (P). The IPCC also ignores the rise that took place to negate the natural decline in temperature (H). When also taking into account that the temperature would have declined naturally, i.e. in line with Milankovitch cycles and in the absence of emissions by people (E3), the rise caused by people to negate this decline could also be included (H), adding up to an even higher historic temperature rise (O+M+P+H), while there could be an additional rise to come soon that could also be huge (F).

[ from earlier post ]

Additionally, the full impact of all past emissions may not be fully felt yet, e.g. the full effect of carbon dioxide emissions reaches its peak only a decade after emission (E4). Furthermore, humans are likely to continue to cause emissions in the near future (E5). Finally, additional releases of greenhouse gases are likely to come from what was once called permafrost and from sinks turning into sources, resulting in an additional rise that's already baked into the cake (E6). Therefore, the historic rise plus the rise to come soon (O+M+P+H+F) may approach 5°C.

Feedbacks and deforestation

The diagram below further illustrates the importance of feedbacks and deforestation. Removal of trees has caused deforestation and soil carbon loss since prehistoric times, in turn causing emissions including carbon dioxide, methane and black carbon, while also reducing cooling aerosols released by trees and while also reducing the heat buffer of evaporation and the heat buffer of snow and ice that previously cooled the atmosphere. Since prehistoric times, burning wood and deforestation has caused emissions of black carbon and dust that blackened the snow and ice cover, thus further speeding up its decline.

[ from earlier post ]
Feedbacks can dramatically increase the temperature rise, as they can be self-amplifying or can amplify each other.

Which trend works best?

Next to the question of how best to calculate how much people have caused the temperature to rise, there is a question of which trend works best to capture both the temperature rise until now and the potential rise to come. 

The image below, from a recent analysis led by Qinjian Jin, uses linear trends showing the temperature rising during 2011–2025 at a rate of 0.40°C per decade (purple), twice as much as the 0.20°C per decade during 1971–2025 (yellow). Extrapolating the accelerated (purple) rate projects a crossing of the 1.5°C threshold by 2028. The analysis shows that the temperature rise has doubled, but the analysis stops short of using curved lines or polynomial trends and instead sticks to linear trends. 


The analysis is also discussed by Paul Beckwith in the video below. 


By comparison, the IPCC in AR6 gives values as depicted in the image below. 


The image below is adapted from a 2023 analysis by James Hansen et al.


James Hansen et al. also conclude that the temperature rise is accelerating, but they also stop short of using curved lines or polynomial trends and instead stick to linear trends.

One problem with linear trends is that they calculate the average temperature during a period, thus showing the average temperature over past years, while masking the current temperature and a potentially steep rise in future. In other words, linear trends can obscure both recent and future acceleration. By contrast, curved lines and polynomial trends are better equipped to illustrate potential acceleration, while they can also smooth out seasonal and temporary changes. 

Huge temperature rise

[ from the Extinction page ]
The image on the right is a later version of an image dating back to 2016 that warns about the importance of taking into account a potentially huge rise soon. Disappearance of Antarctic sea ice would be a horrendous climate disaster, increasing the likelihood of a subsequent Arctic Blue Ocean Event. The danger is that multiple feedbacks associated with sea ice loss, such as albedo loss, will strongly accelerate the temperature rise, as warned about at Double Blue Ocean Event and the Antarctica page.

Eruptions of methane from the seafloor could, on their own, cause the 1200 ppm CO₂e cloud feedback tipping point to be crossed, which in turn can cause global temperatures to rise by 8°C, as discussed in this earlier post.

Temperatures look set to rise further due to the falling away of sulfate aerosols, while there could be a additional temperature rises due to releases of other aerosols that have a net warming impact, such as black and brown carbon, which can increase dramatically due to more wood burning and forest fires taking place as industrial activity collapses.

Pursuing efforts?

Most nations have meanwhile ratified the Paris Agreement, which means that politicians are legally obliged to adhere to the Paris Agreement thresholds. However, after more than a decade of pursuing efforts, little or no progress appears to have been made.

The temperature rise is clearly accelerating and denying such acceleration is yet another sick trick in the books of the politicians who control the IPCC, next to using an inappropriate base (instead of pre-industrial), ignoring parts of the current and future temperature rise, and inappropriately using linear trends, even when polynomials obviously work better.

Conclusion

A decade ago, the post concluded as follows: the situation is dire and calls for comprehensive and effective action as described in the Climate Plan. This applies even more today. The situation is dire and unacceptably dangerous, and the precautionary principle necessitates the danger to be acknowledged, while facilitating rapid, comprehensive and effective action to reduce the damage and to improve the outlook, where needed in combination with a Climate Emergency Declaration, as described in posts such as in this 2022 post and this 2025 post, and as discussed in the Climate Plan group. For an update of the Climate Plan, see the Climate Plan by Sam Carana. 

Links

• Pursuing efforts? (2016)
the image at the top is discussed on facebook at

• NASA GISS Surface Temperature Analysis (GISTEMP)

• A recent doubling of global warming rate signals a 1.5 °C breach by 2028 - by Qinjian Jin et al. (2026) 

• Global Warming Rate Has Recently Doubled Meaning We Pass 1.5C By 2028 and 2.0C by as Early as 2038 - video by Paul Beckwith
discussed on facebook at

• Global warming in the pipeline - by James Hansen et al. (2023)

• Pre-industrial

• Paris Agreement (2015)


• When Will We Die? (2019)

• Extinction (2016)

• Transforming Society (2022)