Arctic sea ice volume
In September 2024, Arctic sea ice reached a new record low volume, as illustrated by the image below, adapted from the Danish Meteorological Institute, with markers for September (red) and April (blue) corresponding with the year's minimum- and maximum volume.

Indeed, some mechanisms can have a more abrupt impact. Sea ice could shrink strongly and rapidly as a (tipping) point is reached where the latent heat buffer disappears abruptly and as further incoming ocean heat suddenly can no longer be consumed by melting of what once was thick sea ice that extended meters below the surface. Arctic sea ice typically reached its annual low about half September, but an abrupt decline of Arctic sea ice may well occur earlier than that. Sea ice may melt strongly, and large pieces of sea ice may additionally get pushed out of the Arctic Basin by strong winds. Large and rapid loss of Arctic sea ice may therefore well occur in July 2025 or even earlier, as the latent heat tipping point gets crossed and additional mechanisms further contribute to increase the temperature.
On October 11, 2024, Antarctic sea ice was more than 1 million km² lower in extent than on October 11, 2022, and almost 3 million km² lower in extent than a decade ago, as illustrated by the image below.

16.757 million km² on October 11, 2024
17.926 million km² on October 11, 2022
19.412 million km² on October 11, 2014
As illustrated by the image below, Antarctic sea ice extent was 1.976 million on February 25, 2022, so 1 million km² less extent than that would result in a Blue Ocean Event early next year. A Blue Ocean Event is deemed to occur when the sea ice extent falls to 1 million km² or less.
Low Antarctic sea ice extent is a tipping point, as sea ice thickness by February 2025 can be expected to be minimal, resulting in no further ocean heat getting consumed by sea ice below the surface. So, there would be less sunlight getting reflected back into space for months and by February 2025 there would no longer be thicker sea ice that previously consumed incoming ocean heat, and both of these mechanisms are further increasing temperatures.
Note also that Antarctic sea ice extent looks set for a steep decline, the more so as the impact of less sunlight getting reflected will increase over the coming months as more sunlight reaches the Southern Hemisphere, in line with seasonal changes. Albedo changes hit Antarctic sea ice in particular, as it is located at higher latitudes than Arctic sea ice, which is located mostly around the North Pole.
As the image below illustrates, the Antarctic Sea ice extent minimum was well below 2 million km² in each of the past three years.


Since little or no sunlight reaches the area around Antarctica at this time of year, sea surface albedo changes (i.e. changes from sea ice to water) or albedo changes of clouds over the sea surface are unlikely to contribute much (yet) to this huge difference.
Changes in wind patterns and changes in oceans (temperature, currents, vertical mixing and stratification) can make a lot of difference and so can changes in emissivity, a feedback that is active throughout the entire year. Mechanisms that are contributing to the demise of the snow and ice cover (and thus are contributing to the temperature rise) are discussed point by point further below in this post.
 |
| [ Click on images to enlarge ] |
Antarctic Sea ice thickness and volume
The images by University of Bremen below show sea ice thickness on August 27, 2024 (left), September 29, 2024 (center) and October 28, 2024 (right). The fall in sea ice thickness also indicates that Antarctic sea ice volume is decreasing.
 |
| [ Click on images to enlarge ] |
Temperatures keep rising


Mechanisms accelerating the temperature rise
Emissions by people are driving up temperatures and, as temperatures rise, feedbacks can accelerate the rise. The image below illustrates the mechanism of how multiple feedbacks can jointly accelerate the temperature rise.
 |
| [ from earlier post ] |

Each of these seven mechanisms are feedbacks that are also described at the feedback page and in earlier posts. These seven mechanisms are grouped together here since they all relate to changes in snow and ice cover, changes in oceans and changes in wind patterns, i.e. the orange part of the stacked bar chart at the conclusion of this article. In other words, as temperatures rise on the Southern Hemisphere, these seven mechanisms could contribute to dramatic sea ice loss around Antarctica over the next few months. The are described below in more detail:
 |
| [ Latent heat ] |

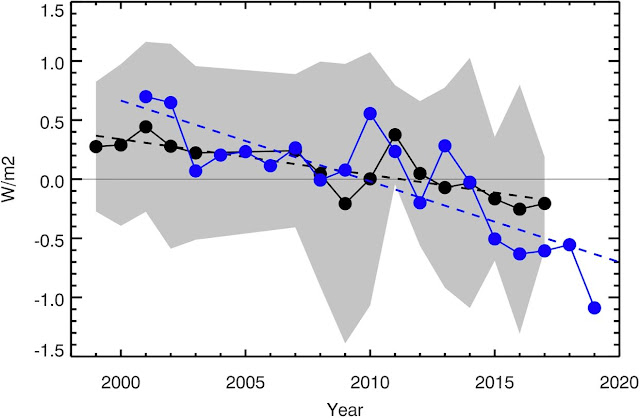 |
| [ Earthshine annual albedo anomaly expressed as reflected flux in W/m². CERES data. ] |
 |
| [ The Pattern Effect could account for a 0.7°C temperature rise. ] |
Higher sea surface temperatures come with greater stratification.
 |
| [ from earlier post ] |
Decreased vertical exchange in cold surface currents and in upwelling zones increases thermal stratification and slows down the Atlantic Meridional Overturning Circulation (AMOC), retains heat longer in the surface ocean, and reduces CO₂ exchange among the atmosphere, surface ocean, and the deep sea. The HotSpot maps from year to year suggest that upwelling systems can abruptly shut off, causing sudden sharp rises in regional air temperatures, and reducing air-ocean exchange of temperature and CO₂.
 |
[ from earlier post ] |
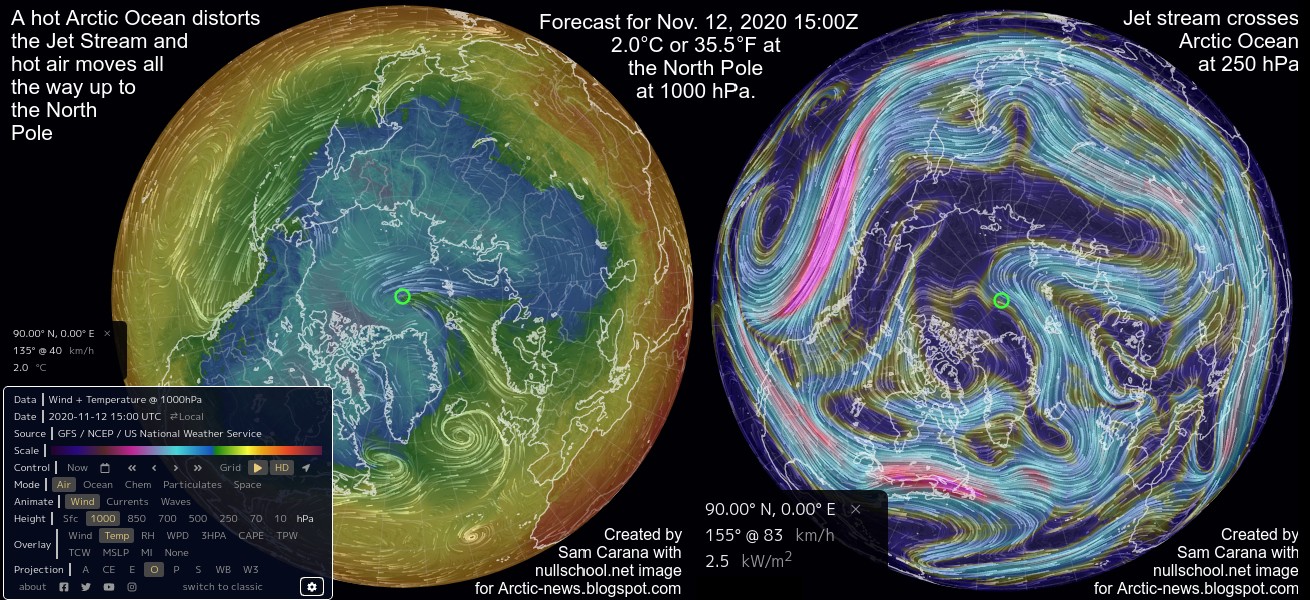
Polar amplification of the temperature rise causes a relative slowing down of the speed at which heat flows from the Equator to the poles. This can affect ocean currents and wind patterns, resulting in slowing down of the Atlantic meridional overturning circulation (AMOC) and of ocean currents around Antarctica that carry heat to the deep ocean, as well as in deformation of the Jet Stream.


The image below shows the October 2024 IRI ENSO forecast. NOAA adds that the IRI plume predicts a weak and a short duration La Niña, as indicated by the Niño-3.4 index values less than -0.5°C.
 |
| [ IRI ENSO forecast from Oct 2024 ] |
 |
| [ click on images to enlarge ] |


The IPCC has for many years weaved and twisted findings by scientists into a political narrative that downplays the temperature rise and refuses to point at the most effective measures to be taken to act on climate change, in an effort to create the illusion that there was a carbon budget to be divided among polluters as if pollution could continue for decades to come.
Lack of political will to act on the climate emergency is perhaps the most depressing mechanism accelerating the temperature rise. Moreover, where action is taken, blunt political instruments are all too often chosen that won't last long or turn out to be counter-productive.
Sadly, few people are calling for more sophisticated measures, let alone for more effective measures such as local feebates. It is important to be open and clear as to what can and must be achieved and how, and why.
The IPCC image below shows how much temperatures are currently suppressed in the Arctic due to aerosols and thus also shows how much temperatures in the Arctic look set to rise as the aerosol masking effect falls away.


The image illustrates the danger of the Land Evaporation Tipping Point getting crossed locally when water is no longer available locally for further evapotranspiration, i.e. from all processes by which water moves from the land surface to the atmosphere via evaporation and transpiration, including transpiration from vegetation, evaporation from the soil surface, from the capillary fringe of the groundwater table, and from water bodies on land. Once this tipping point gets crossed, the land and atmosphere will heat up strongly, due to the extra heat, i.e. heat that was previously consumed by evaporation and thawing. Additionally, more water vapor in the atmosphere accelerates the temperature rise, since water vapor is a potent greenhouse gas and this also contributes to speeding up the temperature rise of the atmosphere.


The image below shows that the September 2024 total column precipitable water anomaly (versus 1951-1980, ERA5 data) was at a record high in the area between latitudes 10°North and 40°North.

The image below lists 14 events. Note that the 14 mechanisms below are from an earlier post and many mechanisms differ from the above 8 mechanisms. Note also that the order may differ and that, instead of one domino tipping over the next one sequentially, many events may occur simultaneously and reinforce each other in the speed at which they unfold and the temperature rise that results. There could be interaction and amplification between mechanisms, resulting in a huge abrupt acceleration of the temperature rise that leads to extinction of most species, including humans, as the image below warns, from an earlier post. Finally, note that there could be Black Swan Events that have not yet been identified.

- The Seafloor Methane Tipping Point (feedback #16)
- The Clouds Tipping Point (also clouds feedback #30)
- The Terrestrial Biosphere Temperature Tipping Point
- The Ocean Surface Tipping Point (also discussed at facebook)
- The Land Evaporation Tipping Point (discussed above, also discussed at facebook)
- The Aquatic Deoxygenation Tipping Point (also discussed at facebook)
 |
| [ for more background, also view the Extinction page ] |
A huge temperature rise could occur soon, as the impact of these mechanisms keeps growing, as the latent heat tipping point gets crossed in a Double Blue Ocean Event and the seafloor methane tipping point subsequently gets crossed.
As temperatures keep rising in the Arctic, changes to the Jet Stream look set to intensify, resulting in loss of terrestrial albedo in the Arctic that could equal the albedo loss resulting from sea ice decline.
Further feedbacks include permafrost degradation, both terrestrial and on the seafloor of the Arctic Ocean, which looks set to cause huge releases of greenhouse gases (particularly CO₂, CH₄ and N₂O).
This would in turn also cause more water vapor to enter the atmosphere, further speeding up the temperature rise.
The situation is dire and the precautionary principle calls for rapid, comprehensive and effective action to reduce the damage and to improve the situation, as described in this 2022 post, where needed in combination with a Climate Emergency Declaration, as discussed at this group.

• Arctic Data archive System - National Institute of Polar Research - Japan
https://ads.nipr.ac.jp/vishop
https://ocean.dmi.dk/arctic/icethickness/thk.uk.php
• University of Bremen - Arctic sea ice
https://seaice.uni-bremen.de/start
• NSIDC - Interactive sea ice chart
https://nsidc.org/arcticseaicenews/charctic-interactive-sea-ice-graph
https://www.facebook.com/groups/arcticnews/posts/10161543138459679
• NOAA - Climate Prediction Center - ENSO: Recent Evolution, Current Status and Predictions
https://www.cpc.ncep.noaa.gov/products/analysis_monitoring/lanina/enso_evolution-status-fcsts-web.pdf
• NOAA - Physical Sciences Laboratory
https://psl.noaa.gov
• NASA
https://data.giss.nasa.gov
• Indicators of Global Climate Change 2023: annual update of key indicators of the state of the climate system and human influence - by Piers Forster et al.
• 2023 Record marine heat waves: coral reef bleaching HotSpot maps reveal global sea surface temperature extremes, coral mortality, and ocean circulation changes - by Thomas Goreau et al.
https://academic.oup.com/oocc/article/4/1/kgae005/7666987
https://arctic-news.blogspot.com/p/feedbacks.html
• Jet Stream
https://arctic-news.blogspot.com/p/jet-stream.html
• Freshwater lid on the North Atlantic
https://arctic-news.blogspot.com/p/cold-freshwater-lid-on-north-atlantic.html
• Latent Heat
https://arctic-news.blogspot.com/p/latent-heat.html
• Sunspots
https://arctic-news.blogspot.com/p/sunspots.html
• Indicators of Global Climate Change 2023: annual update of key indicators of the state of the climate system and human influence - by Piers Forster et al.
• Pre-industrial
https://arctic-news.blogspot.com/p/pre-industrial.html
• Transforming Society
https://arctic-news.blogspot.com/2022/10/transforming-society.html
• Climate Plan
https://arctic-news.blogspot.com/p/climateplan.html
• Climate Emergency Declaration
https://arctic-news.blogspot.com/p/climate-emergency-declaration.html


