Showing posts with label El Niño. Show all posts

Saturday, March 18, 2023

Sea surface temperature at record high


As the above image shows, the daily sea surface temperature between 60°South and 60°North reached a record high level on March 31, 2023, i.e. the highest temperature in the NOAA record that started in 1981. 

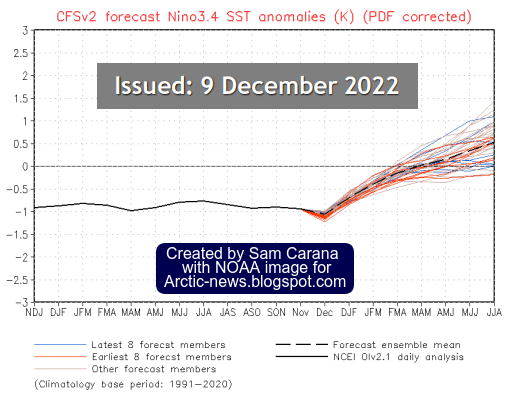
This record high sea surface temperature comes as we're moving into an El Niño, as illustrated by the image on the right, adapted from NOAA.

Moving from the bottom of a La Niña to the peak of a strong El Niño could make a difference of more than half a degree Celsius, as illustrated by the image below, adapted from NOAA.


Furthermore, sunspots look set to reach a high maximum within years, and the 2022 Tonga submarine volcano eruption did add a huge amount of water vapor to the atmosphere, as discussed in an earlier post

Even more dangerous than high global sea surface temperatures are sea surface temperatures in the North Atlantic, which have been at a record high for the time of year for some time, climbing to well above 20°C on March 29, 2023, as illustrated by the image below.


Vast amounts of heat moves from the North Atlantic into the Arctic. Around this time of year, North Atlantic sea surface temperatures are at their annual low, in line with changes in the seasons. Last year, North Atlantic sea surface temperatures reached a record high of 24.9°C in early September. 


On March 15, 2023, sea surface temperatures off the east coast of North America were as much as 13.8°C or 24.8°F higher than 1981-2011, as illustrated by the above image. Sea surface temperature anomalies are also high in the Pacific, reflecting an upcoming El Niño. All this spells bad news for Arctic sea ice, which typically reaches its lowest extent in September. 


The above Argo float compilation image illustrates the danger that a cold freshwater lid is forming on top of the North Atlantic.

[ Cold freshwater lid on North Atlantic (2020) ]
Stronger winds along the path of the Gulf Stream can at times speed up sea currents that travel underneath this cold freshwater lid over the North Atlantic. As a result, huge amounts of warm, salty water can travel from the Atlantic Ocean toward the Arctic Ocean, abruptly pushing up temperatures and salinity levels at the bottom of the Arctic Ocean.


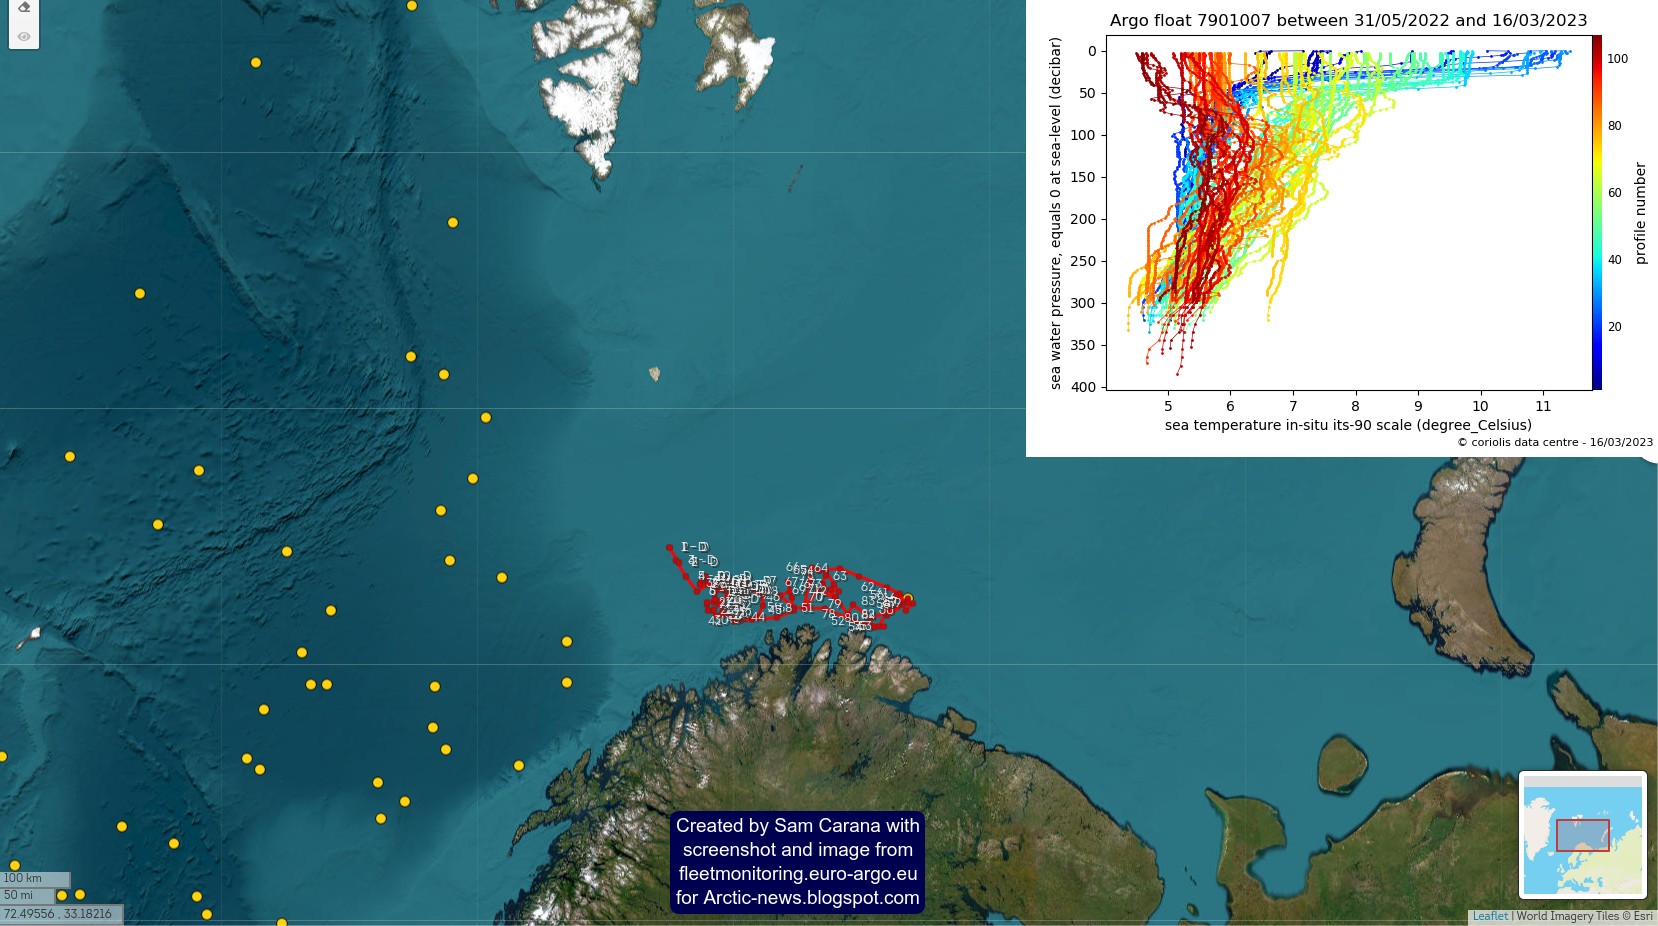
The above Argo float image illustrates the danger that heat can reach the seafloor. North of Norway, where the water is less than 400 m deep, temperatures higher than 5°C show up throughout the vertical water column, over a period from May 31, 2022, to March 16, 2023. 


The panel on the left of the above image, from an earlier post, shows sea surface temperatures on June 20, 2020, while the panel on the right shows a bathymetry map indicating that the sea in a large part of the Arctic Ocean is very shallow.


The above map shows the thickness of Northern Hemisphere permafrost on land and below the seabed.


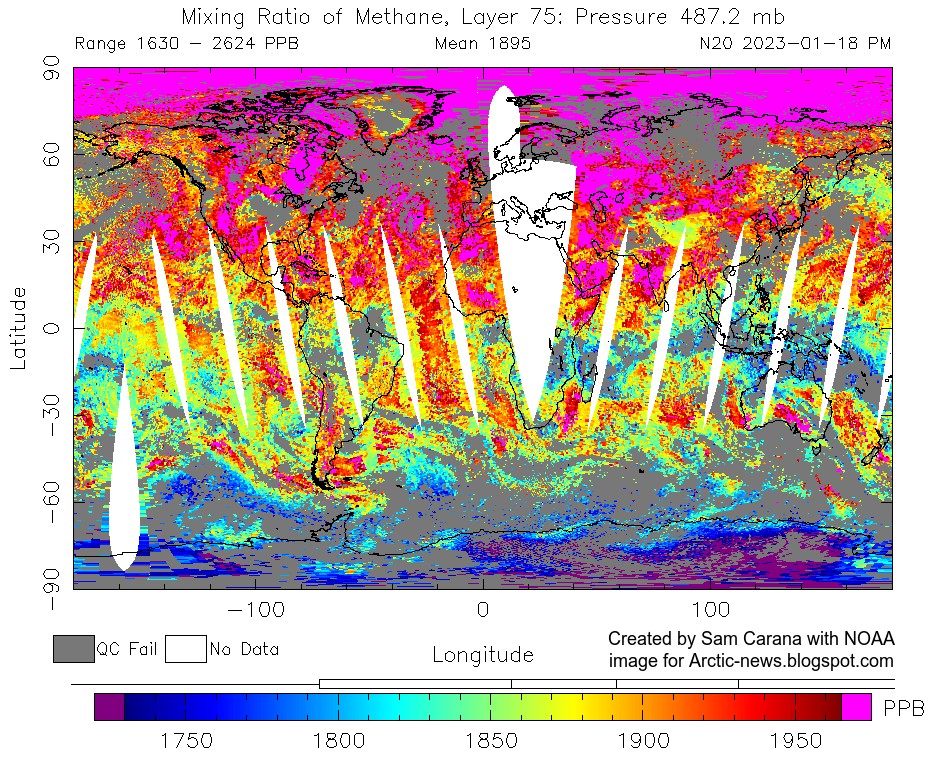
The above image describes how methane can escape from the permafrost and the seafloor of the Arctic Ocean. 

The danger of destabilization of methane hydrates is especially large where methane is present in submarine permafrost and seas are shallow, such as the East Siberian Arctic Shelf (ESAS, see image below).

The above image was created with content from a paper by Natalia Shakhova et al., from an earlier post.

[ click on images to enlarge ]
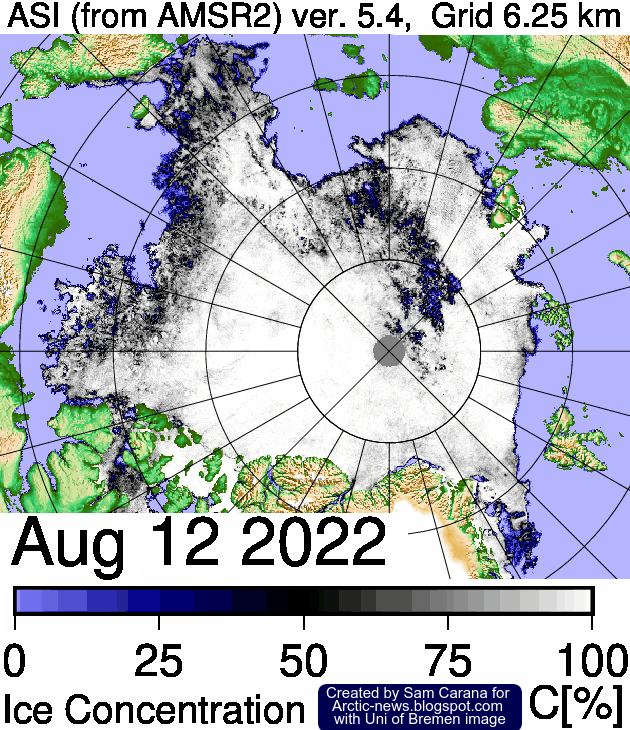
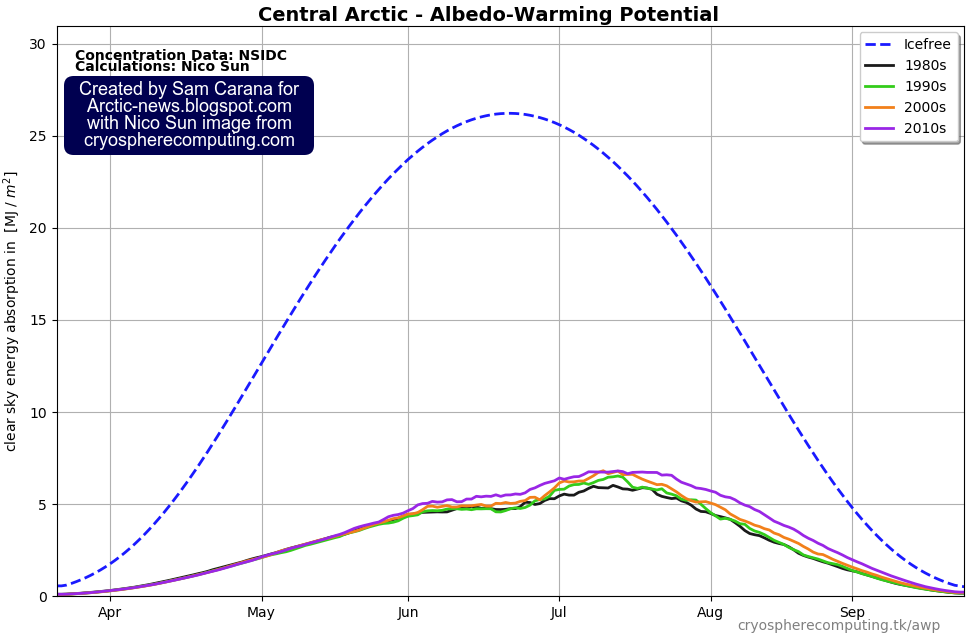
As illustrated by above compilation image, both the volume and extent of Arctic sea ice are low for the time of year. 

With further melting of sea ice and thawing of permafrost, the Arctic Ocean can be expected to receive more heat over the next few years, more heat from direct sunlight, more heat from rivers, more heat from heatwaves and more ocean heat from the Atlantic Ocean and the Pacific Ocean.


The above image illustrates the danger of two tipping points getting crossed, i.e. the Latent Heat Tipping Point and the Seafloor Methane Tipping Point, resulting in rapid destabilization of methane hydrates at the seafloor of the Arctic Ocean leading to explosive eruptions of methane, as its volume increases 160 to 180-fold when leaving the hydrates.

Latent heat loss, feedback #14 on the Feedbacks page

Climate Emergency Declaration


A catastrophe of unimaginable proportions is unfolding. Life is disappearing from Earth and runaway heating could destroy all life. At 5°C heating, most life on Earth will have disappeared. When looking only at near-term human extinction, 3°C will likely suffice.

Meanwhile, current laws punish people for the most trivial things, while leaving the largest crime one can imagine unpunished: planetary omnicide!

Considering this, a Climate Emergency should be declared, supporting action including:
  • Institutionalization of climate deniers until rehabilitated, under national acts such as the U.S. RICO (Racketeer Influenced and Corrupt Organizations) Act and Sherman Antitrust Act.

  • Holding politicians accountable for omnicide (crimes against humanity and ecocide) and bringing them before the International Criminal Court in The Hague, the Netherlands, if they seek to indemnify themselves for their inadequate action on the unfolding climate catastrophe. 

  • Local implementation of action on climate change, with Local People's Courts ensuring that implementation is based on the best-available scientific analysis, to avoid control by politicians who get bought by looters and polluters.


Links

• Climate Reanalyzer - Daily sea surface temperatures
https://climatereanalyzer.org/clim/sst_daily

• NOAA - Climate Prediction Center - ENSO: Recent Evolution, Current Status and Predictions
https://www.cpc.ncep.noaa.gov/products/analysis_monitoring/lanina/enso_evolution-status-fcsts-web.pdf

• Nullschool
https://earth.nullschool.net

• NOAA - Monthly Temperature Anomalies Versus El Niño
https://www.ncei.noaa.gov/access/monitoring/monthly-report/global/202302/supplemental/page-4

• NSIDC - Chartic interactive sea ice graph
https://nsidc.org/arcticseaicenews/charctic-interactive-sea-ice-graph

• Polar Portal

• Argo Float 4903641


• The Threat of Global Warming causing Near-Term Human Extinction

Tuesday, January 3, 2023

A huge temperature rise threatens to unfold soon

A huge temperature rise threatens to unfold, as the already dire situation threatens to turn catastrophic due to the combined impact of a number of developments and feedbacks. 

The image below uses ERA5 data, with two trends added. The blue trend, based on 1940-2022 data, points at 3°C rise by 2044. The purple trend, based on 2008-2022 data, better reflects variables such as El Niño and sunspots, and shows that this could trigger a rise of as much as 3°C by 2025, as further discussed below. Note that anomalies are from 1850-1900, which isn't pre-industrial.


The upcoming El Niño

Temperatures are currently suppressed as we're in the depth of a persistent La Niña event. It is rare for a La Niña event to last as long as the current one does, as illustrated by the NASA image below and discussed in this NASA post. The blue line added in the image highlights an increase in peak ONI (strong El Niños) over the years. 


The above image was created using data up to September 2022. La Niña has since continued, as illustrated by the NOAA image on the right. NOAA adds that the dashed black line indicates that La Niña is expected to transition to ENSO-neutral during January-March 2023.

Chances are that we'll move into the next El Niño in the course of 2023. Moving from the bottom of a La Niña to the peak of a strong El Niño could make a difference of more than half a degree Celsius, as illustrated by the image below.

[ image adapted from NOAA ]
Joint impact of El Niño, sunspots and the volcano eruption near Tonga 

[ click on image to enlarge ]
An analysis in an earlier post warns that the rise in sunspots from May 2020 to July 2025 could make quite a difference, as the upcoming El Niño looks set to coincide with a high number of sunspots.

The current cycle of sunspots is forecast to reach a maximum in July 2025. Recent observations are higher than expected, as illustrated by the images on the right, adapted from NOAA, confirming a study mentioned in the earlier post that warns that the peak of this cycle could rival the top few since records began, which would further increase the difference.

Observed values for December 2022 are already very close to or above the maximum values that NOAA predicts will be reached in July 2025. If this trend continues, the rise in sunspots forcing from May 2020 to July 2025 may well make a difference of more than 0.25°C, a recent analysis found. 

A 2023 study calculates that the submarine volcano eruption near Tonga in January 2022, as also discussed at facebook, will have a warming effect of 0.12 Watts/m² over the next few years.

The joint impact of a strong El Niño, high sunspots and the volcano eruption near Tonga could make a difference of more than 0.87°C. This rise could trigger further developments and feedbacks that altogether could cause a temperature rise from pre-industrial of as much as 18.44°C by 2026, as illustrated by the image at the top and as discussed below.

As illustrated by the image below,  temperature anomalies on land can be very high, especially during El Niño events. In February 2016, during a strong El Niño, the land-only monthly anomaly from 1880-1920 was 2.95°C. Note that anomalies are from 1880-1920, which isn't pre-industrial.


Further developments and feedbacks 

A combination of further developments and feedbacks could cause a huge temperature rise. An example of this is the decline of the cryosphere, i.e. the global snow and ice cover.

Antarctic sea ice extent is currently at a record low for the time of year (see image on the right, adapted from NSIDC). 

Antarctic sea ice extent reached a record low on February 25, 2022, and Antarctic sea ice extent looks set to get even lower this year. The dangerous situation in Antarctica is discussed in more detail in a recent post

The currently very rapid decline in sea ice concentration around Antarctica is also illustrated by the animation of Climate Reanalyzer images on the right, showing Antarctic sea ice on November 16, November 29, December 15, 2022 and January 4, 2023.

Studies in Alaska and Greenland have found that submarine and ambient melting is substantially higher than previously thought.

Global sea ice extent is also at a record low for the time of year, as illustrated by the image below that shows that global sea ice extent was 16.67 million km² on January 5, 2023.


[ click on images to enlarge ]
As illustrated by the image on the right, adapted from NSIDC, Arctic sea ice extent was second lowest for the time of year on January 6, 2023.

Loss of sea ice results in loss of albedo and loss of the latent heat buffer that - when present - consumes ocean heat as the sea ice melts. These combined losses could result in a large additional temperature rise, while there are further contributors to the temperature rise, such as thawing of terrestrial permafrost and associated changes such as deformation of the Jet Stream, additional ocean heat moving into the Arctic from the Atlantic Ocean and the Pacific Ocean, and methane eruptions from the seafloor of the Arctic Ocean.

A 2019 analysis concludes that the latent heat tipping point gets crossed when the sea surface temperature anomaly on the Northern Hemisphere gets higher than 1°C above 20th century's temperature and when there is little or no thick sea ice left. 

The latent heat tipping point in the Arctic was crossed in 2020, while ocean heat has kept rising since, despite La Niña conditions, as illustrated by the images above and below. 


Temperature anomalies were high over the Arctic Ocean in December 2022, as illustrated by the image below. 


Ominously, methane levels are very high over the Arctic, as illustrated by the Copernicus image below and as discussed in section 16 of the methane page and at the Climate Alert group


The image below shows methane recorded by the N20 satellite on January 18, 2023, pm at 487.2 mb reaching a peak of 2624 ppb. 


The animation below is made with images recorded by the Metop-B satellite on Jan.6, 2023 PM, showing methane at the highest end of the scale (magenta color) first (at low altitude) becoming visible predominantly over oceans and at higher latitudes North, and then gradually becoming also visible more spread out over the globe at higher altitude, while reaching its highest mean (of 1925 ppb) and peak (of 2708 ppb) at 399 mb. 


This indicates that methane is rising up from the Arctic Ocean, as also discussed at the methane page and at this post at facebook. 

The image below is from tropicaltidbits.com and shows a forecast for September 2023 of the 2-meter temperature anomaly in degrees Celsius and based on 1984-2009 model climatology. The anomalies are forecast to be very high for the Arctic Ocean, as well as for the Southern Ocean around Antarctica, which spells bad news for sea ice at both hemispheres.


Similarly, the image below shows a forecast for October 2023. 


There are many further developments and feedbacks that could additionally speed up the temperature rise, such as rising greenhouse gases (including water vapor), falling away of the aerosol masking effect, more biomass being burned for energy and an increase in forest and waste fires, as also discussed at the Aerosols page

As an earlier post mentions, the upcoming temperature rise on land on the Northern Hemisphere could be so high that it will cause much traffic, transport and industrial activity to grind to a halt, resulting in a reduction in aerosols that are currently masking the full wrath of global warming.

The image below shows dust as high as 9.1887 τ, i.e. light at 550 nm as a measurement of aerosol optical thickness due to dust aerosols, on January 23, 2023 01:00 UTC (at the green circle).


[ see the Extinction page ]
2023 study concludes that the amount of atmospheric desert dust has increased globally by about 55% since the mid-1800s, resulting in a net masking effect of −0.2 ± 0.5 W m⁻² for dust aerosols alone, more than climate models previously thought.

As discussed in an earlier post, the IPCC in AR6 estimates the aerosol ERF to be −1.3 W m⁻², adding that there has been an increase in the estimated magnitude of the total aerosol ERF relative to AR5. In AR6, the IPCC estimate for liquid water path (LWP, i.e., the vertically integrated cloud water) adjustment is 0.2 W m⁻², but a recent analysis found a forcing from LWP adjustment of −0.76 W m⁻², which would mean that the IPCC estimate of −1.3 W m⁻² should be changed to -2.26 W m⁻². When using a sensitivity of 1°C per W m⁻², this translates into an impact of -2.26°C and that doesn't even include the above-mentioned extra impact of dust. Furthermore, the IPCC's total for aerosols includes a net positive impact for warming aerosols such as black carbon, so the impact of cooling aerosols alone (without warming aerosols) will be even more negative.

The image on the right, from the extinction page, includes a potential rise of 1.9°C by 2026 as the sulfate cooling effect falls away and of 0.6°C due to an increase in warming aerosols by 2026.

In the video below, Guy McPherson discusses our predicament.


Final conclusions and reflections

It's important to avoid using terminology that may cause confusion. The image below shows some terms that may cause confusion (left), and terms that could be considered to be used instead (right).


As an example, it's better to avoid terms such as 'overshoot' and target', as illustrated by the image below.  

It's important to look at the bigger picture and recognize that these developments and feedbacks could jointly cause a temperature rise (from pre-industrial) of as much as 18.44°C by 2026, as discussed at the Extinction page. Also note that humans are likely to go extinct with a rise of 3°C, as illustrated by the image below, from an analysis discussed in an earlier post and underpinned by this post.


Earlier versions of the text in the image below were posted here and here


The situation is dire and threatens to turn catastrophic soon. The right thing to do now is to help avoid or delay the worst from happening, through action as described in the Climate Plan.


Links

• Copernicus temperature

• NOAA National Centers for Environmental Information, State of the Climate: Monthly Global Climate Report for October 2022, retrieved November 16, 2022
https://www.ncei.noaa.gov/access/monitoring/monthly-report/global/2022010/supplemental/page-4

• Tonga volcano eruption raises ‘imminent’ risk of temporary 1.5C breach https://www.carbonbrief.org/tonga-volcano-eruption-raises-imminent-risk-of-temporary-1-5c-breach

• Tonga eruption increases chance of temporary surface temperature anomaly above 1.5 °C - by Stuart Jenkins et al. 
https://www.nature.com/articles/s41558-022-01568-2

• NSIDC - National Snow and Ice Data Center - Charctic Interactive Sea Ice Graph
https://nsidc.org/arcticseaicenews/charctic-interactive-sea-ice-graph

• Climate Reanalyzer
https://climatereanalyzer.org/wx/todays-weather/?var_id=seaice-snowc&ortho=7&wt=1

• Meltwater Intrusions Reveal Mechanisms for Rapid Submarine Melt at a Tidewater Glacier - by Rebecca Jackson et al. (2019)
https://agupubs.onlinelibrary.wiley.com/doi/10.1029/2019GL085335

• Greenland’s Glaciers Might Be Melting 100 Times As Fast As Previously Thought (2022)
https://news.utexas.edu/2022/12/15/greenlands-glaciers-might-be-melting-100-times-as-fast-as-previously-thought

• An Improved and Observationally-Constrained Melt Rate Parameterization for Vertical Ice Fronts of Marine Terminating Glaciers - by Kirstin Schulz et al. (2022)
https://agupubs.onlinelibrary.wiley.com/doi/full/10.1029/2022GL100654

• National Institute of Polar Research, Japan
https://ads.nipr.ac.jp/vishop/#/extent

• NASA - GISS Surface Temperature Analysis (v4) - Global Maps

• NOAA - Climate at a Glance Global Time Series

• Critical Tipping Point Crossed In July 2019
• Another Year of Record Heat for the Oceans - by Lijing Cheng et al. 

• Copernicus - methane

• NOAA - methane MetOp-B satellite

• Methane - section 16. Methane rising from Arctic Ocean seafloor

• Tropicaltidbits.com
https://www.tropicaltidbits.com

• The upcoming El Nino and further events and developments

• Jet Stream

• Cold freshwater lid on North Atlantic

• Pre-industrial
https://arctic-news.blogspot.com/p/pre-industrial.html

• Invisible ship tracks show large cloud sensitivity to aerosol - by Peter Manhausen et al.
https://www.nature.com/articles/s41586-022-05122-0

• Methane keeps rising
https://arctic-news.blogspot.com/2022/10/methane-keeps-rising.html

• Global warming in the pipeline - by James Hansen et al. 
https://export.arxiv.org/ftp/arxiv/papers/2212/2212.04474.pdf

• Latent Heat
https://arctic-news.blogspot.com/p/latent-heat.html

• Extinction
https://arctic-news.blogspot.com/p/extinction.html

• When will we die?
https://arctic-news.blogspot.com/2019/06/when-will-we-die.html

• When will humans go extinct?


Monday, December 5, 2022

Arctic Ocean overheating

Arctic sea ice extent was 10.31 million km² on December 4, 2022. At this time of year, extent was smaller only in two years, i.e. in 2016 and 2020, both strong El Niño years. With the next El Niño, Arctic sea ice extent looks set to reach record lows. 


The NOAA image on the right indicates that, while we're still in the depths of a persistent La Niña, the next El Niño looks set to strike soon.

The image below shows high sea surface temperature anomalies near the Bering Strait on December 2, 2022, with a "hot blob" in the North Pacific Ocean where sea surface temperature anomalies are reaching as high as 7°C or 12.6°F from 1981-2011. The Jet Stream is stretched out vertically from pole to pole, enabling hot air to enter the Arctic from the Pacific Ocean and from the Atlantic Ocean.


The image below shows a forecast for December 5, 2022, of 2m temperature anomalies versus 1979-2000, with anomalies over parts of the Arctic Ocean near the top end of the scale.


On December 6, 2022, the Arctic was 6.63°C or 11.93°F warmer compared to 1979-2000, as illustrated by the image below. 


The image below shows the daily average Arctic air temperature (2m) from 1979 up to December 6, 2022.


Given that we're still in the depth of a persistent La Niña, these currently very high air temperature anomalies indicate that ocean temperatures are very high and that ocean heat is heating up the air over the Arctic. 

Additionally, ocean heat is melting the sea ice from below. 

Accordingly, Arctic sea ice has barely increased in thickness over the past 30 days, as illustrated by the navy.mil animation on the right.

This leaves only a very short time for Arctic sea ice to grow back in thickness before the melting season starts again, which means that there will be little or no latent heat buffer to consume heat when the melting season starts. 

Furthermore, rising temperatures and changes to the Jet Stream contribute to formation of a freshwater lid at the sea surface at higher latitudes, resulting in further heating up of the Arctic Ocean. 

As a result, more heat threatens to penetrate sediments at the seafloor of the Arctic Ocean that contain vast amounts of methane in hydrates and free gas, and result in abrupt release of huge amounts of methane, dramatically pushing up temperatures globally. 

[ The Buffer has gone, feedback #14 on the Feedbacks page ]

The situation is dire and the right thing to do now is to help avoid or delay the worst from happening, through action as described in the Climate Plan.


Links

• Vishop sea ice extent
https://ads.nipr.ac.jp/vishop/#/extent

• NOAA ENSO: Recent Evolution, Current Status and Predictions
https://www.cpc.ncep.noaa.gov/products/analysis_monitoring/lanina/enso_evolution-status-fcsts-web.pdf

• nullschool.net
https://earth.nullschool.net

• Climate Reanalyzer
https://climatereanalyzer.org

• Naval Research Laboratory - HYCOM Consortium for Data-Assimilative Ocean Modeling
https://www7320.nrlssc.navy.mil/GLBhycomcice1-12/arctic.html

• Albedo, latent heat, insolation and more

• Cold freshwater lid on North Atlantic

Thursday, September 8, 2022

Blue Ocean Event 2022?

The image on the right shows a NASA Worldview satellite image of a blue Beaufort Sea (with Barrow, Alaska, at the top left, on September 7, 2022). 

The image shows that there is a lot of open water between the coast of Alaska and the sea ice.

Such a satellite image provides a visual way to determine how much sea ice is present. It can be hard to determine where there is open water and where the sea ice starts; the sea ice is often covered by clouds; furthermore, even when there are no clouds, the question remains what is to be regarded as sea ice and what is to be regarded as water. 

Another way to measure how much sea ice is there is to look at sea ice concentration. Sea ice concentration in the Central Arctic region has been very low for some time. 

The image on the right, from an earlier post, shows that on August 12, 2022, sea ice concentration in a large area close to the North Pole was as low as 0%. 

In the two images below, Nico Sun calculates the impact of albedo loss based on NSIDC sea ice concentration data. The images illustrate why sea ice loss in the Central Arctic region is so important.

The image below shows that further albedo loss in the Barents Sea, which is virtually icefree at the moment, doesn't make much difference now. 


The image below shows that, by contrast, more albedo loss in the Central Arctic region makes much more difference, even in September. 


Arctic sea ice has become extremely thin, so the latent heat buffer loss is also very strong. This loss of the latent heat buffer can continue to result in higher temperatures of the water for a long time, even long after insolation has passed its annual peak on the Northern Hemisphere, thus causing the combined accumulative impact to continue to be high.

Another way to measure how much sea ice is present is to look at the extent of the sea ice. According to many, a Blue Ocean Event starts once the Arctic sea ice falls below 1 million km² in extent.

Arctic sea ice extent was 4.912 million km² on September 6, 2022, which is larger than the extent in many previous years around this time of year (see NSIDC image below). However, the sea ice has become very thin, resulting in many areas where only small pieces of ice are present. 


NSIDC regard a cell to have sea ice if it has at least 15% sea ice, but when regarding a cell to have sea ice if it has at least 50% ice and if that's the case for ⅕ of the cells where there is (some) ice, then we're already in a Blue Ocean Event right now.

So let's have another look at how much of the above 4.912 million km² can be regarded as sea ice, by using the NSIDC map with sea ice concentration as a guide. 

The roughly-sketched outline drawn over the NASA map below indicates that there may only have been some 991 thousand km² of concentrated sea ice left on September 6, 2022 (inset shows NSIDC sea ice concentration for the day). 


As said, it's a rough sketch, so some cells with a higher concentration of sea ice may have been left out. Having said that, we're currently in the depth of a persistent La Niña and the associated lower air temperatures contribute to a relatively larger sea ice extent than would otherwise be the case. 

In conclusion, depending on what is counted as sea ice, we could already be experiencing a Blue Ocean Event right now. 

Further events and developments

A Blue Ocean Event constitutes the crossing of a huge tipping point and, as a strong El Niño looks set to emerge, this could trigger the unfolding of further events and developments leading to extinction of most species (including humans), as: 
  1. a strong El Niño triggers: 
  2. further decline of the Arctic sea ice, with loss of the latent heat buffer, combined with
  3. associated loss of sea ice albedo and
  4. destabilization of seafloor methane hydrates, causing eruption of vast amounts of methane that further speed up Arctic warming and cause
  5. rapid thawing of terrestrial permafrost, resulting in even more emissions,
  6. while the Jet Stream gets even more deformed, resulting in more extreme weather events
  7. causing forest fires, at first in Siberia and Canada and
  8. eventually also in the peat fields and tropical rain forests of the Amazon, in Africa and South-east Asia, resulting in
  9. decline of snow and ice on mountains, at first causing huge flooding, followed by 
  10. drought, heatwaves and urban collapse,
  11. collapse of the Greenland and West-Antarctic ice sheets,
  12. falling away of aerosol masking as civilization grinds to a halt, 
  13. further heating due to gases and particulates from wood and waste burning and biomass decomposition, and 
  14. further heating due to additional gases (including water vapor), cirrus clouds, albedo changes and heat rising up from oceans. 


Importantly, depicted above is only one scenario out of many. Things may eventuate in different order and occur simultaneously, i.e. instead of one domino tipping over the next one sequentially, many events may occur simultaneously and reinforce each other. Further events and developments could be added to the list, such as ocean stratification and stronger storms that can push large amounts of warm salty water into the Arctic Ocean.


Here is another example of such a scenario. Recent studies indicate that human-caused climate change will soon increase El Niño frequency and intensity. Accordingly, the upcoming El Niño may well be strong. As illustrated with above image, we're currently in the depth of a persistent La Niña, which suppresses the temperature rise, whereas the opposite occurs during El Niño, which amplifies the temperature rise, and this especially affects the Arctic, which is already heating up much faster than the rest of the world. Also, the upcoming El Niño may very well coincide with a peak in sunspots in 2025, further pushing up temperatures.

The image below shows that the rise in sea surface temperatures on the Northern Hemisphere has been suppressed during the ongoing La Niña, but as we move into the next El Niño, the seafloor methane tipping point could be crossed even earlier than the current trend indicates, say by 2025. 


One reason for this is that the narrowing temperature difference between the Arctic and the Tropics will further deform the Jet Stream and in turn cause more extreme weather, leading to more loss of sea ice and thus of its capacity to reflect sunlight and act as a buffer against incoming ocean heat.

A huge amount of heat has built up in the North Atlantic off the coast of North America, as illustrated by the image on the right.

Furthermore, the temperature of the water may well be substantially higher some 50 meter below the sea surface than at the sea surface. 

As discussed in an earlier post, rising temperatures result in stronger winds along the path of the Gulf Stream that can make huge amounts of warm, salty water travel from the Atlantic Ocean toward the Arctic and reach shallow parts of the Arctic Ocean such as the East Siberian Arctic Shelf (ESAS), where most of the sea is less than 50 m deep. The danger is illustrated by the Argo float compilation below.


Very high methane levels

The image below, from an earlier post, shows annual global mean methane with a trend added that points at a methane rise that could in 2028 represent a forcing of 780 ppm CO₂e (with a 1-year GWP of 200). 

In other words, the clouds tipping point at 1200 ppm CO₂e could be crossed in 2028 due to the forcing of methane and CO₂ alone, assuming that CO₂ concentration in 2028 will exceed 420 ppm. Moreover, this could happen even earlier, since there are further forcers, while further events and developments could additionally push up the temperature further, as discussed above. Furthermore, the NOAA data used in the above image are for marine surface measurements. More methane tends to accumulate at higher altitudes, as illustrated by the compilation image below. 


NOAA's globally averaged marine surface mean for April 2022 was 1909.9 ppb. The above image shows that, on September 4, 2022 am, the MetOp satellite recorded a mean methane concentration of 1904 ppb at 586 mb, which is close to sea level. At 293 mb, however, the MetOp satellite recorded a mean of 1977 ppb, while at 218 mb it recorded a peak of 2805 ppb. 

Such high methane levels could be caused by destabilization of methane hydrates at the seafloor of the Arctic Ocean, with large amounts of methane erupting (increasing 160 x in volume) and rising up at accelerating speed through the water column (since methane is lighter than water), concentrated in the form of plumes, which makes that less methane gets broken down in the water by microbes and in the air by hydroxyl, of which there is very little in the Arctic in the first place. Such a methane eruption entering the atmosphere in the form of a plume can be hard to detect as long as it still doesn't cover enough of the 12 km in diameter footprint to give a pixel the color associated with high methane levels. 


The above Copernicus image shows a forecast  for September 9, 2022 18 UTC, of methane at 500 hPa. 

In the video below, from this page, Guy McPherson addresses the question: Has the “Methane Bomb” Been Triggered?


Conclusion

The situation is dire and the right thing to do now is to help avoid or delay the worst from happening, through action as described in the Climate Plan


Links

• NSIDC - Frequently asked questions

• NASA Worldview

• NSIDC - sea ice concentration

• Nico Sun - CryosphereComputing

• NSIDC - sea ice extent

• More Frequent El Niño Events Predicted by 2040
Cutting-edge models predict that El Niño frequency will increase within 2 decades because of climate change, regardless of emissions mitigation efforts.

• Emergence of climate change in the tropical Pacific - by Yun Ying et al. 
https://www.nature.com/articles/s41558-022-01301-z

• Climate Reanalyzer

• Argo Float

• Monitoring of atmospheric composition using the thermal infrared IASI/MetOp sounder - by C. Clerbaux et al. 

• NOAA - MetOp satellite methane data 

• Copernicus methane forecasts

• Clouds feedback and tipping point

• NOAA - global methane

• NOAA - Sea surface temperature anomalies on the Northern Hemisphere 

• NOAA - Monthly Temperature Anomalies Versus El Niño

• NOAA - ENSO: Recent Evolution, Current Status and Predictions
https://www.cpc.ncep.noaa.gov/products/analysis_monitoring/lanina/enso_evolution-status-fcsts-web.pdf

• WMO predicts first “triple-dip” La Niña of the century