Sunday, December 11, 2022

Politicians for sale

Are politicians for sale? 

How can it be measured whether politicians are for sale and to what extent this occurs? 

One measure of how much looters and polluters are buying politicians could be this: How fast is methane accelerating? 

Rise in methane and rise in temperature

The rise in methane is vitally important, given methane's potential to rapidly push up temperatures. 

Arguably the most important metric related to climate change is surface temperature on land, as illustrated by the image below from an earlier post. The image was created with a July 16, 2022 screenshot from NASA customized analysis plots and shows that the February 2016 (land only) anomaly from 1886-1915 was 2.94°C or 5.292°F.


Extinction

Land-only anomalies are important. After all, most people live on land, where temperatures are rising even faster than they are rising globally, and humans will likely go extinct with a rise of 3°C above pre-industrial, as illustrated by the image below, from an analysis in earlier post.


Note that in the above plot, anomalies are measured versus 1886-1915, which isn't pre-industrial. The image raises questions as to what the temperature rise would look like when using a much earlier base, and how much temperatures could rise over the next few years.

What can be done about it?

The next question is: What can be done about it? To avoid politicians getting bought by looters and polluters, action on climate change is best implemented locally, with Local People's Courts ensuring that implementation is science-based.


Conclusions

The situation is dire and the right thing to do now is to help avoid or delay the worst from happening, through action as described in the Climate Plan and posts at Arctic-news.blogspot.com


Links

• Human Extinction by 2025? 

• NASA customized analysis plots 

• When will we die? 
https://arctic-news.blogspot.com/2019/06/when-will-we-die.html

• Pre-industrial 


Monday, December 5, 2022

Arctic Ocean overheating

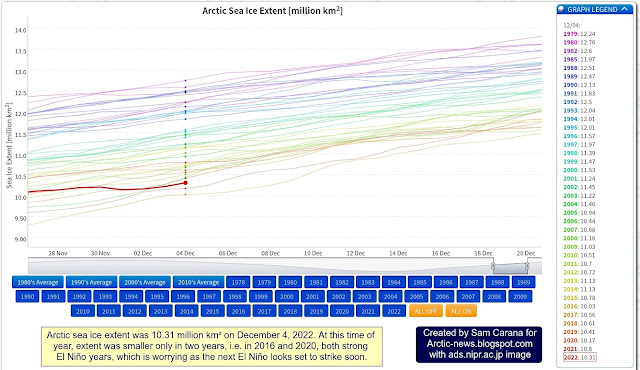
Arctic sea ice extent was 10.31 million km² on December 4, 2022. At this time of year, extent was smaller only in two years, i.e. in 2016 and 2020, both strong El Niño years. With the next El Niño, Arctic sea ice extent looks set to reach record lows. 


The NOAA image on the right indicates that, while we're still in the depths of a persistent La Niña, the next El Niño looks set to strike soon.

The image below shows high sea surface temperature anomalies near the Bering Strait on December 2, 2022, with a "hot blob" in the North Pacific Ocean where sea surface temperature anomalies are reaching as high as 7°C or 12.6°F from 1981-2011. The Jet Stream is stretched out vertically from pole to pole, enabling hot air to enter the Arctic from the Pacific Ocean and from the Atlantic Ocean.


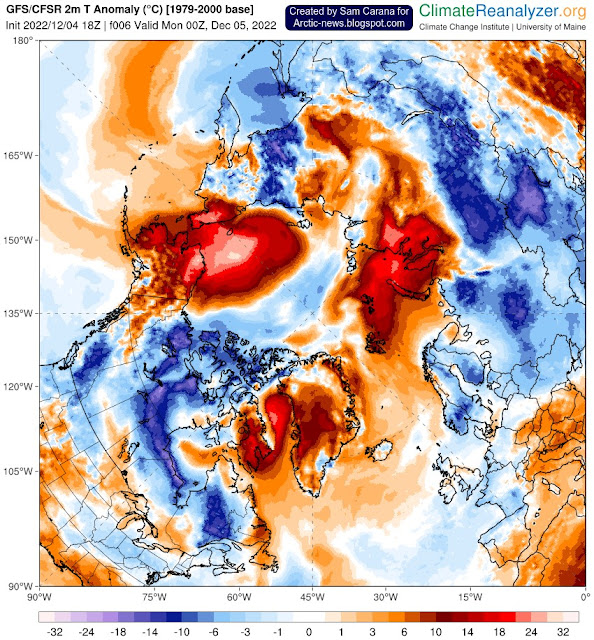
The image below shows a forecast for December 5, 2022, of 2m temperature anomalies versus 1979-2000, with anomalies over parts of the Arctic Ocean near the top end of the scale.


On December 6, 2022, the Arctic was 6.63°C or 11.93°F warmer compared to 1979-2000, as illustrated by the image below. 


The image below shows the daily average Arctic air temperature (2m) from 1979 up to December 6, 2022.


Given that we're still in the depth of a persistent La Niña, these currently very high air temperature anomalies indicate that ocean temperatures are very high and that ocean heat is heating up the air over the Arctic. 

Additionally, ocean heat is melting the sea ice from below. 

Accordingly, Arctic sea ice has barely increased in thickness over the past 30 days, as illustrated by the navy.mil animation on the right.

This leaves only a very short time for Arctic sea ice to grow back in thickness before the melting season starts again, which means that there will be little or no latent heat buffer to consume heat when the melting season starts. 

Furthermore, rising temperatures and changes to the Jet Stream contribute to formation of a freshwater lid at the sea surface at higher latitudes, resulting in further heating up of the Arctic Ocean. 

As a result, more heat threatens to penetrate sediments at the seafloor of the Arctic Ocean that contain vast amounts of methane in hydrates and free gas, and result in abrupt release of huge amounts of methane, dramatically pushing up temperatures globally. 

[ The Buffer has gone, feedback #14 on the Feedbacks page ]

The situation is dire and the right thing to do now is to help avoid or delay the worst from happening, through action as described in the Climate Plan.


Links

• Vishop sea ice extent
https://ads.nipr.ac.jp/vishop/#/extent

• NOAA ENSO: Recent Evolution, Current Status and Predictions
https://www.cpc.ncep.noaa.gov/products/analysis_monitoring/lanina/enso_evolution-status-fcsts-web.pdf

• nullschool.net
https://earth.nullschool.net

• Climate Reanalyzer
https://climatereanalyzer.org

• Naval Research Laboratory - HYCOM Consortium for Data-Assimilative Ocean Modeling
https://www7320.nrlssc.navy.mil/GLBhycomcice1-12/arctic.html

• Albedo, latent heat, insolation and more

• Cold freshwater lid on North Atlantic

Saturday, November 12, 2022

There is no Carbon Budget

[ Sam Carana: "There is no carbon budget!" ]

In the above image, the atmosphere is presented as a "bucket" filling with greenhouse gas pollution from fossil fuel use from 1870 to 2020. The image depicts the idea that there is some carbon budget left, before 1.5°C above pre-industrial will be reached. The Global Carbon Project has just issued an update of what it refers to as the Global Carbon Budget

[ adapted from Global Carbon Budget 2022 ]
The Global Carbon Project insists that there still is some carbon budget left, even as global fossil fuel C₂O emissions in 2021 were higher than 2020, and are projected to be higher again in 2022 than 2021, as illustrated by the image on the right.

Arctic-news has long said that the suggestion of a carbon budget is part of a narrative that polluters seek to spread, i.e. that there was some budget left to be divided among polluters, as if polluters could safely continue to pollute for years to come before thresholds would be reached that could make life uncomfortable, such as a rise of 1.5°C above pre-industrial. 

For starters, an earlier analysis warns that the 1.5°C threshold may have been crossed long ago. The situation looks set to soon become even more catastrophic. The upcoming El Niño could make a difference of more than 0.5°C over the next few years. Additionally, there will be a growing impact of sunspots, forecast to peak in July 2025. 

Arctic-news has long warned about rising temperatures, not only due to high greenhouse gas levels, but also due to a number of events and developments including a rise of up to 1.6°C due to loss of Arctic sea ice and permafrost, and associated changes, a rise of up to 1.9°C due to a decrease in cooling aerosols, and a rise of up to 0.6°C due to an increase in warming aerosols and gases as a result of more biomass and waste burning and forest fires.

More recent posts also warn that the rise could cause the clouds tipping point at 1200 ppm CO₂e to be crossed. Accordingly, the total temperature rise could be as high as 18.44°C from pre-industrial by 2026. Keep in mind that humans are likely to go extinct with a rise of 3°C, as discussed in an earlier post.

[ image from quotes, text from 2013 post ]
So, there is no carbon budget left. There is just a huge amount of carbon to be removed from the atmosphere and oceans, a "debt" that polluters would rather be forgotten or passed on to future generations.

This "debt" has been growing since well before the industrial revolution started. Long ago, people should have started to reduce emissions and remove greenhouse gases, as well as take further action to improve the situation, and Arctic-news has long said that comprehensive and effective action must be taken without delay.

The IPCC has betrayed the very scientific basis it was supposed to reflect

The IPCC keeps insisting that there was a carbon budget, and this goes hand in hand with peddling the notion that the temperature rise was still less than 1.5°C. As discussed in an earlier analysis, the temperature has been rising for thousands of years and may have crossed the 1.5°C mark long ago.

Furthermore, the Paris Agreement instructs the IPCC to specify pathways to limit the rise to 1.5°C. In its arrogance, the IPCC on the one hand keeps insisting that 1.5°C has not been crossed, while on the other hand bluntly refusing to specify credible pathways to keep it that way. The untenability of this attitude is illustrated by a recent UN news release Climate change: No 'credible pathway' to 1.5C limit, UNEP warns.

Many studies point at ways improvements could be facilitated, such as by support for solar panels, wind turbines, heat pumps, biochar, vegan-organic food, air taxis, etc. This analysis and this earlier post agree and also conclude that local feebates work best and that it is preferable for decision-making regarding their implementation to be delegated to local communities. The IPCC on the one hand refuses to contemplate policy instruments, yet on the other hand it keeps peddling pet projects pushed by polluters, such as cap-and-trade, nuclear power, CCS, bioenergy and BECCS (bioenergy with carbon capture and storage), as illustrated by the image below. 
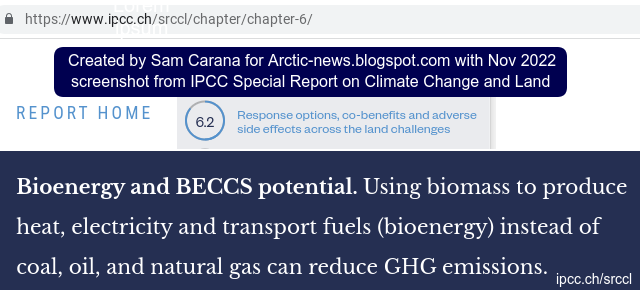
[ IPCC keeps peddling pet projects pushed by polluters ]

The IPCC keeps downplaying the potential for a huge temperature rise

The IPCC keeps downplaying developments that could lead to a huge temperature rise. Such developments include:

• Rising greenhouse levels due to more emissions by people and collapse of the biosphere, and due to more emissions from forest, peatlands and waste fires;

• Collapse of the cryosphere, including decline of permafrost, glaciers and sea ice loss and latent heat buffer loss resulting in more clouds over the Arctic, more ocean heat moving into the Arctic Ocean and associated seafloor methane releases;

• Loss of cloud reflectivity and the potential for CO₂e levels to cross the clouds tipping point;

• Loss of the aerosol masking effect;

• More water vapor in the atmosphere in line with rising temperatures and as a result from loss of sea ice.

Altogether, these developments have the potential to raise the temperature by 18.44°C from pre-industrial, as discussed at the extinction page

One of the most harmful ways in which the IPCC has been downplaying the potential for temperatures to rise is by using a too low Global Warming Potential (GWP) for methane. 

This is illustrated by the image on the right, from an earlier post. In the IPCC special report Climate Change and Land a GWP for methane is used of 28 over 100 years to assess the impact of AFOLU (agriculture, forestry, and other land use) versus the impact of fossil fuel, etc. The image illustrates the difference in impact when a GWP for methane of 171 over a few years is used instead.

The IPCC seeks to justify its use of a GWP of 28 by focusing on a pulse of methane over 100 years. The impact of such a pulse declines over the years, since the lifetime of methane is only 11.8 years. However, using a pulse to calculate the impact of the total methane in the atmosphere isn't appropriate, because methane doesn't just disappear, but is constantly replenished, or rather is more than replenished, as illustrated by the image further below. Because of this and because of the potentially huge temperature rise within a few years, it makes more sense to calculate the impact of methane over a short period. Over one year, methane's GWP is 200, as discussed at this page. A GWP of 200 is used in the image below (right axis). 

[ from earlier post ]
Very threatening is a rise in methane that kept following the trend depicted in the above image, created with WMO 2015-2021 global annual surface mean methane abundances, with an added trend that points at a potential mean global abundance of methane of more than 700 ppm (parts per million) CO₂e by the end of 2026. The image warns that, if such a trend kept continuing, the clouds tipping point could be crossed as a result of the forcing of methane alone.
The above NOAA image shows a methane monthly average for November 2022 of more than 1950 parts per billion (ppb) at Mauna Loa, Hawaii.  

Conclusions

The situation is dire and the right thing to do now is to help avoid or delay the worst from happening, through action as described in the Climate Plan and at the recent post Transforming Society.

Links

• Global Carbon Project - Global Carbon Budget 2022 
https://www.globalcarbonproject.org/carbonbudget/index.htm

• The upcoming El Nino and further events and developments (2022) 
https://arctic-news.blogspot.com/2022/11/the-upcoming-el-nino-and-further-events-and-developments.html

• Arctic Methane Monster (2013)
https://arctic-news.blogspot.com/2013/09/arctic-methane-monster.html

• The Clouds Feedback and the Clouds Tipping Point
https://arctic-news.blogspot.com/p/clouds-feedback.html

• Methane levels threaten to skyrocket (2014) 
https://arctic-news.blogspot.com/2014/09/methane-levels-threaten-to-skyrocket.html

• Pre-industrial
https://arctic-news.blogspot.com/p/pre-industrial.html

• Sunspots
https://arctic-news.blogspot.com/p/sunspots.html

• Extinction
https://arctic-news.blogspot.com/p/extinction.html

• NOAA - Global Monitoring Laboratory
https://gml.noaa.gov/dv/iadv

• Methane Keeps rising
https://arctic-news.blogspot.com/2022/10/methane-keeps-rising.html

• When will we die? 
https://arctic-news.blogspot.com/2019/06/when-will-we-die.html

• IPCC - Special Report on Climate Change and Land
https://www.ipcc.ch/srccl

• Climate change: No ‘credible pathway’ to 1.5C limit, UNEP warns 
https://news.un.org/en/story/2022/10/1129912

• Human Extinction by 2025? 
https://arctic-news.blogspot.com/2022/07/human-extinction-by-2025.html

• Climate Plan
https://arctic-news.blogspot.com/p/climateplan.html

• Transforming Society (2022)
https://arctic-news.blogspot.com/2022/10/transforming-society.html


Tuesday, November 8, 2022

The upcoming El Nino and further events and developments

The upcoming El Niño


The above image shows a forecast for August 2023 of the sea surface temperature anomaly in degrees Celsius, from tropicaltidbits.com. The forecast shows temperatures that are higher than average (based on 1984-2009 model climatology) for the tropical Pacific region indicative of an El Niño event. 


By contrast, the above forecast for November 2022 shows temperatures in the tropical Pacific region that are much lower than average, indicating that we're still in the depths of a persistent La Niña. 


By comparison, the above nullschool.net image shows the sea surface temperature anomaly for August 15, 2022, i.e. less than three months ago, when sea surface temperature anomalies in the tropical Pacific region were similar to what they are now, while anomalies in the Arctic were much higher than they are now.

Moving from the bottom of the current La Niña to the peak of a strong El Niño could make a difference of more than half a degree Celsius, as indicated by the image below, adapted from NOAA


The NOAA image on the right confirms that we're still in the depths of a persistent La Niña. NOAA predicts a transition out of La Niña from now on. Note that the NOAA forecast goes up to June/July/August 2023. 

Sunspots

The upcoming El Niño looks set to coincide with a peak in sunspots. The peak in sunspots looks set to reach a higher than expected maximum impact around July 2025. An analysis in an earlier post concludes that the rise in sunspots from May 2020 to July 2025 could make a difference of some 0.15°C.

Accordingly, the impact of the upcoming El Niño could make a difference of more than 0.5°C over the next few years. In addition, there will be a growing impact of sunspots, forecast to peak in July 2025. 

Methane keeps rising at accelerating pace

Furthermore, there are a number of events and developments that could additionally speed up the temperature rise, including greenhouse gas emissions that keep rising. Methane is particularly important, due to its high potency as a greenhouse gas, and its abundance has also been growing at accelerating pace over the past few years. 


The above image, adapted from Copernicus, shows a forecast for November 14, 2022, 03 UTC at 500 hPa, with high levels of methane showing up over the Arctic.


The above image shows a peak methane level of 2687 ppb (parts per billion) recorded by the NOAA-20 satellite at 399.1 mb on November 3, 2022 AM.


The above image shows that recent methane daily averages at Mauna Loa, Hawaii, are between 1900 ppb and 2000 ppb (recent monthly average is above 1950 ppb). 


The above image shows that recent methane daily averages at Barrow, Alaska are even higher, between 2000 ppb and 2100 ppb. 

[ from earlier post ]
Very threatening is a rise in methane that kept following the trend depicted in the above image, created with WMO 2015-2021 global annual surface mean methane abundances, with an added trend that points at a potential mean global abundance of methane of more than 700 ppm (parts per million) CO₂e by the end of 2026. The image warns that, if such a trend kept continuing, the clouds tipping point could be crossed as a result of the forcing of methane alone.  

Further events and developments that could speed up the temperature rise

The rise in methane is alarming and further greenhouse gases also keep rising, such as nitrous oxide, water vapor and carbon dioxide, due to high emissions by people and due to feedbacks that are kicking in, such as forest and waste fires, flooding and further extreme weather events, permafrost loss in the Arctic and reduced carbon sinks. Furthermore, maximum warming occurs about one decade after a carbon dioxide emission, so the full warming wrath of the carbon dioxide emitted over the past decade is still to come, and an extra 0.5°C rise by 2026 seems possible due to carbon dioxide alone. 

[ see the Extinction page ]
When including further events and developments, the clouds tipping point could be crossed in a matter of years and even with far less methane than the above trend warns about. 

As an earlier post mentions, the upcoming temperature rise on land on the Northern Hemisphere could be so high that it will cause much traffic, transport and industrial activity to grind to a halt, resulting in a reduction in aerosols that are currently masking the full wrath of global warming.

The post points at a recent analysis that finds a stronger impact than previously thought for liquid water path adjustment, which supports the 2016 warning that by 2026 there could be a 1.9°C temperature rise due to a decrease in cooling aerosols, while there could be additionally be a 0.6°C temperature rise due to an increase in warming aerosols and gases as a result of more biomass and waste burning and forest fires by 2026. 

Furthermore, the 2016 analysis warns about an additional temperature rise of up to 1.6°C due to loss of Arctic sea ice and permafrost, and associated changes.

When including the temperature rise that has already unfolded from pre-industrial and the impact of all such events and developments, the temperature could rise by more than 10°C over the next few years, corresponding with a CO₂e of over 1200 ppm, which implies that the total temperature rise could be as high as 18.44°C by 2026. 

Keep in mind that humans are likely to go extinct with a rise of 3°C, as illustrated by the image below, from an analysis discussed in an earlier post.


The situation is dire and the right thing to do now is to help avoid or delay the worst from happening, through action as described in the Climate Plan.


Links

• Tropicaltidbits.com 
https://www.tropicaltidbits.com

• nullschool.net 
https://earth.nullschool.net

• NOAA Climate Prediction Center - ENSO: Recent Evolution, Current Status and Predictions
https://www.cpc.ncep.noaa.gov/products/analysis_monitoring/lanina/enso_evolution-status-fcsts-web.pdf


• NOAA National Centers for Environmental Information, State of the Climate: Monthly Global Climate Report for October 2022, retrieved November 16, 2022


• Copernicus methane at 500 hPa, forecast for November 78, 2022, 03 UTC

• NOAA-20 satellite

• NOAA - Global Monitoring Laboratory
https://gml.noaa.gov/dv/iadv


• Invisible ship tracks show large cloud sensitivity to aerosol - by Peter Manhausen et al.
https://www.nature.com/articles/s41586-022-05122-0

• Extinction
https://arctic-news.blogspot.com/p/extinction.html

• When will we die?