

 |
| [ Nov 2025 temperature anomaly forecast ] |


High concentrations of greenhouse gases such as carbon monoxide (CO₂) and of other gases result in high temperatures. The daily CO₂ at Mauna Loa, Hawaii, was 430.60 parts per million (ppm) on March 7, 2025, the highest daily average on record. To find CO₂ levels this high back in history, one needs to go back millions of years, as illustrated by the image below, from an earlier post.


 |
| [ from earlier post, click on images to enlarge ] |
 |
| [ from an earlier post ] |
Methane in the atmosphere could be doubled soon if a trend unfolds as depicted in the image below. A rapid rise is highlighted in the inset and reflected in the trend.
 |
| [ from earlier post ] |
A rise like the one depicted in the trend could eventuate as rising ocean heat destabilizes methane hydrates contained in sediments at the seafloor of the Arctic Ocean. The temperature rise in the Arctic would accelerate since the methane would have a huge immediate impact on temperatures over the Arctic and cause depletion of hydroxyl, of which there is very little in the atmosphere over the Arctic in the first place. Such a rise in methane would also cause dramatic increases in tropospheric ozone and in stratospheric water vapor. A large increase in methane over the Arctic would also trigger massive forest fires and tundra fires, devastating terrestrial permafrost and resulting in huge amounts of further emissions.
 |
| [ from earlier post ] |

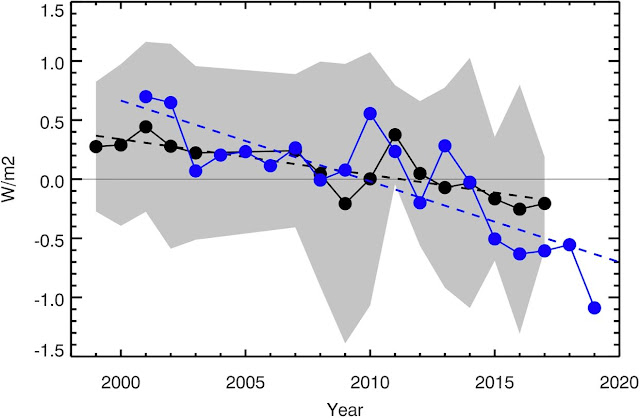 |
| [ Earthshine annual albedo anomaly expressed as reflected flux in W/m². CERES data. ] |
 |
| [ Arctic-sea-ice extent, click on images to enlarge ] |
Arctic sea ice area typically reaches its annual minimum about half September. Arctic sea ice area was only 2.24 million km² on September 12, 2012, i.e. 1.24 million km² away from a Blue Ocean Event. On March 19, 2025, Arctic sea ice area was 1.34 million km² lower than on March 19, 2012, as also discussed in an earlier post. Therefore, would there be such a difference about half September 2025, a Blue Ocean Event could be declared.

10. Latent heat buffer loss - as sea ice, permafrost and glaciers disappear.
 |
| [ Arctic sea ice volume, click to enlarge ] |
Sea ice acts as a Buffer that previously consumed much incoming ocean heat. As temperatures rise, sea ice thins and the Buffer disappears.
The disappearance of the Buffer occurs at the same time as increasingly larger amounts of ocean heat are entering the Arctic Ocean from the North Atlantic Ocean and the Pacific Ocean.
 |
| [ Arctic sea ice volume, click to enlarge ] |
More heat in turn threatens to reach sediments at the seafloor of the Arctic Ocean and destabilize hydrates contained in the these sediments, resulting in eruptions of huge amounts of methane from hydrates as well as from methane stored in the form of free gas underneath these hydrates.
 |
| [ The Buffer is gone ] |
 |
| [ formation of a freshwater lid at the surface of the North Atlantic ] |
 |
| [ from Moistening Atmosphere ] |
 |
| [ from earlier post ] |
A 2013 post issued a runaway global warming warning, i.e. that a 2°C global temperature rise could eventuate by 2024 and that a 10°C global temperature rise could eventuate by 2040. A post later in 2013 warned that the global temperature rise could continue beyond 20°C, with the added comment that it is in many respects irrelevant whether a temperature rise of 20°C will be reached in 2049, 2050 or 2051; the point is, as Sam Carana said in 2013, that we're facing a global temperature rise of potentially more than 20°C and that such a temperature rise would devastate Earth and drive most species (including human beings) to extinction well before such a temperature rise is reached.
A 2015 post shows an update of the 10°C global temperature rise image, as well as an image with estimates of the climate-related deaths that could occur would such a rise eventuate, while a post later in 2015 shows an update of the warning of a 20°C global temperature rise combined with the accumulated climate-related deaths in a single image (copy below).

Sadly, politicians have long ignored warnings that a steep rise in temperature could occur and that this would result in a horrific number of associated deaths. In some respects, warnings were confusing and too conservative, e.g. the above image may have given the wrong impression that the temperature rise would be gradual and that we had until the year 2054 to get into action, whereas over the years indications have become ever stronger that a huge rise could take place within a few years, even within one year, as discussed below.
A warning was issued in 2016 that the temperature could rise by more than 10°C by 2026. The 2016 analysis is recreated below. The most recent NASA data gives the February 2016 temperature an anomaly of 1.35°C above 1951-1980. A number of non-linear trends can be calculated based on the anomalies, including one trend based on 2000-2016 data pointing at 10°C getting crossed by 2026 and another trend based on 1880-2016 data pointing at 1.5°C getting crossed in 2030, as shown by the chart and the details below.

 |
| [ from the Extinction page ] |
The clouds tipping point is mentioned above. A 2019 study concludes that crossing a tipping point of 1200 ppm CO₂e could cause the disappearance of marine stratus clouds, resulting in a global temperature rise of 8°C, which would come on top of the rise associated with greenhouse gases reaching 1200 ppm CO₂e.
The image on the right illustrates how much conditions and mechanisms could each contribute to such a huge temperature rise.
Very fast mechanisms include panic. As more people start to realize how dire the situation is and as they seek to occupy the last few habitable areas left, more people may stop showing up for work, resulting in a rapid loss of the aerosol masking effect, as industries that now co-emit cooling aerosols (such as sulfates) come to a grinding halt (mechanism 7 above).
As temperatures rise, huge fires could also break out in forests, peatlands, grassland and urban areas (including backyards, landfills and buildings, in particular warehouses containing flammable materials, chemicals and fluorinated gases), further contributing to more emissions that speed up the temperature rise.
As the likeliness of a huge and accelerating temperature rise, the severity of its impact, and the ubiquity and the imminence with which it will strike all become more manifest—the more sobering it is to realize that a mere 3°C rise may suffice to cause human extinction. Indeed, humans will likely go extinct with a 3°C rise and most life on Earth will disappear with a 5°C rise, as discussed in an earlier post and illustrated by the image below.
 |
| [ from earlier post ] |
The situation is dire and the precautionary principle calls for rapid, comprehensive and effective action to reduce the damage and to improve the situation, as described in this 2022 post, where needed in combination with a Climate Emergency Declaration, as discussed at this group.

Links
• Climate Reanalyzer
https://climatereanalyzer.org
• Tropical Tidbits
https://www.tropicaltidbits.com
• Past and Future CO2 - guest post by Gavin Foster, Dana Royer and Dan Lunt (1 May 2014)
https://skepticalscience.com/Past-and-Future-CO2.html
• NOAA - ENSO: Recent Evolution, Current Status and Predictions - 31 March 2025
https://www.cpc.ncep.noaa.gov/products/analysis_monitoring/lanina/enso_evolution-status-fcsts-web.pdf
• Leon Simons - Earth's Energy Imbalance
https://bsky.app/profile/leonsimons.bsky.social/post/3llcffaa65s2d
• High sensitivity of cloud formation to aerosol changes - by Annele Virtanen et al. (2025)
https://www.nature.com/articles/s41561-025-01662-y
https://www.facebook.com/groups/arcticnews/posts/10162536396379679
• Arctic and Antarctic Data Archive System (ADS) of the National Institute of Polar Research of Japan
https://ads.nipr.ac.jp
• Kevin Pluck - seaice.visuals.earth
https://seaice.visuals.earth
• Danish Meteorological Institute - Arctic sea ice volume and thickness
https://ocean.dmi.dk/arctic/icethickness/thk.uk.php
• Albedo, latent heat, insolation and more
https://arctic-news.blogspot.com/p/albedo.html
• Broadband radiometric measurements from GPS satellites reveal summertime Arctic Ocean Albedo decreases more rapidly than sea ice recedes - by Philip Dreike et al.
https://www.nature.com/articles/s41598-023-39877-x
https://www.facebook.com/groups/arcticnews/posts/10162488740079679
• Feedbacks
https://arctic-news.blogspot.com/p/feedbacks.html
• Sunspots
https://arctic-news.blogspot.com/p/sunspots.html
https://arctic-news.blogspot.com/2025/03/el-nino-in-2025.html
• The Clouds Feedback and the Clouds Tipping Point
https://arctic-news.blogspot.com/p/clouds-feedback.html
• Mechanisms behind a steep rise in temperature
https://www.facebook.com/photo/?fbid=10152700073185161&set=a.10150592349770161
https://www.facebook.com/photo.php?fbid=10153529185720161&set=a.10150592349770161
https://www.facebook.com/photo/?fbid=10155029312940161&set=a.10150592349770161
https://www.facebook.com/groups/arcticnews/posts/10162524772914679
• Transforming Society
https://arctic-news.blogspot.com/2022/10/transforming-society.html
• Climate Plan
https://arctic-news.blogspot.com/p/climateplan.html
• Climate Emergency Declaration
https://arctic-news.blogspot.com/p/climate-emergency-declaration.html