Monday, July 10, 2023

Arctic sea ice July 2023

World temperatures during each of the past 16 days have been higher than they have been for millions of years. Moreover, the temperature is now rising faster than during any period before, and could rise 18.44°C (versus pre-industrial) by the year 2026.


In each of the past 16 days, the temperature has been higher than the peak temperature reached in previous years in the record going back to 1979, i.e. 16.92°C (62.46°F) reached on July 24, 2022 (orange), as well as on August 13+14, 2016.
July   3, 2023: 17.01°C or 62.62°F
July   4, 2023: 17.18°C or 62.92°F
July   5, 2023: 17.18°C or 62.92°F
July   6, 2023: 17.23°C or 63.01°F
July   7, 2023: 17.20°C or 62.96°F
July   8, 2023: 17.17°C or 62.91°F
July   9, 2023: 17.11°C or 62.80°F
July 10, 2023: 17.12°C or 62.82°F
July 11, 2023: 17.08°C or 62.74°F
July 12, 2023: 17.04°C or 62.67°F
July 13, 2023: 16.98°C or 62.56°F
July 14, 2023: 16.94°C or 62.49°F
July 15, 2023: 16.99°C or 62.58°F
July 16, 2023: 17.03°C or 62.65°F
July 17, 2023: 17.11°C or 62.80°F
July 18, 2023: 17.17°C or 62.91°F
The comparison with the year 2016 is important, since 2016 was a strong El Niño year and the peak temperature in that year was reached in August. Therefore, if indicative, temperatures in 2023 may reach even higher peaks later this month and in August, which seems confirmed by predictions of the currently unfolding El Niño, such as the above image from Copernicus, showing El Niño gaining in strength.

Arctic Ocean heating up

The Arctic reached high temperatures on July 9, 2023, as illustrated by the combination image below, created with nullschool.net images.

[ click on images to enlarge ]
1. Firstly, the water of the Arctic Ocean heats up as it receives direct heat from sunlight. The globe on the right on the above combination image shows that on July 9, 2023, a temperature of 33°C or 91.3°F was recorded in Canada over land near the Arctic Ocean and near the Mackenzie River (green circle), with the heatwave on land extending over the Arctic Ocean. As the globe at the center shows, sea surface temperature anomalies as high as 13.2°C or 23.7°F were recorded that day nearby, in the area marked by the green circle. 

2. Hot water from rivers ending in the Arctic Ocean is another way the water is heating up, as also illustrated by the above image. 

The above globe on the left shows that, on July 9, 2023, sea surface temperatures as high as 13.5°C or 56.4°F were recorded at a location nearby location where the Mackenzie River flows into the Arctic Ocean (at the green circle), while on July 23, 2023, the sea surface was 13.8°C or 24.8°F hotter than in 1981-2011, at a nearby location where the Mackenzie River is flowing into the Arctic Ocean.  

As illustrated by the image on the right, the sea surface was 18.4°C or 33°F hotter than in 1981-2011 where the Ob River meets the Kara Sea (at the green circle) on July 24, 2023.  

The image on the right shows sea surface temperatures in the Bering Strait as high as 18.8°C or 65.4°F on July 27, 2023. The water heats up strongly where hot water from rivers and run-off from rainwater enters the Bering Strait. 

3. Yet another way heat is entering the Arctic Ocean is from oceans, i.e. from the North Atlantic Ocean and the Pacific Ocean, and this is melting the sea ice from below. 

The image below, created with Climate Reanalyzer images, shows that the North Atlantic sea surface temperature was 24.8°C on July 21, 2023 (black), no less than 1.2°C higher than the 23.6°C recorded on July 21, 2022 (orange).


As the above image also shows, a record high temperature was reached on the North Atlantic of 24.9°C on September 4, 2022. 

The comparison with the peak in 2022 is important, as it was reached at a time when La Niña was suppressing the temperature, whereas now El Niño is strongly pushing up the temperature. Therefore, if the 1.2°C difference is indicative, temperatures above 26°C can be expected for the North Atlantic in September this year.

The image on the right shows sea surface temperatures as high as 33.6°C or 92.4°F off the Florida coast (green circle) on July 13, 2023.

A buoy in Manatee Bay in the Upper Keys south of Florida recorded a water temperature of 38.89°C or 101.1°F on July 24, 2023.

The image below shows sea surface temperatures as high as 33°C or 91.4°F on July 27, 2023.


The video below gives a sequential view of the situation:


The Gulf Stream is pushing ocean heat toward the Arctic Ocean, as illustrated by the image below.


It takes some time for peak ocean heat to reach the Arctic Ocean. Arctic sea ice typically reaches an annual minimum extent about mid-September.

As the above image also shows, a sea surface temperature east of Svalbard of 10.6°C or 51°F was recorded on July 15, 2023 (at the green circle).

Arctic sea ice under threat

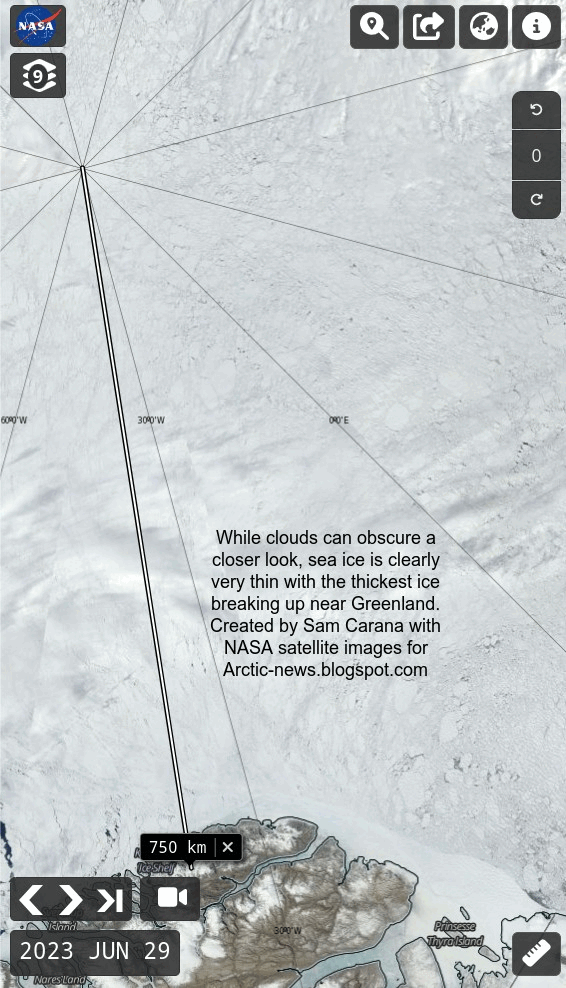
As described in earlier posts such as this one, this rapid temperature rise threatens to cause Arctic sea ice to disappear.

The three images on the right, adapted from University of Bremen, shows that Arctic sea ice thickness is very vulnerable. 

The top image shows that most Arctic sea ice was less than 20 cm thick on July 16, 2023.

The second image on the right shows Arctic sea ice concentration on July 9, 2023.

The image underneath shows sea ice age for the week of June 25 to July 1, 2023, from NSIDC.

More generally, the rapid temperature rise threatens to cause numerous feedbacks to accelerate and further developments to occur such as crossing of tipping points, with the danger that the temperature will keep rising.

Ominously, some very high methane levels were recorded recently at Barrow, Alaska, as illustrated by the NOAA image below.

Conclusion

The outlook is dire and is getting more dire every day.

This calls for a Climate Emergency Declaration and implementation of comprehensive and effective action, as described in the Climate Plan with an update at Transforming Society


Links


• Nullschool
https://earth.nullschool.net

• Climate Reanalyzer - sea surface temperature

• Potential world record: South Florida ocean temperature surges beyond 100 degrees 

• Copernicus

• University of Bremen - Arctic sea ice
https://seaice.uni-bremen.de/start

• The Threat
https://arctic-news.blogspot.com/p/threat.html

• Climate Plan
https://arctic-news.blogspot.com/p/climateplan.html

• NSIDC - Mid-summer bliss - sea ice age
https://nsidc.org/arcticseaicenews/2023/07/mid-summer-bliss

• NOAA - Global Monitoring Laboratory - Barrow, Alaska


Thursday, July 6, 2023

Dire situation gets more dire every day

Conditions are dire


The world temperature was at a record high 17.23°C or 63.01°F on July 6, 2023 (black). The maximum temperature in 2022 (orange) and in 2016 (grey) was 16.92°C or 62.46°F (on July 24, 2022, and on August 13+14, 2016). The year 2016 is important, since there was a strong El Niño in 2016 and we're now again in an El Niño. 

As the image below adds, the 17.23°C temperature recorded on July 6, 2023, is a daily value, but if indicative for July 2023, the closest value for CMIP5 RCP8.5 would be 17.255°C, projected to occur in July 2035 (13 years away from now).

[ The international consortium Coupled Model Intercomparison Project (CMIP)
defines scenarios for use in climate projections. Its CMIP5 scenario (an average of
39 models of near-surface temperature and precipitation, and mean sea level pressure)
can be used in combination with Representative Concentration Pathways (RCP). ]

Why is the temperature rising so fast? 

The image below mentions a number of contributors, with charts added from an earlier post

[ click on images to enlarge ]

1. Emissions are high and greenhouse gas levels keep rising, increasing Earth's Energy Imbalance

2. We did come out of a La Niña that has for years been suppressing temperatures and we are now in an El Niño. A 2023 study led by Tao Lian predicts the current El Niño to be strong. Moving from the bottom of a La Niña to the peak of a strong El Niño could make a difference of more than half a degree Celsius, as discussed in an earlier post. Temperature anomalies can be very high during an El Niño. The image below shows that February 2016 on land was 3.28°C (5.904°F) hotter than 1880-1896, and 3.68°C (6.624°F) hotter compared to February 1880 on land. Note that 1880-1896 is not pre-industrial, the rise will be even larger when using a genuinely pre-industrial base.
The above image, from an earlier post, adds a poignant punchline: Looking at global averages over long periods is a diversion, peak temperature rise is the killer!

[ click on images to enlarge ]
3. The June 2023 number of sunspots is more than twice as high as predicted, as illustrated by the image on the right, from an earlier post and adapted from NOAA. If this trend continues, the rise in sunspots forcing from May 2020 to July 2025 may well make a difference of more than 0.25°C, a recent analysis found.

4. The January 2022 submarine volcano eruption near Tonga did add a huge amount of water vapor to the atmosphere, as discussed in an earlier post and also at facebook. Since water vapor is a potent greenhouse gas, this further contributes to speeding up the temperature rise. A 2023 study calculates that the eruption will have a warming effect of 0.12 Watts/m² over the next few years.

5. There are further things that contribute to the temperature rise, such as reductions of Sahara dust and of sulfur aerosols co-emitted with fossil fuel combustion that previously masked the temperature rise. 

The above points apply to the global temperature rise. The North Atlantic sea surface temperature is rising even stronger than the global rise, due to the following points:
  • The narrowing temperature difference between the Arctic and the Tropics is slowing down the flow of air from the Tropics to the Arctic, deforming the Jet Stream, and that can strongly prolong and amplify extreme weather events in the Northern Hemisphere, and result in stronger heating up of the North Atlantic.
  • This is also slowing down AMOC, causing more hot water to accumulate in the North Atlantic and to reach the Arctic Ocean, resulting in strong melting of sea ice from below and thus strong thinning.
  • Additionally, as temperatures rise, increased stratification further speeds up the sea surface temperature rise.
  • As the North Atlantic Ocean heats up and as cold air from the Arctic can more deeply descend over North America (due to Jet Stream deformation), the temperature difference between land and oceans widens, especially during the Northern Winter, and this can result in storms abruptly pushing strong wind along the path of the Gulf Stream, pushing ocean heat into the Arctic Ocean, with stronger evaporation occurring over the North Atlantic and with stronger precipitation (rain, snow, etc.) occurring further down the path of the Gulf Stream. This stronger evaporation cools the surface of the North Atlantic.
  • This cooling, together with cooling from increased meltwater, also results in formation of a cold freshwater lid on top of the North Atlantic, also because freshwater is less dense than saltwater.
  • This lid on top of the North Atlantic enables more hot water to flow underneath this lid into the Arctic Ocean, with the danger that more heat will reach sediments at the seafloor of the Arctic Ocean and destabilize hydrates, resulting in eruption of huge amounts of methane.
  • This sea surface cooling has until now covered up the full extent of the rise in ocean heat in the North Atlantic, but - as illustrated by the image below - the continued rise in ocean heat now is overwhelming this cooling.
The image below shows that the North Atlantic sea surface temperature was 23.3°C on June 21, 2023 (on the black line), 0.9°C higher than the 22.4°C on June 21, 2022 (on the orange line). A record high of 24.9°C was reached on September 4, 2022, even while La Niña at the time was suppressing the temperature, whereas there now is an El Niño, so the outlook is grim.

[ from earlier post ]
Feedbacks and developments that make the outlook even more threatening

Globally, methane rose to 1924.99 ppb in December 2022. The image below has a polynomial trend added that is based on April 2018 to December 2022 NOAA global methane data and is pointing at 1200 ppm CO₂e (carbon dioxide equivalent) getting crossed in 2027. The Clouds Tipping Point, at 1200 ppm CO₂e, could be crossed and this on its own could result in a further rise of 8°C. This tipping point could be crossed as early as in 2027 due to forcing caused by the rise in methane alone. When further forcing is taken into account, this could happen even earlier than in 2027.
[ from earlier post ]
[ click on images to enlarge ]
On February 22, 2023, Antarctic sea ice area was only 1,050,708 km² in size, as discussed in an earlier post. Since that time, Antarctic sea ice has been growing at a much slower pace than in previous years. On July 4, 2023, Antarctic sea ice area was 9,385,739 km² in size, and sea ice has actually been falling in size recently, as illustrated by the Nico Sun image on the right. Less sea ice means that sunlight previously reflected back into space by the sea ice is now instead getting absorbed by the Southern Ocean, in a self-reinforcing feedback loop that results in further sea ice loss, in turn further speeding up the temperature rise and making the weather ever more extreme.

[ Two out of numerous feedbacks ]
This dire situation spells bad news regarding the temperature rise to come, the more so since, on top of these dire conditions, there are feedbacks and further developments that make the outlook even more threatening. 

A huge temperature rise could be triggered abruptly, due to a multitude of feedbacks and further developments that could strongly deteriorate the situation even further, such as by causing more water vapor to get added to the atmosphere, as discussed at Moistening Atmosphere and Extreme Heat Stress.

[ see the Extinction page ]
Changes in aerosols are discussed in earlier posts such as this post and this post. The upcoming temperature rise on land on the Northern Hemisphere could be so strong that much traffic, transport and industrial activity will grind to a halt, resulting in a reduction in cooling aerosols that are now masking the full wrath of global heating. These are mainly sulfates, but burning of fossil fuel and biomass also emits iron that currently helps photosynthesis of phytoplankton in oceans, as a 2022 study points out, and less iron means less drawdown of carbon dioxide. 

Without these emissions, the temperature is projected to rise strongly, while there could be an additional temperature rise due to an increase in warming aerosols and gases as a result of more biomass and waste burning and forest fires.

The image on the right, from the extinction page, includes a potential rise of 1.9°C by 2026 as the sulfate cooling effect falls away and an additional rise of 0.6°C due to an increase in warming aerosols by 2026, as discussed in this post and earlier posts.

The image on the right indicates that the rise from pre-industrial to 2020 could be as much as 2.29°C. Earth's energy imbalance has grown since 2020, so the rise up to now may be even higher. 

Climate Tipping Points and further Events and Developments

The temperature could also be pushed up further due to reductions in the carbon sink on land. An earlier post mentions a study that found that the Amazon rainforest is no longer a sink, but has become a source, contributing to warming the planet instead; another study found that soil bacteria release CO₂ that was previously thought to remain trapped by iron; another study found that forest soil carbon does not increase with higher CO₂ levels; another study found that forests' long-term capacity to store carbon is dropping in regions with extreme annual fires; another earlier post discussed the Terrestrial Biosphere Temperature Tipping Point, coined in a study finding that at higher temperatures, respiration rates continue to rise in contrast to sharply declining rates of photosynthesis, which under business-as-usual emissions would nearly halve the land sink strength by as early as 2040.

This earlier post also discusses how CO₂ and heat taken up by oceans can be reduced. A 2021 study on oceans finds that, with increased stratification, heat from climate warming less effectively penetrates into the deep ocean, which contributes to further surface warming, while it also reduces the capability of the ocean to store carbon, exacerbating global surface warming. A 2022 study finds that ocean uptake of CO₂ from the atmosphere decreases as the Meridional Overturning Circulation slows down. An earlier analysis warns about growth of a layer of fresh water at the surface of the North Atlantic resulting in more ocean heat reaching the Arctic Ocean and the atmosphere over the Arctic, while a 2023 study finds that growth of a layer of fresh water decreases its alkalinity and thus its ability to take up CO₂, a feedback referred to as the Ocean Surface Tipping Point.

[ from Blue Ocean Event 2022? - click on images to enlarge ]
The above image depicts only one sequence of events, or one scenario out of many. Things may eventuate in different orders and occur simultaneously, i.e. instead of one domino tipping over the next one sequentially, many events may occur simultaneously and reinforce each other. Further events and developments could be added to the list, such as ocean stratification and stronger storms that can push large amounts of warm salty water into the Arctic Ocean.

While loss of Arctic sea ice and loss of Permafrost in Siberia and North America are often regarded as tipping points, Antarctic sea ice loss, and loss of the snow and ice cover on Greenland, on Antarctica and on mountaintops such as the Tibetan Plateau could also be seen as tipping points. Another five tipping points are: 

Extinction

Altogether, the rise from pre-industrial to 2026 could be more than 18.44°C, while humans are likely to go extinct with a rise of 3°C, as illustrated by the image below, from an analysis discussed in an earlier post.


This should act as a warning that near-term human extinction could occur soon. In the video below, Guy McPherson discusses how fast humans could go extinct. 


Conclusion

The dire situation is getting more dire every day, calling for a Climate Emergency Declaration and implementation of comprehensive and effective action, as described in the Climate Plan with an update at Transforming Society.


Links

• Climate Reanalyzer - World Daily 2-meter Air Temperature (90-90°N, 0-360°E)
https://climatereanalyzer.org/clim/t2_daily

• Climate Reanalyzer - CMIP5 RCP8.5 projection
https://climatereanalyzer.org/reanalysis/monthly_tseries

• NOAA - Solar cycle sunspot number progression
https://www.swpc.noaa.gov/products/solar-cycle-progression

• A Strong 2023/24 El Niño is Staged by Tropical Pacific Ocean Heat Content Buildup - by Tao Lian et al. (2023)
https://spj.science.org/doi/10.34133/olar.0011

• NSIDC - National Snow and Ice Data Center
https://www.nsidc.org

• NSIDC - Chartic interactive sea ice graph
https://nsidc.org/arcticseaicenews/charctic-interactive-sea-ice-graph

• Cryosphere Computing - by Nico Sun
https://cryospherecomputing.com

• Nullschool
https://earth.nullschool.net

• Climate Reanalyzer - sea ice based on NSIDC index V3
https://climatereanalyzer.org/clim/seaice

• NOAA - greenhouse gases - trends CH4 (methane)
• NOAA - Solar cycle progression

• NASA gistemp Monthly Mean Global Surface Temperature - Land Only

• NOAA - Annual Northern Hemisphere Land Temperature Anomalies 

• Tonga eruption increases chance of temporary surface temperature anomaly above 1.5 °C - by Stuart Jenkins et al. (2023)
https://www.nature.com/articles/s41558-022-01568-2


• Moistening Atmosphere
• Albedo, latent heat, insolation and more

• Latent Heat

• Blue Ocean Event

• Methane keeps rising

• A huge temperature rise threatens to unfold soon

• The Clouds Feedback and the Clouds Tipping Point
https://arctic-news.blogspot.com/p/clouds-feedback.html

• Human Extinction by 2025?

• 2020: Hottest Year On Record

• The Importance of Methane in Climate Change

• The underappreciated role of anthropogenic sources in atmospheric soluble iron flux to the Southern Ocean - by Mingxu Liu et al. (2022)
https://www.nature.com/articles/s41612-022-00250-w

• How close are we to the temperature tipping point of the terrestrial biosphere? - by Katharyn Duffy et al. (2021)

• Overshoot or Omnicide? 

• Upper Ocean Temperatures Hit Record High in 2020 - by Lijing Cheng et al. (2021)

• Reduced CO₂ uptake and growing nutrient sequestration from slowing overturning circulation - by Yi Liu et al. (2022)
https://www.nature.com/articles/s41558-022-01555-7

• Cold freshwater lid on North Atlantic
• Long-Term Slowdown of Ocean Carbon Uptake by Alkalinity Dynamics - by Megumi Chikamoto et al. (2023) 
• Ocean Surface Tipping Point Could Accelerate Climate Change

• When Will We Die?

• Edge of Extinction: Extinct - HOW FAST? - video by Guy McPherson

• Edge of Extinction: Destination Destruction - video by Guy McPherson


• Transforming Society
https://arctic-news.blogspot.com/2022/10/transforming-society.html

• Climate Emergency Declaration
https://arctic-news.blogspot.com/p/climate-emergency-declaration.html


Friday, June 30, 2023

Arctic sea ice under threat - update 5

The NASA Worldview satellite image below shows Arctic sea ice on June 29, 2023, with the North Pole on the left. 


The animation below shows that, while clouds can obscure a closer look, sea ice is clearly very thin with the thickest ice breaking up near the top of Greenland, some 750 km from the North Pole. 


The Uni of Bremen image below shows Arctic sea ice thickness on June 28, 2023.


The danger is that, as El Niño strengthens, there will be massive loss of Arctic sea ice over the coming months, with water in the Arctic Ocean heating up strongly due to loss of the latent heat buffer and loss of albedo, while huge amounts of ocean heat keep entering the Arctic Ocean from the Atlantic Ocean and the Pacific Ocean.

The image below shows that the North Atlantic sea surface temperature was 23.5°C on June 28, 2023 (on the black line), 0.9°C higher than the 22.6°C on June 28, 2022 (on the orange line). A record high of 24.9°C was reached on Sept. 4, 2022, even while La Niña was suppressing the temperature. This time, there's an El Niño. 


The image below, adapted from NOAA, shows ocean heat moving toward the Arctic along the path of the Gulf Stream on June 25, 2023, while sea surface temperatures on the map are as high as 32.6°C.


In addition, the Jet Stream is strongly deformed, and this threatens to strengthen heatwaves extending over the Arctic Ocean and causing hot water from rivers to enter the Arctic Ocean, and to strengthen storms accelerating the flow of ocean heat into the Arctic Ocean, while fires and storms contribute to darkening of the sea ice, further speeding up its demise.

The danger is that, as El Niño strengthens and as ocean heat keeps entering the Arctic Ocean from the Atlantic Ocean and the Pacific Ocean, a huge amount of heat will abruptly be pushed into the Arctic Ocean.

This danger is illustrated by the image on the right, from an earlier post, showing the Jet Stream pushing wind at a speed of 126 km/h (78 mph) up through Fram Strait (at the green circle) into the Arctic Ocean on June 21, 2023.

This situation threatens to cause massive loss of Arctic sea ice over the coming months, with water in the Arctic Ocean heating up strongly due to loss of the latent heat buffer and loss of albedo.

This in turn threatens to trigger methane eruptions from the seafloor of the Arctic Ocean, a threat that has been described many times before, such as here, here and here.

[ Latent heat loss, feedback #14 on the Feedbacks page ]
[ see the Extinction page ]
Loss of Arctic sea ice albedo, loss of the latent heat buffer and eruption of seafloor methane all constitute tipping points that threaten to abruptly accelerate the temperature rise in the Arctic, further speeding up loss of permafrost in Siberia and North America and thus threatening to trigger further releases of greenhouse gases.

In addition, there are further events and developments that could unfold and make things even worse.

The upcoming temperature rise on land on the Northern Hemisphere could be of such a severity that much traffic, transport and industrial activity will grind to a halt, resulting in a reduction in cooling aerosols that are now masking the full wrath of global heating. Without these cooling aerosols, the temperature is projected to rise strongly, while there could be an additional temperature rise due to an increase in warming aerosols and gases as a result of more biomass and waste burning and forest fires. Furthermore, as traffic slows down, there will be less nitrogen oxide emissions, which could result in less hydroxyl to curtail methane.

The bar on the right depicts the threat, as discussed at the Extinction page.

In conclusion, the situation is dire and calls for support for a Climate Emergency Declaration.


Links

• Arctic sea ice under threat

• Arctic sea ice under threat - update 1

• Arctic sea ice under threat - update 2

• Arctic sea ice under threat - update 3
https://arctic-news.blogspot.com/2023/06/arctic-sea-ice-under-threat-update-3.html

• Arctic sea ice under threat - update 4
https://arctic-news.blogspot.com/2023/06/arctic-sea-ice-under-threat-update-4.html

• Climate Reanalyzer - Daily sea surface temperatures
https://climatereanalyzer.org/clim/sst_daily

• NOAA - The National Centers for Environment Prediction Climate Forecast System Version 2  

• NOAA - Climate Prediction Center - ENSO Diagnostic Discussions
https://www.cpc.ncep.noaa.gov/products/analysis_monitoring/enso_advisory/ensodisc.shtml

• NOAA - sea surface temperature
https://www.ospo.noaa.gov/Products/ocean/sst/contour/index.html

• University of Bremen - sea ice concentration and thickness
https://seaice.uni-bremen.de/start

• NASA Worldview
https://worldview.earthdata.nasa.gov