Greenhouse gas levels are high (and rising)
The image below shows globally averaged marine surface monthly mean carbon dioxide (CO₂) with a trend added based on NOAA January 1979 to April 2023 data, illustrating how CO₂ in 2043 could reach 575 parts per million (ppm).

The IPCC does contemplate CO₂ scenarios higher than 1200 ppm, as illustrated by the image right, but as discussed in an earlier post, the IPCC does not mention the Clouds Tipping Point, which is at 1200 ppm CO₂e. If this tipping point gets crossed, this could on its own result in a further temperature rise of 8°C.

While there is plenty of scientific interest in the potential for high CO₂e scenarios, politicians typically ignore or wave away such scenarios as too distant in the future to worry about, as discussed in earlier posts auch as this one. Generally, what's lacking is political will to deal deal with the potential for abrupt catastrophic climate change.
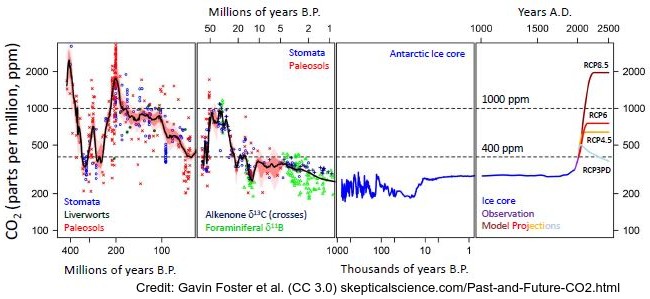
There's no doubt that CO₂ levels as high as 575 ppm did occur in the past, but to find levels that high, one has to go back in time millions of years, to the Miocene, as illustrated by the image below.

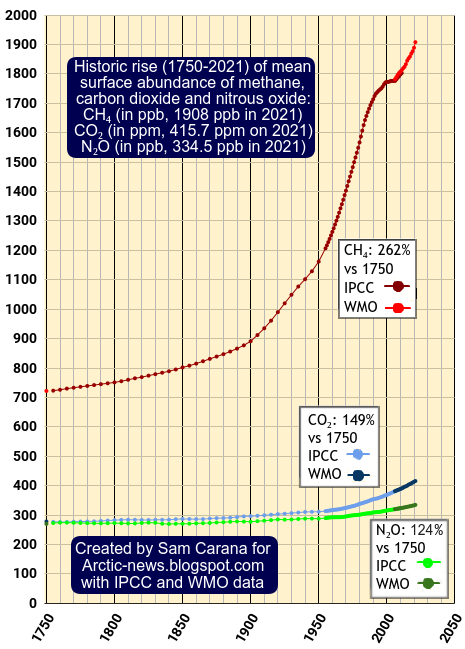 |
| [ IPCC/WMO data through 2021 ] |

The Clouds Tipping Point, at 1200 ppm CO₂e, could be crossed and this on its own could result in a further rise of 8°C. As the above image illustrates, this tipping point could be crossed as early as in 2027 due to forcing caused by the rise in methane alone. When forcing by further greenhouse gases is taken into account, this could happen even earlier than in 2027.
As the image at the top shows, CO₂ could reach 430 ppm in 2026. The above image shows that methane could cross 800 CO₂e in the course of 2026. Together, CO₂ and methane could thus cause the Clouds Tipping Point to be crossed in 2026, and that is without even including further greenhouse gases, such as N₂O and water vapor, and without including further events and developments, as discussed below.
As discussed above, to find CO₂ levels as high as the current levels, one needs to go back millions of years.

The above image, from an earlier post, shows July 18, 2023, as the most recent day of a sequence of 16 days. Each day, the temperature was higher than at the peak reached in previous years going back to 1979. The peak in previous years was 16.92°C (62.46°F), reached on July 24, 2022 (orange), as well as on August 13+14, 2016. As the image adds, temperatures during each of these 16 days have been higher than they have been for millions of years, as discussed below.

 |
| [ from earlier post ] |
El Niño
In each of the past 16 days, the temperature has been higher than the peak temperature reached in previous years in the record going back to 1979, i.e. 16.92°C (62.46°F) reached on July 24, 2022 (orange), as well as on August 13+14, 2016.
The comparison with the year 2016 is important, as 2016 was a strong El Niño year and the peak temperature in that year was reached in August. Therefore, if indicative, temperatures in 2023 may reach even higher peaks later this month and in August, which seems confirmed by predictions of the currently unfolding El Niño, such as the above image from Copernicus, showing El Niño gaining in strength.July 3, 2023: 17.01°C or 62.62°F
July 4, 2023: 17.18°C or 62.92°F
July 5, 2023: 17.18°C or 62.92°F
July 6, 2023: 17.23°C or 63.01°F
July 7, 2023: 17.20°C or 62.96°F
July 8, 2023: 17.17°C or 62.91°F
July 9, 2023: 17.11°C or 62.80°F
July 10, 2023: 17.12°C or 62.82°F
July 11, 2023: 17.08°C or 62.74°F
July 12, 2023: 17.04°C or 62.67°F
July 13, 2023: 16.98°C or 62.56°F
July 14, 2023: 16.94°C or 62.49°F
July 15, 2023: 16.99°C or 62.58°F
July 16, 2023: 17.03°C or 62.65°F
July 17, 2023: 17.11°C or 62.80°F
July 18, 2023: 17.17°C or 62.91°F

Moving from the bottom of a La Niña to the peak of a strong El Niño could make a difference of more than half a degree Celsius, as illustrated by the image below, adapted from NOAA.
 |
| [ click on images to enlarge ] |
Temperature anomalies can be very high during an El Niño. The February 2016 temperature on land-only was 2.96°C above 1880-1920, and in February 2020, it was 2.79°C higher, as illustrated by the image below, created with screenshots taken on February 15, 2023. Note that 1880-1920 isn't pre-industrial.
Why the temperature is rising rapidly
The image below mentions a number of contributors, with charts added from an earlier post.
1. Emissions are high and greenhouse gas levels keep rising, as discussed above, and this is increasing Earth's Energy Imbalance.
2. As also discussed above, temperatures are high (and rising). We did come out of a La Niña that has for years been suppressing temperatures and we are now in an El Niño. A 2023 study led by Tao Lian predicts the current El Niño to be strong. Moving from the bottom of a La Niña to the peak of a strong El Niño could make a difference of more than half a degree Celsius, as discussed in an earlier post. Temperature anomalies can be very high during an El Niño. The image below shows that February 2016 on land was 3.28°C (5.904°F) hotter than 1880-1896, and 3.68°C (6.624°F) hotter compared to February 1880 on land. Note that 1880-1896 is not pre-industrial, the rise will be even larger when using a genuinely pre-industrial base.
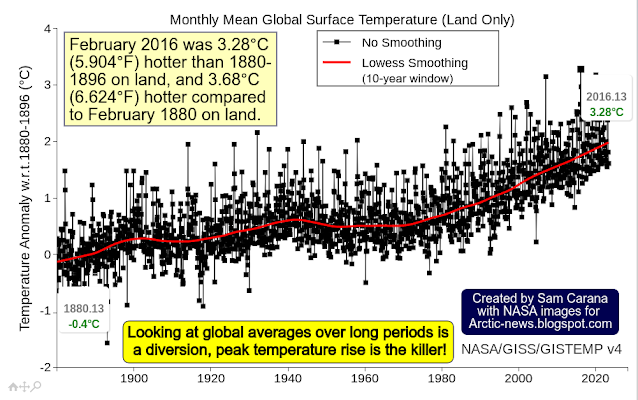 The above image, from an earlier post discussing extreme heat stress, adds a poignant punchline: Looking at global averages over long periods is a diversion, peak temperature rise is the killer!
3. The June 2023 number of sunspots is more than twice as high as predicted, as illustrated by the image on the right, from an earlier post and adapted from NOAA. If this trend continues, the rise in sunspots forcing from May 2020 to July 2025 may well make a difference of more than 0.25°C, a recent analysis found.
4. The January 2022 submarine volcano eruption near Tonga did add a huge amount of water vapor to the atmosphere, as discussed in an earlier post and also at facebook. Since water vapor is a potent greenhouse gas, this further contributes to speeding up the temperature rise. A 2023 study calculates that the eruption will have a warming effect of 0.12 Watts/m² over the next few years.
Hot water from rivers ending in the Arctic Ocean is one way the water heats up. The water of the Arctic Ocean also receives direct heat from sunlight. On July 9, 2023, a temperature of 33°C or 91.3°F was recorded in Canada near the Arctic Ocean and near the mouth of Mackenzie River, with the heatwave on land extending over the Arctic Ocean, as discussed in an earlier post.
Additionally, heat is entering the Arctic Ocean from the North Atlantic Ocean and the Pacific Ocean, melting the sea ice from below. The image below, created with Climate Reanalyzer images, shows that the North Atlantic sea surface temperature was 24.2°C on July 11, 2023 (black), no less than 1.1°C above the 23.1°C recorded on July 11, 2022 (orange).

 As the above image also shows, a record high temperature was reached on the North Atlantic of 24.9°C on September 4, 2022.
The comparison with the peak in 2022 is important, as it was reached at a time when La Niña was suppressing the temperature, whereas now El Niño is strongly pushing up the temperature. Therefore, if the 1.1°C difference is indicative, temperatures as high as 26°C can be expected for the North Atlantic in September 2023.
This spells bad news for Arctic sea ice. The image on the right shows sea surface temperatures as high as 33.6°C or 92.4°F off the Florida coast (green circle) on July 13, 2023.
The Gulf Stream is pushing ocean heat toward the Arctic Ocean. It takes some time for peak ocean heat to reach the Arctic Ocean. Arctic sea ice typically reaches an annual minimum extent about mid-September.

 The danger is that, as El Niño strengthens and as ocean heat keeps entering the Arctic Ocean from the Atlantic Ocean and the Pacific Ocean, a huge amount of heat will abruptly be pushed into the Arctic Ocean.
This danger is illustrated by the image on the right, from an earlier post, showing the Jet Stream pushing wind at a speed of 126 km/h (78 mph) up through Fram Strait (at the green circle) into the Arctic Ocean on June 21, 2023.
This situation threatens to cause massive loss of Arctic sea ice over the coming months, with water in the Arctic Ocean heating up strongly due to loss of the latent heat buffer and loss of albedo.
This in turn threatens to trigger methane eruptions from the seafloor of the Arctic Ocean, a threat that has been described many times before, such as here, here and here.
Climate Tipping Points and further Events and Developments
Why the temperature is rising rapidly
The image below mentions a number of contributors, with charts added from an earlier post.
 |
| [ click on images to enlarge ] |
2. As also discussed above, temperatures are high (and rising). We did come out of a La Niña that has for years been suppressing temperatures and we are now in an El Niño. A 2023 study led by Tao Lian predicts the current El Niño to be strong. Moving from the bottom of a La Niña to the peak of a strong El Niño could make a difference of more than half a degree Celsius, as discussed in an earlier post. Temperature anomalies can be very high during an El Niño. The image below shows that February 2016 on land was 3.28°C (5.904°F) hotter than 1880-1896, and 3.68°C (6.624°F) hotter compared to February 1880 on land. Note that 1880-1896 is not pre-industrial, the rise will be even larger when using a genuinely pre-industrial base.

 |
| [ click on images to enlarge ] |
4. The January 2022 submarine volcano eruption near Tonga did add a huge amount of water vapor to the atmosphere, as discussed in an earlier post and also at facebook. Since water vapor is a potent greenhouse gas, this further contributes to speeding up the temperature rise. A 2023 study calculates that the eruption will have a warming effect of 0.12 Watts/m² over the next few years.
5. There are further things that contribute to the temperature rise, such as reductions of Sahara dust and of sulfur aerosols co-emitted with fossil fuel combustion that previously masked the temperature rise.
The above points apply to the global temperature rise. The North Atlantic sea surface temperature is rising even stronger than the global rise, due to the following points:
Loss of Arctic sea ice
- The narrowing temperature difference between the Arctic and the Tropics is slowing down the flow of air from the Tropics to the Arctic, deforming the Jet Stream, and that can strongly prolong and amplify extreme weather events in the Northern Hemisphere, and result in stronger heating up of the North Atlantic.
- This is also slowing down AMOC, causing more hot water to accumulate in the North Atlantic and to reach the Arctic Ocean, resulting in strong melting of sea ice from below and thus strong thinning.
- Additionally, as temperatures rise, increased stratification further speeds up the sea surface temperature rise.
- As the North Atlantic Ocean heats up and as cold air from the Arctic can more deeply descend over North America (due to Jet Stream deformation), the temperature difference between land and oceans widens, especially during the Northern Winter, and this can result in storms abruptly pushing strong wind along the path of the Gulf Stream, pushing ocean heat into the Arctic Ocean, with stronger evaporation occurring over the North Atlantic and with stronger precipitation (rain, snow, etc.) occurring further down the path of the Gulf Stream. This stronger evaporation cools the surface of the North Atlantic.
- This cooling, together with cooling from increased meltwater, also results in formation of a cold freshwater lid on top of the North Atlantic, also because freshwater is less dense than saltwater.
- This lid on top of the North Atlantic enables more hot water to flow underneath this lid into the Arctic Ocean, with the danger that more heat will reach sediments at the seafloor of the Arctic Ocean and destabilize hydrates, resulting in eruption of huge amounts of methane.
- This sea surface cooling has until now covered up the full extent of the rise in ocean heat in the North Atlantic, but - as illustrated by the image below - the continued rise in ocean heat now is overwhelming this cooling.
Loss of Arctic sea ice
Hot water from rivers ending in the Arctic Ocean is one way the water heats up. The water of the Arctic Ocean also receives direct heat from sunlight. On July 9, 2023, a temperature of 33°C or 91.3°F was recorded in Canada near the Arctic Ocean and near the mouth of Mackenzie River, with the heatwave on land extending over the Arctic Ocean, as discussed in an earlier post.
Additionally, heat is entering the Arctic Ocean from the North Atlantic Ocean and the Pacific Ocean, melting the sea ice from below. The image below, created with Climate Reanalyzer images, shows that the North Atlantic sea surface temperature was 24.2°C on July 11, 2023 (black), no less than 1.1°C above the 23.1°C recorded on July 11, 2022 (orange).


The comparison with the peak in 2022 is important, as it was reached at a time when La Niña was suppressing the temperature, whereas now El Niño is strongly pushing up the temperature. Therefore, if the 1.1°C difference is indicative, temperatures as high as 26°C can be expected for the North Atlantic in September 2023.
This spells bad news for Arctic sea ice. The image on the right shows sea surface temperatures as high as 33.6°C or 92.4°F off the Florida coast (green circle) on July 13, 2023.
The Gulf Stream is pushing ocean heat toward the Arctic Ocean. It takes some time for peak ocean heat to reach the Arctic Ocean. Arctic sea ice typically reaches an annual minimum extent about mid-September.

Deformation of Jet Stream
In addition, the Jet Stream is strongly deformed, and this threatens to strengthen heatwaves extending over the Arctic Ocean and causing hot water from rivers to enter the Arctic Ocean, and to strengthen storms accelerating the flow of ocean heat into the Arctic Ocean, while fires and storms contribute to darkening of the sea ice, further speeding up its demise.
In addition, the Jet Stream is strongly deformed, and this threatens to strengthen heatwaves extending over the Arctic Ocean and causing hot water from rivers to enter the Arctic Ocean, and to strengthen storms accelerating the flow of ocean heat into the Arctic Ocean, while fires and storms contribute to darkening of the sea ice, further speeding up its demise.

This danger is illustrated by the image on the right, from an earlier post, showing the Jet Stream pushing wind at a speed of 126 km/h (78 mph) up through Fram Strait (at the green circle) into the Arctic Ocean on June 21, 2023.
This situation threatens to cause massive loss of Arctic sea ice over the coming months, with water in the Arctic Ocean heating up strongly due to loss of the latent heat buffer and loss of albedo.
This in turn threatens to trigger methane eruptions from the seafloor of the Arctic Ocean, a threat that has been described many times before, such as here, here and here.
 |
| [ Latent heat loss, feedback #14 on the Feedbacks page ] |
The temperature could also be pushed up further due to reductions in the carbon sink on land. An earlier post mentions a study that found that the Amazon rainforest is no longer a sink, but has become a source, contributing to warming the planet instead; another study found that soil bacteria release CO₂ that was previously thought to remain trapped by iron; another study found that forest soil carbon does not increase with higher CO₂ levels; another study found that forests' long-term capacity to store carbon is dropping in regions with extreme annual fires; another earlier post discussed the Terrestrial Biosphere Temperature Tipping Point, coined in a study finding that at higher temperatures, respiration rates continue to rise in contrast to sharply declining rates of photosynthesis, which under business-as-usual emissions would nearly halve the land sink strength by as early as 2040.
This earlier post also discusses how CO₂ and heat taken up by oceans can be reduced. A 2021 study on oceans finds that, with increased stratification, heat from climate warming less effectively penetrates into the deep ocean, which contributes to further surface warming, while it also reduces the capability of the ocean to store carbon, exacerbating global surface warming. A 2022 study finds that ocean uptake of CO₂ from the atmosphere decreases as the Meridional Overturning Circulation slows down. An earlier analysis warns about growth of a layer of fresh water at the surface of the North Atlantic resulting in more ocean heat reaching the Arctic Ocean and the atmosphere over the Arctic, while a 2023 study finds that growth of a layer of fresh water decreases its alkalinity and thus its ability to take up CO₂, a feedback referred to as the Ocean Surface Tipping Point.
The above image depicts only one sequence of events, or one scenario out of many. Things may eventuate in different orders and occur simultaneously, i.e. instead of one domino tipping over the next one sequentially, many events may occur simultaneously and reinforce each other. Further events and developments could be added to the list, such as ocean stratification and stronger storms that can push large amounts of warm salty water into the Arctic Ocean.
While loss of Arctic sea ice and loss of Permafrost in Siberia and North America are often regarded as tipping points, Antarctic sea ice loss, and loss of the snow and ice cover on Greenland, on Antarctica and on mountaintops such as the Tibetan Plateau could also be seen as tipping points. Another five tipping points are:
- The Latent Heat Tipping Point
- The Seafloor Methane Tipping Point
- The Clouds Tipping Point
- The Terrestrial Biosphere Temperature Tipping Point
- The Ocean Surface Tipping Point
Cooling aerosols are co-emitted when fuel is burned and they mask part of the temperature rise. As the world progresses with the necessary transition to clean, renewable energy, this masking effect is decreasing. The upcoming temperature rise on land on the Northern Hemisphere could be of such a severity that much traffic, transport and industrial activity will grind to a halt, resulting in an abrupt reduction in cooling aerosols that are now masking the full wrath of global heating.
Falling away of this aerosol masking effect could cause a potential rise of 1.9°C by 2026, while there could be an additional potential rise of 0.6°C by 2026 due to an increase in warming aerosols and gases as a result of more biomass and waste burning and forest fires.
Furthermore, as traffic slows down, there will be less nitrogen oxide emissions, which could result in less hydroxyl to curtail methane.
The bar on the right depicts the threat, as discussed at the Extinction page.
Extinction
Altogether, the rise from pre-industrial to 2026 could be more than 18.44°C, while humans are likely to go extinct with a rise of 3°C, as illustrated by the image below, from an analysis discussed in an earlier post.

In conclusion, the situation is dire and calls for support for a Climate Emergency Declaration.
This earlier post also discusses how CO₂ and heat taken up by oceans can be reduced. A 2021 study on oceans finds that, with increased stratification, heat from climate warming less effectively penetrates into the deep ocean, which contributes to further surface warming, while it also reduces the capability of the ocean to store carbon, exacerbating global surface warming. A 2022 study finds that ocean uptake of CO₂ from the atmosphere decreases as the Meridional Overturning Circulation slows down. An earlier analysis warns about growth of a layer of fresh water at the surface of the North Atlantic resulting in more ocean heat reaching the Arctic Ocean and the atmosphere over the Arctic, while a 2023 study finds that growth of a layer of fresh water decreases its alkalinity and thus its ability to take up CO₂, a feedback referred to as the Ocean Surface Tipping Point.
 |
| [ from Blue Ocean Event 2022? - click on images to enlarge ] |
While loss of Arctic sea ice and loss of Permafrost in Siberia and North America are often regarded as tipping points, Antarctic sea ice loss, and loss of the snow and ice cover on Greenland, on Antarctica and on mountaintops such as the Tibetan Plateau could also be seen as tipping points. Another five tipping points are:
- The Latent Heat Tipping Point
- The Seafloor Methane Tipping Point
- The Clouds Tipping Point
- The Terrestrial Biosphere Temperature Tipping Point
- The Ocean Surface Tipping Point
 |
| [ see the Extinction page ] |
Falling away of this aerosol masking effect could cause a potential rise of 1.9°C by 2026, while there could be an additional potential rise of 0.6°C by 2026 due to an increase in warming aerosols and gases as a result of more biomass and waste burning and forest fires.
The bar on the right depicts the threat, as discussed at the Extinction page.