Showing posts with label tipping point. Show all posts

Wednesday, August 10, 2022

Arctic sea ice August 2022

Ocean currents keep pushing heat toward the Arctic Ocean

Arctic sea ice is getting very thin, as temperatures keep rising and ocean currents keep pushing heat toward the Arctic, as illustrated by the NOAA image below that shows sea surface temperatures as high as 33°C or 91.4°F on August 13, 2022. 


The Gulf Stream is an ocean current that extends into the Arctic Ocean, as pictured below and discussed at this page. This ocean current is driven by the Coriolis force and by prevailing wind patterns. 

[ from earlier post ]
This ocean current contributes to the stronger and accelerating warming of the Arctic (compared to the rest of the world), which in turn causes deformation of the Jet Stream that can at times cause strong winds to speed up this ocean current. The image below shows the Jet Stream over the North Atlantic, where the ocean current dives under the sea ice. Sea surface temperature anomalies are much lower over the area where the deformed Jet Stream causes water to evaporate, thus cooling the surface. 


The danger is that a cold freshwater lid grows at the surface of the North Atlantic that enables large amounts of salty, warm water to dive under the sea ice and enter the Arctic Ocean, as discussed earlier here, as well as here and at the feedbacks page


Latent heat

Latent heat is ocean heat that is, or rather was previously consumed by melting of the sea ice underneath the sea surface. 

[ The Latent Heat Buffer ]
This ice has meanwhile all but disappeared, so without this latent heat buffer further incoming heat must go elsewhere, i.e. the heat will further raise the temperature of the water and it will also cause more evaporation to take place where the sea ice has disappeared altogether, and this in turn will further heat up the atmosphere over the Arctic. 

The nullschool.net image below shows sea surface temperature anomalies from 1981-2011. At the green circle, anomalies were 16.1°C or 29°F on August 9, 2022. Back in 1981-2011, the temperature at that spot was 0°C. 


Thin layer of sea ice

The image below, adapted from University of Bremen, shows Arctic sea ice concentration on August 12, 2022, with concentration in a large area close to the North Pole as low as 0%.


The image below, from NSIDC, also shows sea ice concentration on August 9, 2022. 


The Naval Research Laboratory image below, a forecast for August 18, 2022, run on August 10, 2022, shows that the sea ice is getting very thin. 

Danger of methane eruptions

The navy.mil combination image below has three panels. The left panel shows the sea ice on August 30, 2012, the center panel shows the sea ice on August 30, 2015, and the right panel shows a forecast for the sea ice for August 21, 2022. 

[ click on images to enlarge ]
[ click on images to enlarge ]
There still is a relatively extensive but very thin layer of sea ice present at the surface. This is also illustrated by the NSIDC image on the right that shows an Arctic sea ice extent of 6.438 million km² on August 11, 2022. This relatively large extent is mainly due to the suppression of air temperatures that comes with the current La Niña (see images further below). 

As long as air temperatures are low enough to keep this surface ice frozen and as long as there are no strong winds pushing the ice out of the Arctic Ocean, this thin layer of ice will act as a seal, preventing transfer of heat from the Arctic Ocean to the atmosphere. 


The larger the remaining sea ice is in extent, the less ocean heat can be transferred from the Arctic Ocean to the atmosphere, which means that more heat will remain in the Arctic Ocean.

[ The Buffer has gone, feedback #14 on the Feedbacks page ]
The danger is that ocean heat keeps arriving in the Arctic Ocean, while the latent heat buffer is gone, causing more of this heat to reach sediments at the seafloor of the Arctic Ocean that threatens to destabilize hydrates in these sediment, resulting in methane eruptions both from these hydrates and from free gas underneath these hydrates.

Record high methane levels 

Methane levels are already at record high and growth is accelerating, even without an extra burst of seafloor methane.

NOAA registered a globally averaged marine surface April 2022 mean of 1909.9 ppb, which is 18.7 ppb higher than April 2021, as illustrated by the image on the right. By comparison, the highest annual growth on the NOAA record is 18.31 ppb for 2021. 

NOAA's data are for marine surface measurements.  More methane tends to accumulate at higher altitudes, as illustrated by the image on the right.

The MetOp satellite recorded a mean global methane level of 1971 ppb at 293 mb on August 11, 2022 am. When using a 1-year GWP of 200, this translates into 394.2 ppm CO₂e.

As the image underneath also shows, the MetOp satellite also recorded a peak methane level of 3009 ppb at 469 mb on August 9, 2022 pm. 

Record high carbon dioxide levels

Carbon dioxide (CO₂) levels have been quite high over the past few months. Monthly CO₂ was 420.99 ppm both in May and in June 2022. Some hourly CO₂ measurements were well above 422 ppm in May 2022. On May 28, 2022, one hourly average at Mauna Loa was recorded of 424 ppm.

When adding this monthly CO₂ concentration of 420.99 ppm to the above 394.2 ppm CO₂e for methane, that gives a total of 815.19 ppm CO₂e. 


Clouds feedback

Copernicus recorded high concentrations of methane over the Arctic Ocean on August 16, 2022 (forecast for 03 UTC run on 00 UTC). 

The image below shows methane at surface level, where the scale goes up to 10,000 ppb. At a 1-year global warming potential of 200, this top end of the scale translates into 2000 ppm CO₂e. 

[ click on images to enlarge ]
This 2000 ppm CO₂e is well above the 1200 ppm CO₂e clouds tipping point that will trigger the disappearance of the lower clouds. The presence of lower clouds and sea ice causes a lot of sunlight to be reflected back into space, so the danger is that at locations where these clouds and sea ice cover have both disappeared, the water of the Arctic Ocean will strongly heat up at this time of year.

What makes the situation in the Arctic very dangerous is that there is very little hydroxyl in the air over the Arctic to break down methane.

Furthermore, the Arctic Ocean in many places is very shallow, especially off the coast of Siberia, as illustrated by the NOAA image on the right. Shallow waters enable hot surface water to be mixed down all the way to the seafloor. 

[ click on images to enlarge ]
This threatens to trigger destabilization of methane hydrates contained in sediments at the seafloor and result in eruption of huge amounts of methane from such hydrates as well as from free gas contained in sediments underneath the hydrates, as illustrated by the image on the right, from this page.

Abrupt eruption of an additional 5 Gt of methane from the seafloor of the Arctic Ocean would double the methane in the atmosphere.  

An amount of 5 Gt of methane is only 10% of the 50 Gt that Natalia Shakhova et al. warned about long ago, while 50 Gt is in turn only a small fraction of all the methane contained in sediments in the Arctic, as illustrated by the image on the right, from Shakhova et al. (2019). 

On its own, a 5 Gt eruption of seafloor methane could raise the global mean methane concentration by as much as 1971 ppb which, at a 1-year GWP of 200, would translate into another 394.2 ppm CO₂e and when added to the above 815.19 ppm CO₂e, adds up to a total of 1209.39 ppm CO₂e.

[ from earlier post, click on images to enlarge ]
So, that would abruptly cause the joint CO₂e of just two greenhouse gases, i.e. methane and CO₂, to cross the 1200 ppm clouds tipping point globally and trigger a further 8°C global temperature rise, due to the clouds feedback alone.

There are further forcers and feedbacks to be taken into account, which means that the clouds tipping point could be crossed globally even with a far smaller abrupt release of seafloor methane. While it would take longer for the clouds tipping points to get crossed that way, the associated temperature rise could be enough to drive humans into extinctions well before the tipping point was even reached. A rise of 3°C above pre-industrial could occur on land and drive humans into extinction by 2025.

La Niña

[ adapted from NOAA - click on images to enlarge ]
As said, sea ice extent is relatively large at the moment, because we are currently in the depths of a persistent La Niña, which is suppressing the temperature rise.

El Niños typically occur every 3 to 5 years, according to NOAA and as also illustrated by the NOAA image below, so the upcoming El Niño can be expected to occur soon.

The NOAA image below indicates that going from the bottom of a La Niña to the peak of an El Niño could make a difference of more than half a degree Celsius (0.5°C or 0.9°F).


Furthermore, the rise in sunspots from May 2020 to July 2025 could make a difference of some 0.15°C (0.27°F). The next El Niño looks set to line up with a high peak in sunspots, in a cataclysmic alignment that could push up the temperature enough to cause even more dramatic sea ice loss in the Arctic, resulting in runaway temperature rise.

Conclusion

In conclusion, there is a growing risk that methane will erupt from the seafloor of the Arctic Ocean and cause a dramatic rise in temperature. 

Even without such eruption of methane from the seafloor of the Arctic Ocean, temperatures look set to rise strongly soon, as we move into an El Niño and face a peak in sunspots. The resulting temperature rise could drive humans extinct as early as in 2025 with temperatures continuing to skyrocket in 2026, making it in many respects rather futile to speculate about what will happen beyond 2026. 

At the same time, the right thing to do now is to help avoid the worst things from happening, through comprehensive and effective action as described in the Climate Plan.


Arctic sea ice (previous months)

• Arctic sea ice June 2022 - why the situation is so dangerous

• Arctic sea ice July 2022


Further links

• NOAA - Sea Surface Temperature (SST) Contour Charts
• Jet Stream
https://arctic-news.blogspot.com/p/jet-stream.html

• Cold freshwater lid on North Atlantic
https://arctic-news.blogspot.com/p/cold-freshwater-lid-on-north-atlantic.html

• NOAA - ENSO: Recent Evolution, Current Status and Predictions
https://www.cpc.ncep.noaa.gov/products/analysis_monitoring/lanina/enso_evolution-status-fcsts-web.pdf

• NOAA - Monthly Temperature Anomalies Versus El Niño
https://www.ncei.noaa.gov/access/monitoring/monthly-report/global/202207/supplemental/page-4

• University of Bremen
https://seaice.uni-bremen.de/databrowser

• NSIDC - Arctic sea ice concentration

• NSIDC - Chartic, interactive sea ice graph

• NOAA - Trends in Atmospheric Methane

• nullschool
https://earth.nullschool.net

• Naval Research Laboratory
https://www7320.nrlssc.navy.mil/GLBhycomcice1-12/arctic.html

• Understanding the Permafrost–Hydrate System and Associated Methane Releases in the East Siberian Arctic Shelf - by Natalia Shakhova et al. (2019) 
https://www.mdpi.com/2076-3263/9/6/251

• Warning of mass extinction of species, including humans, within one decade
• Cold freshwater lid on North Atlantic

• Albedo, latent heat, insolation and more
https://arctic-news.blogspot.com/p/albedo.html

• Latent Heat Buffer
https://arctic-news.blogspot.com/p/latent-heat.html

• Feedbacks in the Arctic
https://arctic-news.blogspot.com/p/feedbacks.html

• Clouds feedback
https://arctic-news.blogspot.com/p/clouds-feedback.html

• How much time is there left to act?


Wednesday, April 27, 2022

Carbon dioxide crosses 422 ppm

Carbon dioxide (CO₂) reached an average daily concentration of 422.06 ppm on April 26, 2022, at Mauna Loa, Hawaii.


Furthermore, very high methane (CH₄) concentrations were recorded recently at Mauna Loa, Hawaii, with surface flask readings appearing to be as high as 1955 ppb.  


Clouds tipping point

A methane concentration of 1955 ppb corresponds, at a Global Warming Potential (GWP) of 200, with a carbon dioxide equivalent (CO₂e) of 391 ppm. Together with the above daily average CO₂ concentration of 422.06 ppm this adds up to a joint CO₂e of 813.06 ppm, i.e. less than 387 ppm away from the clouds tipping point (at 1200 ppm CO₂e) that on its own could raise the global temperature by 8°C.

Such a 387 ppm CO₂e could be added almost immediately by a burst of seafloor methane less than the size of the methane that is currently in the atmosphere (about 5 Gt). There is plenty of potential for such an abrupt release, given the rising ocean heat and the vast amounts of methane present in vulnerable sediments at the seafloor of the Arctic Ocean, as discussed in posts such as this one.


The 1200 ppm CO₂e clouds tipping point could also be crossed even without such an abrupt seafloor methane release. Carbon dioxide and methane levels are rising rapidly. The above image shows carbon dioxide concentration with a trend added, based on NOAA 1980-2021 mean global annual carbon dioxide data, illustrating how carbon dioxide concentration could cross 750 ppm by the end of the year 2029.

[ see also the importance of methane ]

The above image shows methane concentration with a trend added, based on NOAA 2008-2021 mean global annual methane data, illustrating how methane concentration could cross 4100 ppb by the end of the year 2029 and how methane's impact could cross 820 ppm CO₂e by the end of the year 2029.

As illustrated by the image below, 750 ppm carbon dioxide and 820 ppm CO₂e methane would together yield a joint CO₂e of 1570 ppm and thus would have already raised the global temperature by 8°C due to the clouds feedback much earlier than 2029, while the temperature rise would also have been driven up by the higher carbon dioxide and the methane concentrations. 


Furthermore, nitrous oxide is also rising and there are many further forcers, as discussed at the Extinction page. Altogether, there is the potential for a temperature rise of well over 18°C by 2026, as discussed in an earlier post.

Such high carbon dioxide concentrations could occur due to forest fires causing soils to burn (especially peat soils), which can also add vast amounts of methane to the atmosphere. 

The IPCC does contemplate high carbon dioxide scenarios (see image right), but as discussed in an earlier post, does not mention the clouds tipping point.

High carbon dioxide scenarios typically stop at the year 2100 and rarely do concentrations reach higher than 1200 ppm.

In the image on the right, from a 2020 analysis by Malte Meinshausen et al., the SSP5-8.5 scenario is extended to the year 2300 and a carbon dioxide concentration of well over 2100 ppm is reached around 2240.

In conclusion, there is plenty of scientific consideration of the potential for high concentrations of carbon dioxide and methane to eventuate, but it is typically ignored or waved away as too distant in the future to worry about. 

In other words, what's lacking is analysis of abrupt catastrophic climate change.

Climate change danger assessment

The image below expands risk assessment beyond its typical definition as the product of the severity of impact and probability, by adding a third dimension: timescale.


Water in soil and atmosphere

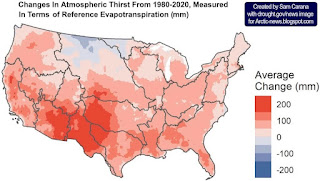
The image on the right, from a news release associated with a recent study, shows changes in atmospheric thirst, measured in terms of reference evapotranspiration from 1980-202 (in mm).

As temperatures rise due to people's emissions, more evaporation will take place over both land oceans, but not all water will return as precipitation, so more water vapor will stay in the air.

[ click on images to enlarge ]
The water-holding capacity of the atmosphere increases by about 7% for every 1°C (1.8°F) rise in temperature, in line with the Clausius–Clapeyron relation

In many cases, this means drier soils and vegetation, making vegetation more vulnerable to pests and diseases, and more prone to fire hazards. 

Water in the soil acts as a buffer, slowing down the temperature rise, so drier soil will heat up faster and further, causing land surface temperatures to rise even more and amplifying the impact of Urban heat island and Heat dome phenomena.

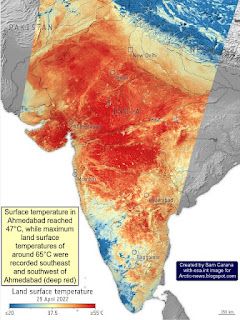
The image on the right, adapted from ESA, shows land surface temperatures as high as 65°C (149°F) in India on April 26, 2022. Note that land surface temperatures can be substantially higher than air temperatures. 

As temperatures rise, extreme weather events increase in frequency and intensity. The duration of extreme weather events can also increase, due to blocked weather patterns resulting from changes to the Jet Stream.

This contributes to shortages in food and water supplies. As long as glaciers are melting in the mountains, rivers will keep supplying some water, but the snow and ice cover is disappearing rapidly around the globe. 

The image on the right shows that food prices have risen strongly over the past few years and extreme weather events resulting from the global temperature rise have strongly contributed to the price rise. 

Further contributing to this rise is the rising demand for fertilizers that are currently all too often produced with fossil fuel, as political will to produce food in better ways remains lacking. 

Heat stress

Another issue is humidity. The more water vapor there is in the air, the harder temperature peaks are to bear.

The human body can cool itself by sweating, which has a physiological limit that is often described as a 35°C wet-bulb temperature

A 2020 study (by Raymond et al.) warned that this limit could be regularly exceeded with a temperature rise of less than 2.5°C (compared to pre-industrial).

Meanwhile, recent research found that in practice the limit will typically be lower and depending on circumstances could be as low as a wet-bulb temperature of 25°C.

In the video below, Paul Beckwith discusses the danger of combined high heat and humidity. 


In the video below, Guy McPherson also discusses the danger of combined high heat and humidity. 


Extinction

A 2018 study (by Strona & Bradshaw) indicates that most life on Earth will disappear with a 5°C rise. Humans, who depend for their survival on many other species, will likely go extinct with a 3°C rise, as illustrated by the image below, from an earlier post.


Conclusion

This further highlights the imminence of the danger and adds further urgency to the call for immediate, comprehensive and effective action, as described in the Climate Plan.


Links

• NOAA - Global Monitoring Laboratory, Recent Daily Average CO₂ at Mauna Loa, Hawaii, U.S. 
• NOAA - Global Monitoring Laboratory, Methane (surface flasks) at Mauna Loa, Hawaii, U.S. 
• The Importance of Methane
https://arctic-news.blogspot.com/p/the-importance-of-methane-in-climate.html

• Clouds feedback and tipping point
https://arctic-news.blogspot.com/p/clouds-feedback.html

• NOAA - Globally averaged marine surface annual mean carbon dioxide data
https://gml.noaa.gov/webdata/ccgg/trends/co2/co2_annmean_gl.txt

• NOAA - Globally averaged marine surface annual mean methane data
https://gml.noaa.gov/webdata/ccgg/trends/ch4/ch4_annmean_gl.txt

• NOAA - Mauna Loa CO2 weekly mean and historical comparisons
https://gml.noaa.gov/webdata/ccgg/trends/co2/co2_weekly_mlo.txt

• Methane rise is accelerating

• Runaway temperature rise by 2026?
• Extinction
https://arctic-news.blogspot.com/p/extinction.html

• Shortcomings of IPCC AR6 WGIII - Mitigation of Climate Change
https://arctic-news.blogspot.com/2022/04/shortcomings-of-ipcc-ar6-wgiii-mitigation-of-climate-change.html

• NOAA Mauna Loa CO₂ annual mean data
https://gml.noaa.gov/ccgg/trends/data.html

• NOAA globaly averaged marine surface annual mean methane data
https://gml.noaa.gov/ccgg/trends_ch4

• Is the IPCC creating false perceptions, again?
https://arctic-news.blogspot.com/2021/08/is-the-ipcc-creating-false-perceptions-again.html

• The shared socio-economic pathway (SSP) greenhouse gas concentrations and their extensions to 2500 - by Malte Meinshausen et al. 
https://gmd.copernicus.org/articles/13/3571/2020

• Clausius–Clapeyron relation

• Heat dome
https://en.wikipedia.org/wiki/Heat_dome

• ESA - Heatwave across India
https://www.esa.int/ESA_Multimedia/Images/2022/04/Heatwave_across_India

• Evaporative Demand Increase Across Lower 48 Means Less Water Supplies, Drier Vegetation, and Higher Fire Risk
https://www.drought.gov/news/evaporative-demand-increase-across-lower-48-means-less-water-supplies

• A Multidataset Assessment of Climatic Drivers and Uncertainties of Recent Trends in Evaporative Demand across the Continental United States - by Christine Albano et al.
https://journals.ametsoc.org/view/journals/hydr/23/4/JHM-D-21-0163.1.xml

• It could be unbearably hot in many places within a few years time
https://arctic-news.blogspot.com/2016/07/it-could-be-unbearably-hot-in-many-places-within-a-few-years-time.html

• The emergence of heat and humidity too severe for human tolerance - by Colin Raymond et al.
https://www.science.org/doi/10.1126/sciadv.aaw1838

• Evaluating the 35°C wet-bulb temperature adaptability threshold for young, healthy subjects (PSU HEAT Project) - by Daniel Vecellio et al.
https://pennstate.pure.elsevier.com/en/publications/evaluating-the-35c-wet-bulb-temperature-adaptability-threshold-fo

• Co-extinctions annihilate planetary life during extreme environmental change, by Giovanni Strona and Corey Bradshaw (2018)
https://www.nature.com/articles/s41598-018-35068-1

• Jet Stream
https://arctic-news.blogspot.com/p/jet-stream.html

• When Will We Die?
https://arctic-news.blogspot.com/2019/06/when-will-we-die.html

• Climate Plan
https://arctic-news.blogspot.com/p/climateplan.html


Saturday, March 12, 2022

Methane rise is accelerating


NOAA's globally averaged marine surface monthly mean methane reading for November 2021 of 1909.3 parts per billion (ppb) is 17.6 ppb higher than the reading for November 2020. By comparison, NOAA's annual global mean methane increase of 15.57 ppb for 2020 was at the time the highest on record.

Keep in mind that this 1909.3 ppb reading is for November 2021; it now is March 2022. Furthermore, NOAA's data are for marine surface measurements; more methane tends to accumulate at higher altitudes.

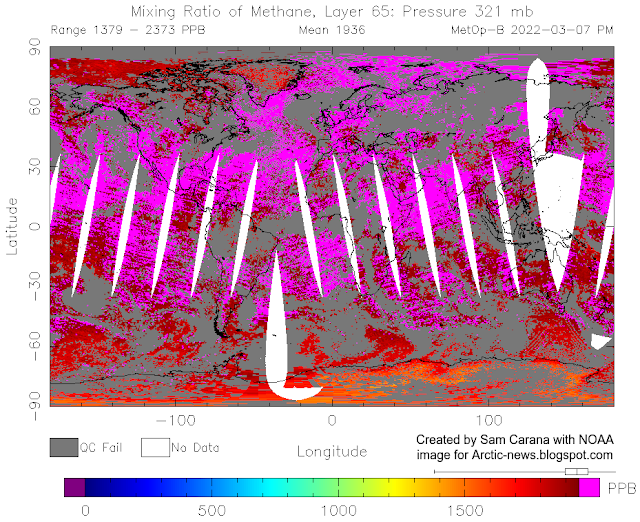
The image below shows that the MetOp-B satellite recorded a mean methane level of 1936 ppb at 321 mb on March 7, 2022 pm.


Carbon dioxide

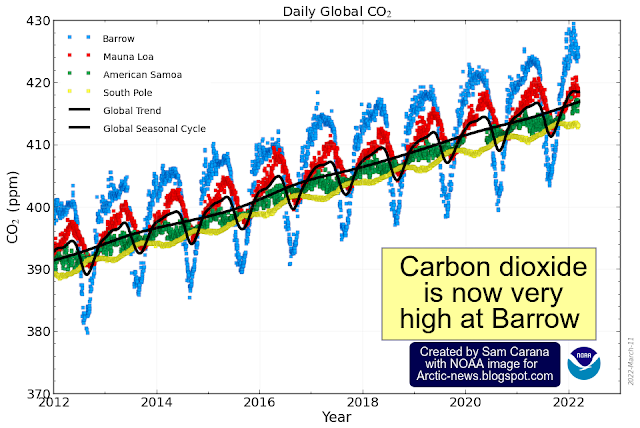
Carbon dioxide levels are currently very high over the Arctic, as illustrated by the image below that shows carbon dioxide levels approaching 430 parts per million (ppm) recently at Barrow, Alaska. 


Clouds tipping point

[ from earlier post ]
The danger is that high greenhouse gas levels could combine to push the carbon dioxide equivalent (CO₂e) level over the 1200 ppm clouds tipping point, at first in one spot, causing low-altitude clouds in various neighboring areas to break up there, and then propagating break-up of clouds in further areas, as discussed at the clouds feedback page.

The MetOp-B satellite recorded a mean methane level of 1958 ppb on October 25, 2021 am at 295 mb. When using a 1-year GWP of 200, this translates into 391.6 ppm CO₂e. Together with a global mean CO₂ level of 420 ppm, that's 811.6 ppm CO₂e, i.e. only 388.4 ppm CO₂e away from the 1200 ppm CO₂e clouds tipping point. 

The image on the right shows a trend based pointing at a methane level of almost 4000 ppb by end 2026, from an earlier post.

Alternatively, an additional 5 Gt of methane from abrupt release from the seafloor could raise the global mean methane concentration by about 2000 ppb, and even earlier than 2026.

At a 1-year GWP of 200, an extra 2000 ppb would translate into an extra 400 ppm CO₂e, thus pushing the joint impact of just two greenhouse gases (carbon dioxide and methane) above the 1200 ppm CO₂e clouds tipping point and raising the global temperature by 8°C due to the clouds feedback alone, i.e. on top of the additional rise caused by other warming elements, as further discussed below.


Seafloor methane eruptions could trigger a huge temperature rise 

Warnings about the potential for seafloor methane releases have been given repeatedly, such as in this 2017 analysis, in this 2019 analysis (image below) and in a recent analysis (2022). Researchers in 2019 found amounts of methane in the air over the East Siberian Sea up to nine times the global average.


2021 analysis indicates that massive methane seepage from the seafloor of the Arctic Ocean occurred during ice sheet wastage over the last and penultimate deglaciation periods (i.e. the Holocene, ~20-15 ka, respectively the Eemian, ~140-130 ka).

At the time, seafloor methane entering the atmosphere could be accommodated without resulting in huge temperature rises, because such releases were spread out over relatively long periods, while the level of methane in the atmosphere at the time was relatively low and since the lifetime of methane is limited to a decade or so. 

Today, circumstances are much more dire in many respects. While high heat peaks may have occurred locally during the last and penultimate deglaciation, today's global mean temperature is higher, as James Hansen et al., confirmed in a 2017 analysis. Furthermore, a 2012 analysis indicates that oceanic heat transport to the Arctic today is higher.

Greenhouse gas levels are very high at the moment and their rise is accelerating. As a result of the rapidity of today's rise, new seafloor methane eruptions can occur while previous methane releases haven't yet been broken down in the atmosphere. 
  
Seafloor methane eruptions can thus trigger a huge temperature rise, as illustrated by the image on the right, from the extinction page


Conclusions

The situation is dire and calls for the most comprehensive and effective action, as described at the Climate Plan.


Links

• NOAA - globally averaged marine surface monthly mean methane data
https://gml.noaa.gov/webdata/ccgg/trends/ch4/ch4_mm_gl.txt

• NOAA - globally averaged marine surface annual mean methane growth rates
https://gml.noaa.gov/webdata/ccgg/trends/ch4/ch4_gr_gl.txt

• NOAA - Infrared Atmospheric Sounding Interferometer (IASI) Sounding Products (MetOp-B)
https://www.ospo.noaa.gov/Products/atmosphere/soundings/iasi

• NOAA - Trends in Atmospheric Carbon Dioxide
https://gml.noaa.gov/ccgg/trends/gl_trend.html

• NOAA - Carbon Cycle Gases, Barrow Atmospheric Baseline Observatory, United States
https://gml.noaa.gov/dv/iadv/graph.php?code=BRW

• NOAA - Trends in Atmospheric Carbon Dioxide, Mauna Loa, Hawaii
https://gml.noaa.gov/ccgg/trends/graph.html

• Clouds feedback
https://arctic-news.blogspot.com/p/clouds-feedback.html

• Human Extinction by 2022?
https://arctic-news.blogspot.com/2021/11/human-extinction-by-2022.html

• Terrifying Arctic methane levels
https://arctic-news.blogspot.com/2021/12/terrifying-arctic-methane-levels.html

• Terrifying Arctic methane levels continue
https://arctic-news.blogspot.com/2022/01/terrifying-arctic-greenhouse-gas-levels-continue.html

• Current rates and mechanisms of subsea permafrost degradation in the East Siberian Arctic Shelf - by Nataia Shakhova et al. (2017)
https://www.nature.com/articles/ncomms15872

• Understanding the Permafrost–Hydrate System and Associated Methane Releases in the East Siberian Arctic Shelf - by Nataia Shakhova et al. (2019)
https://www.mdpi.com/2076-3263/9/6/251

• CNN - Russian scientists say they've found the highest-ever 'flares' of methane in Arctic waters
https://edition.cnn.com/2019/10/12/us/arctic-methane-gas-flare-trnd/index.html

• In-situ temperatures and thermal properties of the East Siberian Arctic shelf sediments: Key input for understanding the dynamics of subsea permafrost - by Evgeny Chuvilin et al. (2022)
https://www.sciencedirect.com/science/article/abs/pii/S0264817222000289

• When Will We Die?
https://arctic-news.blogspot.com/2019/06/when-will-we-die.html

• Arctic methane release due to melting ice is likely to happen again 
https://www.geosociety.org/GSA/News/pr/2021/21-15.aspx

• Ice-sheet melt drove methane emissions in the Arctic during the last two interglacials - by Pierre-Antoine Dessandier et al. (2021)
https://pubs.geoscienceworld.org/gsa/geology/article-abstract/49/7/799/595627/Ice-sheet-melt-drove-methane-emissions-in-the

• Contrasting ocean changes between the subpolar and polar North Atlantic during the past 135 ka - by Henning Bauch et al. (2012) 
https://agupubs.onlinelibrary.wiley.com/doi/full/10.1029/2012GL051800

• Young people's burden - by James Hansen et al. 

• Extinction

• Climate Plan

Saturday, July 3, 2021

A Temperature Rise Of More Than 18 Degrees Celsius By 2026?

On July 1, 2021 pm, the MetOp-1 satellite recorded a mean methane level of 1935 ppb at 293 mb.

[ from earlier post ]
This mean methane level translates into 387 ppm CO₂e at a 1-year Global Warming Potential (GWP) of 200. 

This GWP is appropriate in the light of the danger of a huge burst of methane erupting from the seafloor of the Arctic Ocean, which would, due to the abrupt nature of such an eruption, make its impact felt instantaneously.

Carbon dioxide on July 1, 2021, was 418.33 ppm, as illustrated by the NOAA image below.


Together, this CO₂e level of methane and this carbon dioxide level add up to 805.33 ppm CO₂e, which is 394.67 ppm CO₂e away from the 1200 ppm clouds tipping point which on its own could increase the temperature rise by a further 8°C, as discussed in an earlier post.

This 394.67 ppm CO₂e, again at a 1-year GWP of 200, translates into 1973 ppb of methane. In other words, a methane burst of 1973 ppb or about 5 Gt of methane would suffice to trigger the clouds feedback, adding a further 8°C to the temperature rise, as depicted in the image below. 


A 5 Gt seafloor methane burst would double methane in the atmosphere and could instantly raise the CO₂e level to 1200 ppm and trigger the clouds feedback (top right panel of above chart).

[ from earlier post ]
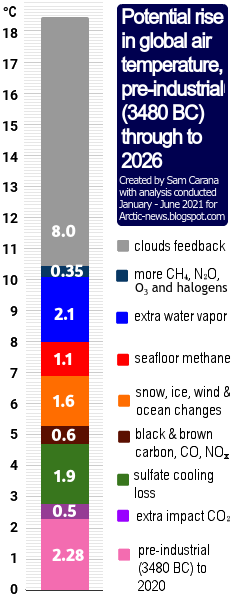
Even without such a huge eruption of methane from the seafloor, there are further pollutants than just carbon dioxide and methane, such as nitrous oxide, nitrogen oxides, CFCs, carbon monoxide, black carbon, brown carbon and water vapor, and they haven't yet been included in the above CO₂e total. The levels of all these pollutants could rise strongly in a matter of years and feedbacks could start kicking in with much greater ferocity, while the resulting extreme weather events would cause sulfate cooling to end, resulting in an 18.43°C temperature rise that could be reached as early as 2026 (left panel of above chart). 

To further illustrate this, the image on the right shows a trend that is based on NOAA 2006-2020 annual global mean methane data and that points at a mean of 3893 ppb getting crossed by the end of 2026, more than twice the 1935 ppb mean methane level of the image at the top.

Such a high mean methane level by 2026 cannot be ruled out, given the rapid recent growth in mean annual methane levels (15.85 ppb in 2020, see inset on image). And, as said, there are further pollutants, in addition to methane, and additional feedbacks to take into account. 

As discussed in an earlier post, humans will likely go extinct with a 3°C rise, while a 5°C rise will likely end most life on Earth. The temperature rise from pre-industrial to 2020 may well be as large as 2.28°C, as the bottom figure in the bar on the left of above chart shows and as discussed in an earlier post.

Will the IPCC get its act together?

Meanwhile, the IPCC plans to release its next report, the Working Group I contribution to the Sixth Assessment Report (AR6), on August 9, 2021, in the lead up to the COP 26 UN Climate Change Conference, from October 31 to November 12, 2021 in Glasgow, UK. Given their track record, the IPCC and politicians may be reluctant to even consider the information in this post, but it clearly is high time for the IPCC to get its act together. 


The IPCC said, in SR15_FAQ, that the "global temperature is currently rising by 0.2°C (±0.1°C) per decade, human-induced warming reached 1°C above pre-industrial levels around 2017 and, if this pace of warming continues, would reach 1.5°C around 2040." 

Sam Carana: "The temperature rise for the most recent decade (2011-2020) is 0.41°C (NASA data) and the rise from pre-industrial may be 2.28°C, so if this pace continued, 3.11°C could be reached by 2040 and humans will likely go extinct with a 3°C rise. Worse, the rise is accelerating and a rise of as much as 18.43°C could occur by 2026."

Potential temperature rise from pre-industrial to 2026

We face the threat of a potential temperature rise from pre-industrial to 2026 of 18.43°C and the eventual disappearance of all life from Earth, as illustrated by the image below. NASA data shows a 1920-2020 temperature rise of 1.29°C. To calculate the rise from pre-industrial, 0.29°C is added for the 3480 BC-1520 rise, 0.2°C for 1520-1750 and 0.3°C for 1750-1920, while 0.1°C is added to reflect higher polar anomalies and 0.1°C for air temperatures, adding up to a rise of 2.28°C from pre-industrial. A temperature rise of a further 16.15°C could happen by 2026, adding up to a total potential temperature rise of 18.43°C from pre-industrial to 2026. Most species will likely go extinct with a 5°C rise, but humans will likely go extinct with a 3°C rise and eventually, all life would disappear from Earth, as discussed in an earlier post.


In the video below, Guy McPherson comments on the IPCC.


EPA could and should act now

In the US, Joe Biden could simply instruct the EPA to enforce tighter standards. The US supreme court ruled on June 26, 2006, that the EPA has the authority to set standards for greenhouse gas emissions. In 2009, the EPA confirmed that greenhouse gas emissions are pollutants that endanger public health and welfare through their impacts on climate change and admitted that the EPA has the responsibility and the duty to regulate greenhouse gas emissions, and it took until August 3, 2015, for the EPA to issue the Clean Power Plan, giving states a number of choices how to reach set targets for CO₂ emissions. In the light of recent scientific findings and in line with the Paris Agreement, adopted on 12 December 2015, it now makes sense for the EPA to strengthen these targets and enforce this without delay.

Conclusion

The situation is clearly dire and calls for more immediate, more comprehensive and more effective action, as described in the Climate Plan.


Links

• Climate Plan
https://arctic-news.blogspot.com/p/climateplan.html

• Could temperatures keep rising?

• Confirm Methane's Importance
https://arctic-news.blogspot.com/2021/03/confirm-methanes-importance.html

• When Will We Die?
https://arctic-news.blogspot.com/2019/06/when-will-we-die.html

• Overshoot or Omnicide?
https://arctic-news.blogspot.com/2021/03/overshoot-or-omnicide.html

• NASA, Goddard Institute for Space Studies (GISS)
https://data.giss.nasa.gov/gistemp

• IPCC:  Frequently Asked Questions, Special Report on Global Warming of 1.5°C
https://www.ipcc.ch/site/assets/uploads/sites/2/2018/12/SR15_FAQ_Low_Res.pdf

• Possible climate transitions from breakup of stratocumulus decks under greenhouse warming - by Tapio Schneider et al.
https://www.nature.com/articles/s41561-019-0310-1

• Most Important Message Ever
https://arctic-news.blogspot.com/2019/07/most-important-message-ever.html

• Heatwaves and the danger of the Arctic Ocean heating up

• Science Update: Continued IPCC Conservatism and Lies - by Guy McPherson