Monthly Northern Hemisphere Land Temperature Anomaly
Temperatures have been rising fast in March 2023. The image below shows the Monthly Northern Hemisphere Land Temperature Anomaly up to March 2023, with two trends added. The blue trend, based on Jan.1850-Mar.2023 NOAA data, points at a 3°C rise in 2032. The magenta trend, based on Oct.2010-Mar.2023 NOAA data, better reflects variables such as El Niño and sunspots, and illustrates how they could trigger a rise of more than 5°C in 2026. Anomalies are versus 1901-2000 (not versus pre-industrial).
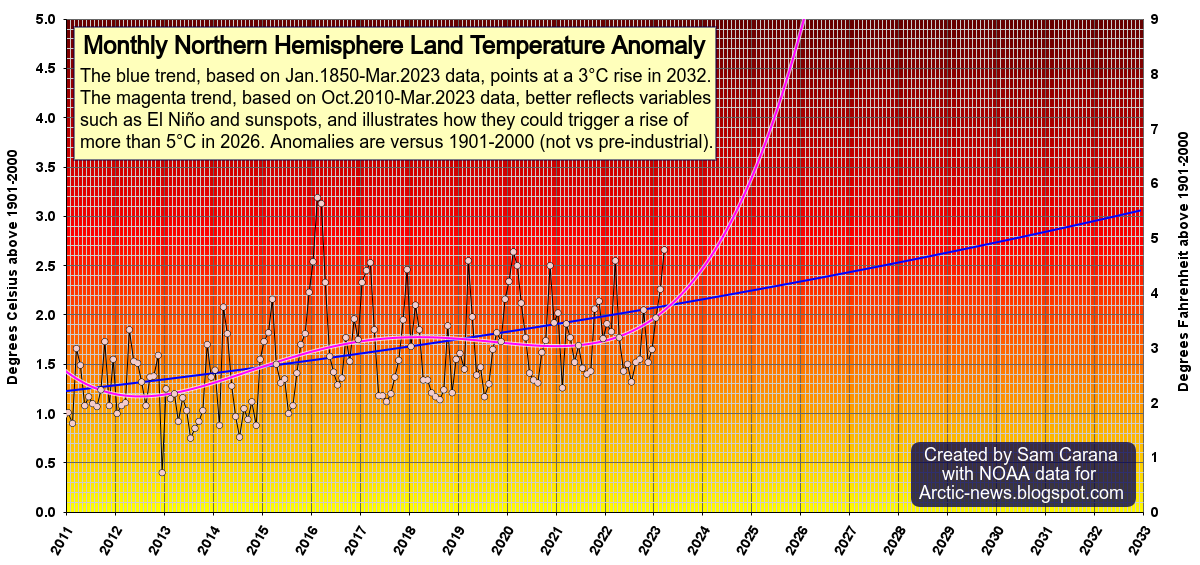
Could it be possible for the temperature to keep following the magenta trend? Let's have a look at how dire the situation is.
Greenhouse gas concentrations keep rising

The above image illustrates that carbon dioxide (CO₂) was at a record high at Mauna Loa, Hawaii, in three ways:
- Daily Record: CO₂ was 424.83 ppm on April 17, 2023;
- Weekly Record: Average CO₂ was 422.88 ppm for the week beginning April 9, 2023; and
- Monthly Record: CO₂ in March 2023 was 421 ppm.
CO₂ typically reaches its annual high in May or June, so these records can be expected to be broken over the next few months.
NOAA has issued an El Niño Watch, and the range of possibilities toward the end of the year includes a strong El Niño (4 in 10 chance of Niño-3.4 ≥ 1.5°C) to no El Niño (1 in 10 chance).


This year (2023), the sea surface temperature (60°S-60°N) has already been above 21°C for 27 days. Such temperatures are unprecedented in the NOAA record that goes back to 1981. The image below shows the difference between all those years. The black line (2023) is as much as 0.3°C hotter than the orange line (2022), and we're only just entering the upcoming El Niño.

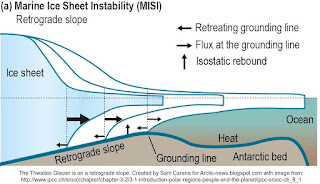
The above image illustrates the danger of two tipping points getting crossed, i.e. the Latent Heat Tipping Point and the Seafloor Methane Tipping Point.
A huge temperature rise thus threatens to unfold over the next few years, as illustrated by the image on the right. Altogether, the rise from pre-industrial to 2026 could be more than 18.44°C by 2026.
This situation calls for urgent action. Reducing emissions alone won't be enough. Carbon also needs to be removed from the atmosphere and oceans, through re-/afforestation, through pyrolysis of biowaste with the resulting biochar (and nutrients) returned to the soil and further methods. Even with a rapid transition to clean, renewable energy, with changes to food, land use, construction and waste management, and with removal of large amounts of carbon from the atmosphere and oceans, still more action is needed.

Links
• NOAA - Monthly Northern Hemisphere Land Temperature Anomaly
https://www.ncei.noaa.gov/access/monitoring/climate-at-a-glance/global/time-series/nhem/land/all/3/1850-2023
• NOAA - Recent Daily Average Mauna Loa CO2
• Climate Emergency Declaration
https://arctic-news.blogspot.com/p/climate-emergency-declaration.html
 |
| [ from earlier post ] |
Crucially, methane emissions should be cut. The Clouds Tipping Point, at 1200 ppm CO₂e, could be crossed as early as in 2027 due to forcing caused by the rise in methane alone, and crossing this tipping point on its own could result in a further rise of 8°C. When further forcing than the forcing just from methane is taken into account, this could happen even earlier than in 2027.
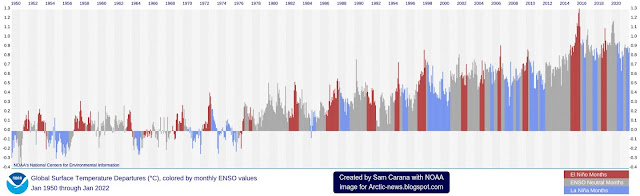
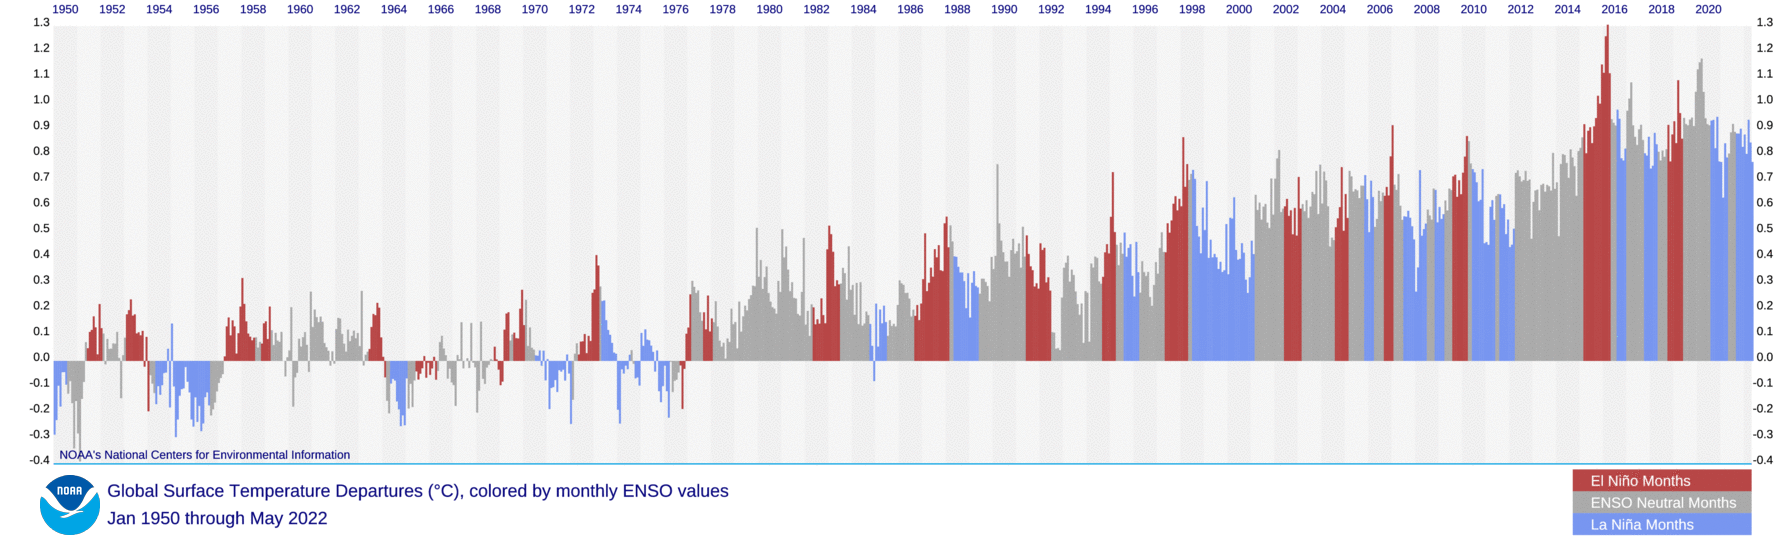
El Niño and further variables
 |
| [ click on images to enlarge ] |
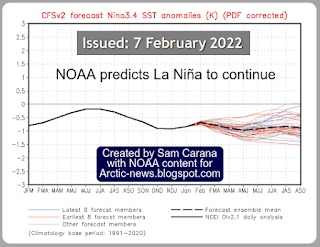
Meanwhile, we're moving into an El Niño, as illustrated by the image on the right, adapted from NOAA.
Moving from the bottom of a La Niña to the peak of a strong El Niño could make a difference of more than half a degree Celsius, as illustrated by the images below, adapted from NOAA.

As illustrated by the image below, the difference in temperature between November 2022 and March 2023 already is about half a degree Celsius and we are not even in an El Niño yet.

El Niño is expected to reach its full strength within a few years, with a maximum possible in 2026.
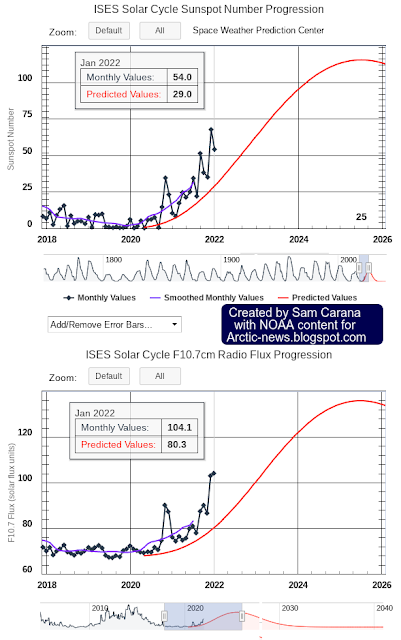
Furthermore, sunspots look set to reach a high maximum within years, and the 2022 Tonga submarine volcano eruption did add a huge amount of water vapor to the atmosphere, as discussed in an earlier post.
Ocean heat, feedbacks and tipping points

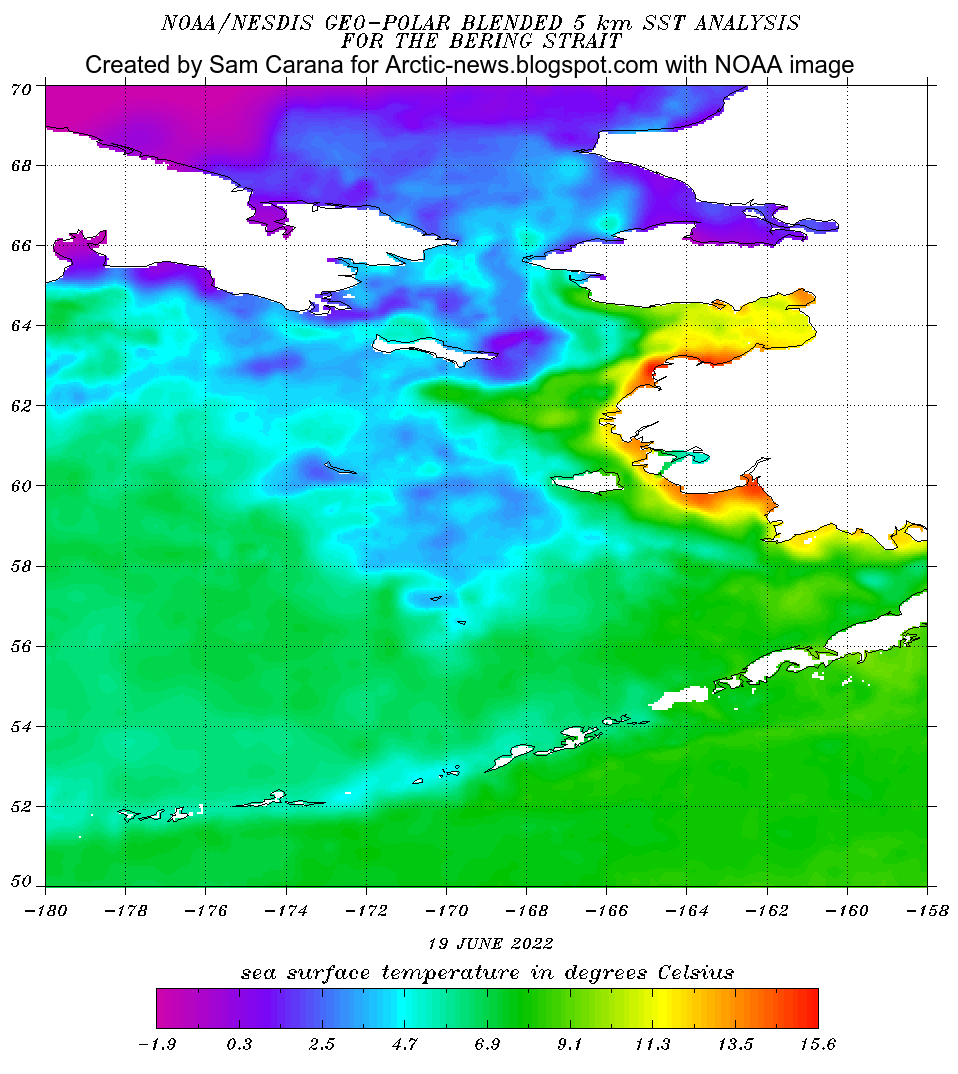
Vast amounts of ocean heat are moving toward the Arctic this year. With further melting of sea ice and thawing of permafrost, the Arctic Ocean can be expected to receive more and more heat over the next few years, i.e. more heat from direct sunlight, more heat from rivers, more heat from heatwaves and more ocean heat from the Atlantic Ocean and the Pacific Ocean.
Last year, North Atlantic sea surface temperatures reached a record high of 24.9°C in early September. Rising temperatures threaten to trigger massive loss of sea ice (and loss of albedo) and eruptions of methane from the seafloor of the Arctic Ocean, as has been described many times before, such as in this post, in this post and in this post.
 |
| [ from earlier post ] |
The above image illustrates the danger of two tipping points getting crossed, i.e. the Latent Heat Tipping Point and the Seafloor Methane Tipping Point.
 |
| Latent heat loss, feedback #14 on the Feedbacks page |
 |
| [ see the Extinction page ] |
This threatens to cause rapid destabilization of methane hydrates at the seafloor of the Arctic Ocean leading to explosive eruptions of methane, as its volume increases 160 to 180-fold when leaving the hydrates, as illustrated by the above image.
Conclusion
Meanwhile, humans are likely to go extinct with a rise of 3°C and most life on Earth will disappear with a 5°C rise, as illustrated by the image below, from an analysis discussed in an earlier post.
This situation calls for urgent action. Reducing emissions alone won't be enough. Carbon also needs to be removed from the atmosphere and oceans, through re-/afforestation, through pyrolysis of biowaste with the resulting biochar (and nutrients) returned to the soil and further methods. Even with a rapid transition to clean, renewable energy, with changes to food, land use, construction and waste management, and with removal of large amounts of carbon from the atmosphere and oceans, still more action is needed.
Marine Cloud Brightening is a good idea, while many further methods may first need more surplus clean energy to be available and/or require more R&D.
Whether action will happen successfully and rapidly enough is indeed a good question, but that question shouldn't be used as an excuse to delay such action, since taking such action simply is the right thing to do.
Accordingly, everyone is encouraged to support and share this Climate Emergency Declaration.
Accordingly, everyone is encouraged to support and share this Climate Emergency Declaration.
 |
| [ image from Climate Emergency Declaration ] |
Links
• NOAA - Monthly Northern Hemisphere Land Temperature Anomaly
https://www.ncei.noaa.gov/access/monitoring/climate-at-a-glance/global/time-series/nhem/land/all/3/1850-2023
• NOAA - Recent Daily Average Mauna Loa CO2
• NOAA - Weekly average CO2 at Mauna Loa
https://gml.noaa.gov/ccgg/trends/weekly.html
• Climate Reanalyzer - Daily sea surface temperatures
https://climatereanalyzer.org/clim/sst_daily
• Sea surface temperature at record high
https://arctic-news.blogspot.com/2023/03/sea-surface-temperature-at-record-high.html
• Dire situation gets even more dire
• NOAA - Monthly Temperature Anomalies Versus El Niño
https://www.ncei.noaa.gov/access/monitoring/monthly-report/global/202303/supplemental/page-4
https://gml.noaa.gov/ccgg/trends/weekly.html
• Climate Reanalyzer - Daily sea surface temperatures
https://climatereanalyzer.org/clim/sst_daily
• Sea surface temperature at record high
https://arctic-news.blogspot.com/2023/03/sea-surface-temperature-at-record-high.html
• Dire situation gets even more dire
https://arctic-news.blogspot.com/2023/02/dire-situation-gets-even-more-dire.html
• IPCC keeps downplaying the danger even as reality strikes
https://arctic-news.blogspot.com/2023/04/ipcc-keeps-downplaying-the-danger-even-as-reality-strikes.html
• IPCC keeps downplaying the danger even as reality strikes
https://arctic-news.blogspot.com/2023/04/ipcc-keeps-downplaying-the-danger-even-as-reality-strikes.html
• NOAA - Climate Prediction Center - ENSO: Recent Evolution, Current Status and Predictions
https://www.cpc.ncep.noaa.gov/products/analysis_monitoring/lanina/enso_evolution-status-fcsts-web.pdf
https://www.cpc.ncep.noaa.gov/products/analysis_monitoring/lanina/enso_evolution-status-fcsts-web.pdf
• NOAA - Climate Prediction Center - ENSO Discussion
• NOAA - Monthly Temperature Anomalies Versus El Niño
https://www.ncei.noaa.gov/access/monitoring/monthly-report/global/202303/supplemental/page-4
https://arctic-news.blogspot.com/p/climate-emergency-declaration.html


