The concentration of carbon dioxide (CO₂) in the atmosphere recently broke two records at Mauna Loa, Hawaii, CO₂ was 421.63 in the week starting May 29, 2022, while CO₂ was 420.99 ppm in May 2022.

Earlier, very high daily and hourly measurements were recorded at Mauna Loa, as illustrated by the image below, showing one hourly measurement of 424 ppm (on May 28, 2022), as well as sequences of daily measurements in the green insets.

The image below shows carbon dioxide concentration rising over the past few years, with surface flask measurements well above 422 ppm at Mauna Loa recently.

Carbon dioxide concentration is even higher over the Arctic. The image below shows carbon dioxide approaching 430 ppm at Barrow, Alaska.

To get an idea how much greenhouse gases have risen, a 2021 study points at concentrations of 190 ppm for CO₂, 370-375 ppb for CH₄ and 200-245 ppb for N₂O some 18 ka to 21 ka. By comparison, the MetOp image below shows a global mean methane level of 1951 ppb, which is more than five times as high, while the image also shows a peak of 2405 ppb, at 293 mb on June 7, 2022 pm.

The MetOp image below shows a lot of methane over the Arctic on May 30, 2022 pm, at 742 mb, which is much closer to sea level.


Greenhouse gas levels are very high and there are many further indications that a huge temperature rise could take place over the next few years.
Cataclysmic alignment of El Niño and sunspots
 The trigger for such a huge rise could be a cataclysmic alignment of the upcoming El Niño with a high number of sunspots, which look set to reach maximum impact around July 2025.
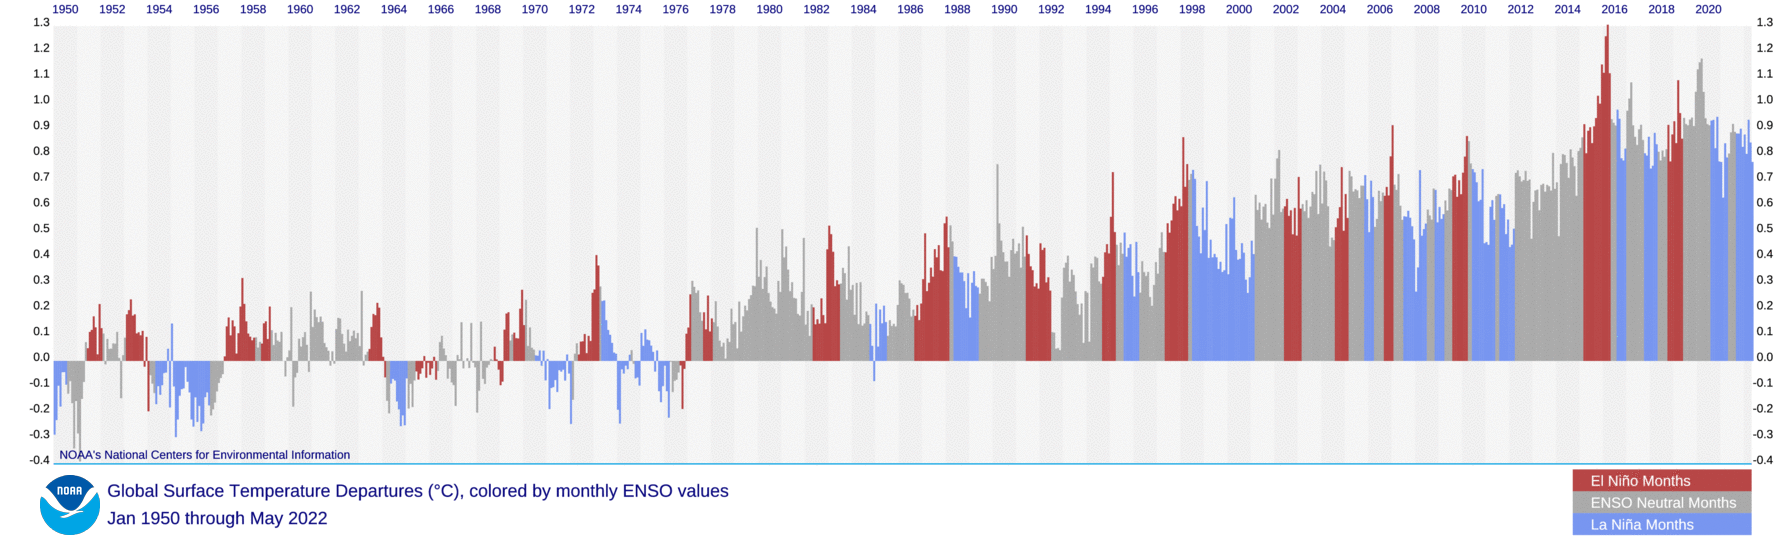
We are currently in the depths of a persistent La Niña, as illustrated by the image on the right, adapted from NOAA. This suppresses the temperature rise.
El Niños typically occur every 3 to 5 years, according to NOAA and as also illustrated by the NOAA image below, so the upcoming El Niño can be expected to occur soon.


Sunspots are currently well above what NOAA predicted, as illustrated by the image on the right, adapted from NOAA.
The more sunspot, the more the temperature goes up. The rise in sunspots from May 2020 to July 2025 could make a difference of some 0.15°C (0.27°F).
The next El Niño looks set to line up with a high peak in sunspots, in a cataclysmic alignment that could push up the temperature enough to cause dramatic sea ice loss in the Arctic, resulting in runaway temperature rise by 2026.
A huge temperature rise in the Arctic
There are many further indications that we're on the brink of a huge temperature rise in the Arctic.
This would in turn also cause more water vapor to enter the atmosphere, further speeding up the temperature rise, especially in the Arctic, where vast amounts of methane are contained in sediments at the seafloor and where there is very little hydroxyl in the air to break down the methane.
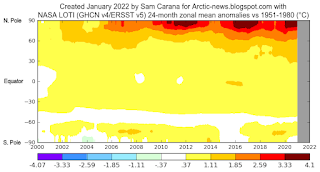
Temperatures look set to rise further in the Arctic, due to falling away of sulfate aerosols, as illustrated by the IPCC image below that shows how much temperatures are currently suppressed in the Arctic due to aerosols and thus also shows how much temperatures in the Arctic look set to rise as the aerosol masking effect falls away.
Conversely, there could be a temperature rise due to releases of other aerosols that have a net warming impact, such as black and brown carbon, which can increase dramatically as more wood burning, forest fires and urban fires take place, which again would hit the Arctic hard by darkening the surface as they settle on the snow and ice cover, thus speeding up its decline.

Furthermore, the combined impact of aerosols and nitrogen fertilizers has been underestimated; a recent study concludes that when ammonia, nitric acid and sulfuric acid are present together, they contribute strongly to the formation of cirrus clouds.
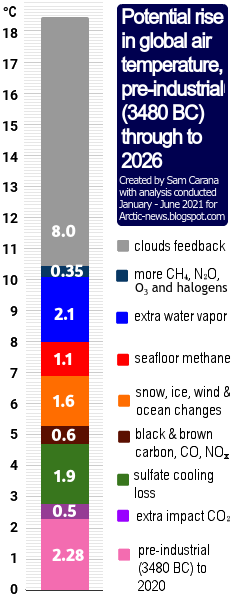
Altogether, the global temperature could rise by more than 18°C above pre-industrial, as illustrated by the image further above on the right, and as also discussed at the Extinction page.


• Sunspots
https://arctic-news.blogspot.com/p/sunspots.html
• NOAA - sunspots
https://www.swpc.noaa.gov/products/solar-cycle-progression
• Latent heat
https://arctic-news.blogspot.com/p/latent-heat.html
• Blue Ocean Event
https://arctic-news.blogspot.com/p/blue-ocean-event.html
• Feedbacks
https://arctic-news.blogspot.com/p/feedbacks.html
• Aerosols
https://arctic-news.blogspot.com/p/aerosols.html
• Discovery uncovers need for ammonia emission regulations
• Runaway temperature rise by 2026?
• When Will We Die?
https://arctic-news.blogspot.com/2019/06/when-will-we-die.html
• NOAA annual mean global methane data (downloaded June 10, 2022)
https://gml.noaa.gov/webdata/ccgg/trends/ch4/ch4_annmean_gl.txt
• Climate Plan
https://arctic-news.blogspot.com/p/climateplan.html
The next El Niño looks set to line up with a high peak in sunspots, in a cataclysmic alignment that could push up the temperature enough to cause dramatic sea ice loss in the Arctic, resulting in runaway temperature rise by 2026.
A huge temperature rise in the Arctic
There are many further indications that we're on the brink of a huge temperature rise in the Arctic.
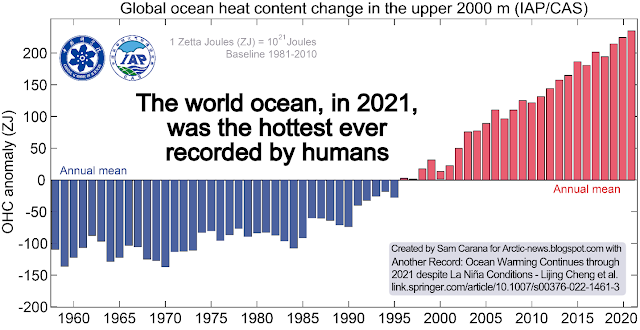
Ocean heat that enters the Arctic Ocean from the Atlantic Ocean and the Pacific Ocean keeps rising.
 |
| [ see also more background at the Extinction page ] |
As a result, several tipping points threaten to be crossed in the Arctic soon, as described in an earlier post, including the latent heat tipping point and a Blue Ocean Event (starting when Arctic sea ice extent will fall below 1 million km²), which would further speed up the temperature rise in the Arctic.
As temperatures keep rising in the Arctic, changes to the Jet Stream look set to intensify, resulting in loss of terrestrial albedo in the Arctic that could equal the albedo loss resulting from sea ice decline.
Further feedbacks include permafrost degradation, both terrestrial and on the seafloor of the Arctic Ocean, which looks set to cause huge releases of greenhouse gases (particularly CO₂, CH₄ and N₂O).
This would in turn also cause more water vapor to enter the atmosphere, further speeding up the temperature rise, especially in the Arctic, where vast amounts of methane are contained in sediments at the seafloor and where there is very little hydroxyl in the air to break down the methane.
Temperatures look set to rise further in the Arctic, due to falling away of sulfate aerosols, as illustrated by the IPCC image below that shows how much temperatures are currently suppressed in the Arctic due to aerosols and thus also shows how much temperatures in the Arctic look set to rise as the aerosol masking effect falls away.
Conversely, there could be a temperature rise due to releases of other aerosols that have a net warming impact, such as black and brown carbon, which can increase dramatically as more wood burning, forest fires and urban fires take place, which again would hit the Arctic hard by darkening the surface as they settle on the snow and ice cover, thus speeding up its decline.

Furthermore, the combined impact of aerosols and nitrogen fertilizers has been underestimated; a recent study concludes that when ammonia, nitric acid and sulfuric acid are present together, they contribute strongly to the formation of cirrus clouds.
Global temperature rise
As the temperature keeps rising, further self-reinforcing feedbacks will kick in with more ferocity such as an increase in water vapor globally combined with a decrease in lower clouds decks, further increasing the temperature, as described at the clouds feedback page.
Human extinction by 2025?
 |
| [ from earlier post ] |
 |
| [ from earlier post ] |
An April 2022 analysis found that the temperature rise from pre-industrial to March 2022 could be as much as 2.35°C. When adding 0.65°C for the joint impact of the upcoming El Niño and a peak in sunspots, the rise could be as much as 3°C by 2025, as also depicted in the image on the right, from that same analysis.
A 2018 study (by Strona & Bradshaw) indicates that most life on Earth will disappear with a 5°C rise. Humans, who depend for their survival on many other species, will likely go extinct with a 3°C rise, as illustrated by the image below, from an earlier post.
Rise beyond 2026
As said, a temperature rise of 3°C from pre-industrial could be reached by 2025 just due to the combined push of the upcoming El Niño and a peak in sunspots, i.e. without change in other forcers.
What would happen if just methane kept rising, i.e. without change in other forcers? The image below shows methane with a trend added that points at a rise that could represent a forcing of 780 ppm CO₂e in 2028, which means that the clouds tipping point at 1200 ppm CO₂e would be crossed by methane and carbon dioxide alone (assuming no change in other forcers and with carbon dioxide remaining at 421 ppm), which would cause an additional 8°C rise in temperature.
What would happen if just methane kept rising, i.e. without change in other forcers? The image below shows methane with a trend added that points at a rise that could represent a forcing of 780 ppm CO₂e in 2028, which means that the clouds tipping point at 1200 ppm CO₂e would be crossed by methane and carbon dioxide alone (assuming no change in other forcers and with carbon dioxide remaining at 421 ppm), which would cause an additional 8°C rise in temperature.

The above image shows that such a trend is contained in existing methane data. When also adding a large eruption of methane from the seafloor of the Arctic Ocean, the situation would be even worse, further underlining the potential for a rise of more than 18°C by 2026.
Conclusion
In conclusion, temperatures could rise strongly soon, driving humans extinct as early as in 2025, while temperatures could skyrocket in 2026, making it in many respects rather futile to speculate about what will happen beyond 2026. At the same time, the right thing to do now is to help avoid the worst things from happening, through comprehensive and effective action as described in the Climate Plan.
In the video below, Jennifer Hynes and Sandy Schoelles discuss the situation.
Links
• NOAA - Global Monitoring Laboratory, Recent Daily Average CO₂ at Mauna Loa, Hawaii, U.S.
https://gml.noaa.gov/ccgg/trends
• NOAA - Global Monitoring Laboratory, at Barrow, Alaska, U.S.
https://gml.noaa.gov/dv/iadv/graph.php?code=BRW&program=ccgg&type=ts
• Globally resolved surface temperatures since the Last Glacial Maximum - by Matthew Osman et al. (2021)
https://www.nature.com/articles/s41586-021-03984-4
• Arctic Hit By Ten Tipping Points
https://arctic-news.blogspot.com/2020/04/arctic-hit-by-ten-tipping-points.html
• NOAA - ENSO: Recent Evolution, Current Status and Predictions
https://www.cpc.ncep.noaa.gov/products/analysis_monitoring/lanina/enso_evolution-status-fcsts-web.pdf
• NOAA - El Niño
https://www.noaa.gov/education/resource-collections/weather-atmosphere/el-nino#:~:text=An%20El%20Ni%C3%B1o%20condition%20occurs,every%203%20to%205%20years.
• NOAA - Monthly Temperature Anomalies Versus El Niño
https://www.ncei.noaa.gov/access/monitoring/monthly-report/global/202204/supplemental/page-4
• MetOp satellite
https://www.ospo.noaa.gov/Products/atmosphere/soundings/iasi
• NOAA 20 satellite
https://www.ospo.noaa.gov/Products/atmosphere/soundings/nucaps/NUCAPS_composite.html
• Ten temperature rise indications
• Sunspots
https://arctic-news.blogspot.com/p/sunspots.html
• NOAA - sunspots
https://www.swpc.noaa.gov/products/solar-cycle-progression
• Latent heat
https://arctic-news.blogspot.com/p/latent-heat.html
• Blue Ocean Event
https://arctic-news.blogspot.com/p/blue-ocean-event.html
• Feedbacks
https://arctic-news.blogspot.com/p/feedbacks.html
• Aerosols
https://arctic-news.blogspot.com/p/aerosols.html
• Discovery uncovers need for ammonia emission regulations
https://engineering.cmu.edu/.../05/18-ammonia-emissions.html
• How ice clouds develop – Asian monsoon influences large parts of the Northern Hemisphere https://aktuelles.uni-frankfurt.de/.../how-ice-clouds...
• Synergistic HNO3 H2SO4 NH3 upper tropospheric particle formation - by Mingyi Wang et al. https://www.nature.com/articles/s41586-022-04605-4
• Clouds feedback and tipping point
https://arctic-news.blogspot.com/p/clouds-feedback.html
• Jet Stream
https://arctic-news.blogspot.com/p/jet-stream.html
• The Importance of Methane
https://arctic-news.blogspot.com/p/the-importance-of-methane-in-climate.html
• Pre-industrial
• Runaway temperature rise by 2026?
https://arctic-news.blogspot.com/2022/04/runaway-temperature-rise-by-2026.html
• Co-extinctions annihilate planetary life during extreme environmental change - by Giovanni Strona and Corey Bradshaw (2018)
• Co-extinctions annihilate planetary life during extreme environmental change - by Giovanni Strona and Corey Bradshaw (2018)
• When Will We Die?
https://arctic-news.blogspot.com/2019/06/when-will-we-die.html
• NOAA annual mean global methane data (downloaded June 10, 2022)
https://gml.noaa.gov/webdata/ccgg/trends/ch4/ch4_annmean_gl.txt
• Climate Plan
https://arctic-news.blogspot.com/p/climateplan.html


