Ten temperature rise indications

The image below was created November 27, 2011, and was part of a poster displayed at AGU 2011, warning about temperatures in the Arctic rising much faster than elsewhere in the world. A trend added on the image shows temperatures approaching 10°C in the 2030s on the background of NASA anomalies versus 1951-1980 in the Arctic.


An updated version of the image was added in March 2012, with the added trend showing temperatures exceeding 10°C above 1951-1980.


The image below, from a January 2013 post, shows Arctic temperature anomalies with a fourth order polynomial trend added to NASA data.


The image below, from a November 2013 post, warned about a possible 20°C global temperature rise by 2054.


A 2015 post used an updated version of the image, warned about a possible 20°C global temperature rise by 2054, with a warning added that numerous deaths may eventuate within decades. 

Politicians have ignored these warnings for more than a decade and, in some respects, the warnings may even have been too conservative; the above image may have given the impression that such a global temperature rise would be at least decades away, enough for mitigating action to be taken. 

An image from a 2016 post warned that a huge rise could take place within a decade, i.e. a temperature rise from 1900 of more than 10°C by 2026. 


The above image and further content of the post was also used to create the Extinction Page.

The image below, from a January 2024 post, shows a number of potential temperature trends.

[ click on images to enlarge ]

Here are ten critical issues that could trigger a huge global temperature rise as early as 2026. 

1. The inititial trigger: El Niño and sunspots

A huge temperature rise in the Arctic looks set to unfold due to the combined impact of an upcoming El Niño and higher sunspots, which could be the trigger for loss of the latent heat buffer, and albedo losses due to further sea ice decline, as further discussed below. As temperatures keep rising in the Arctic, changes to the Jet Stream look set to intensify, while loss of terrestrial albedo in the Arctic could equal the albedo loss resulting from sea ice decline. Meanwhile, rising ocean heat and greenhouse gases are already reaching critical levels, especially in the Arctic. 

2. Ocean heat

The image below shows a trend (based on 1880-2020 data) for sea surface temperature anomalies (versus the 20th century average) on the Northern Hemisphere. Note that the image indicates that the latent heat tipping point was crossed in the year 2020. 


Keep in mind that the above image shows sea surface temperature anomalies, which are suppressed during a La Niña period. We're currently in the depth of a persistent La Niña. Underneath the sea surface, though, temperatures are rising fast which could be even more critical than the temperature rise at the surface, the more so since a freshwater lid appears to be forming at the ocean surface that enables hot water to dive underneath this lid and underneath the sea ice, and enter the Arctic Ocean.  

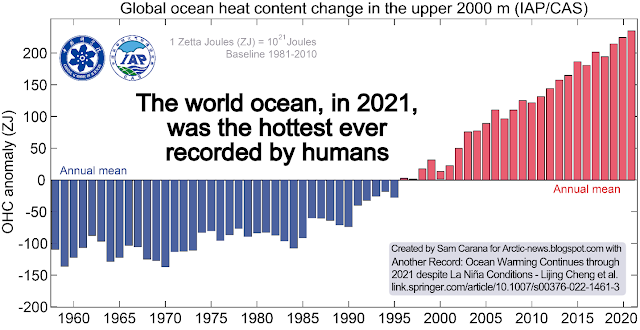
As the image below shows, the world ocean, in 2021, was the hottest ever recorded by humans (Lijing Cheng et al., 2022).


The image below shows that sea surface temperatures were as much as 14.8°C or 26.6°F higher than 1981-2011 off the North American coast (green circle) on May 17, 2022.


Ocean heat is carried along the path of the Gulf Stream into the Arctic Ocean, melting Arctic sea ice.

3. Jet Stream

As temperature in the Arctic rises, the Jet Stream changes, resulting in more extreme weather and enabling cold air to leave the Arctic and warmer air to enter the Arctic. This, in combination with the freshwater lid on top of the North Atlantic, can cause ocean heat to build up in the Atlantic Ocean, to suddenly be pushed along the path of the Gulf Stream at high speed into the Arctic Ocean, as discussed in an earlier post.

4. Latent Heat


The amount of energy absorbed by melting ice is as much as it takes to heat an equivalent mass of water from zero to 80°C.

As the temperature of the ocean rises, ever less sea ice remains in the Arctic. Once the sea ice is gone, further heat arriving in the Arctic Ocean will strongly raise the water temperature and the atmosphere over the Arctic Ocean.

The image on the right shows a trend based on PIOMAS data. The trend points at zero Arctic sea ice volume by September 2027. Note that the volume data in the image are averages for the month September ⁠— the minimum for each year is even lower.

5. Methane


The methane hydrates tipping point is estimated to get crossed as ocean temperature anomalies on the Northern Hemisphere become higher than 1.35°C above the 20th century average, as the image further above indicates. This could result in mass releases of methane from the seafloor. while seafloor methane could already start erupting in large quantities beforehand at vulnerable locations. 


The images show high methane levels that have recently been recorded at Mauna Loa, Hawaii, and at Barrow, Alaska. 


6. Carbon dioxide

NOAA data show a Carbon dioxide (CO₂) level of 421.13 parts per million (ppm) for the week starting May 8, 2022, a new record high since measurements started at Mauna Loa, Hawaii. The images below, from an earlier post, show that very high daily levels were reached recently.


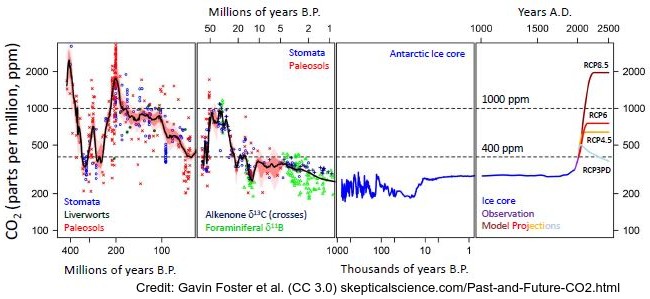
Carbon dioxide levels are even higher over the Arctic. Very high carbon dioxide levels were recorded recently at Barrow, Alaska.


To find historic CO₂ levels this high, we'd have to go back millions of years, as illustrated by the image below, from an earlier post


Between 14 and 15 million years ago, the temperature in central Europe was 20°C higher than today, as illustrated by the image below (adapted from a 2020 study by Methner et al.).
 

Given these very high CO₂ levels today, why is the temperature in central Europe not 20°C higher? There are two things that are delaying the temperature rise, oceans due to their mass take years to heat up, and sea ice acts as a buffer, consuming ocean heat in the process of melting. 

7. Albedo change

Furthermore, without sea ice, less sunlight will be reflected back into space, and will instead be absorbed by the Arctic. Sea ice reflects 50% to 70% of the incoming energy, while thick sea ice covered with snow reflects as much as 90% of the incoming solar radiation. The ocean reflects only 6% of the incoming solar radiation and absorbs the rest, as discussed at the albedo page.


An analysis by Pistone et al., published 2014, found an additional 6.4 ± 0.9 W/m² of solar energy input into the Arctic Ocean region between 1979 and 2011. Averaged over the globe, this albedo decrease would correspond to a forcing that is 25% as large as that due to the change in CO₂ during this period. However, this extra heat has especially raised temperatures in the Arctic. This is illustrated by the image on the right, created with a NASA image that shows temperature anomalies of up to 4.1°C (versus 1951-1980) over the Arctic Ocean.

The next image on the right, by Climate Reanalyzer, illustrates that very high temperature anomalies can show up at the highest latitudes North during Winter on the Northern Hemisphere, in this case a temperature anomaly (vs 1979-2000) of 7°C for the Arctic as a whole on February 28, 2022.

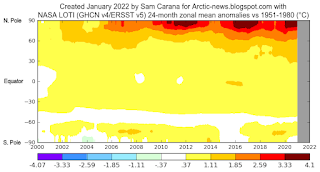
It is ominous that such high anomalies show up in the Arctic during a La Niña period and during Winter on the Northern Hemisphere, when only very little sunlight is reaching the Arctic. 

8. Emissions from what used to be permafrost

[ from the Extinction page ]
Permafrost degradation, both terrestrial and on the seafloor of the Arctic Ocean, looks set to cause huge releases of greenhouse gases (particularly CO₂, CH₄ and N₂O), in turn also causing more water vapor to enter the atmosphere, causing a huge rise in temperature, especially in the Arctic, where vast amounts of methane are contained in sediments at the seafloor.

9. Loss of aerosol masking effect, rise of black carbon

A further rise in temperature to rise looks set to unfold due to the falling away of sulfate aerosols, while there could be a further temperature rise due to releases of other aerosols that have a net warming impact, such as black and brown carbon, which can increase dramatically as more wood burning and forest fires take place.

10. Clouds feedback

As the temperature keeps rising, this will trigger further self-reinforcing feedbacks such as an increase in water vapor combined with a decrease in lower clouds decks, further increasing the temperature, as described at the clouds feedback page

Joint impact

There are further tipping points and, importantly, there can be a lot of interaction between them. An earlier post mentions the collapse of biosystems and loss of carbon sinks. 

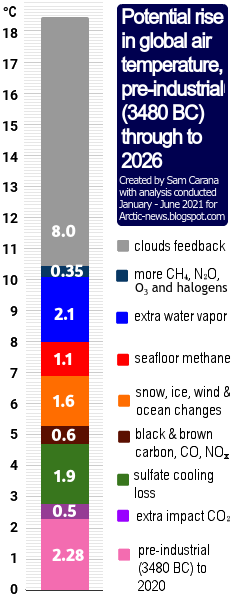
Altogether, the temperature rise by 2026 could be more than 18°C compared to pre-industrial, as illustrated by the image on the right from the Extinction page

Conclusion

The situation is dire and calls for comprehensive and effective action, as discussed in the Climate Plan.


Links

• Methane Levels Early 2015

• Arctic Methane Impact


• NOAA Global Time Series


• Another Record: Ocean Warming Continues through 2021 despite La Niña Conditions - by Lijing Cheng et al. (2022) 
https://link.springer.com/article/10.1007/s00376-022-1461-3

• Latent heat
https://arctic-news.blogspot.com/p/latent-heat.html


• Warning of mass extinction of species, including humans, within one decade

• NOAA - methane levels at Mauna Loa, Hawaii, and at Barrow, Alaska

• Carbon dioxide reaches another record high

• From a Miocene-like CO2 level of ~420 ppm to irreversible climate change

• Observational determination of albedo decrease caused by vanishing Arctic sea ice - by Kristina Pistone et al.  (2014)

• Aerosols

• The Clouds Feedback and the Clouds Tipping Point
https://arctic-news.blogspot.com/p/clouds-feedback.html

• Arctic Hit By Ten Tipping Points