
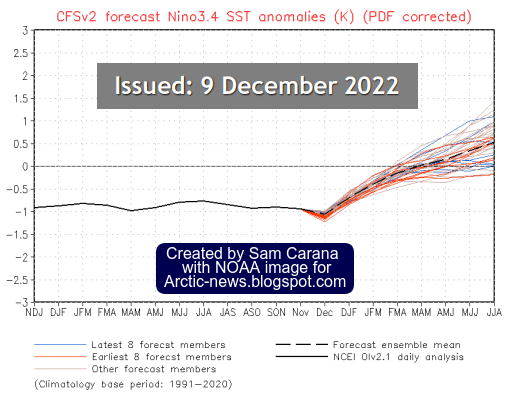
The NOAA image on the right indicates that, while we're still in the depths of a persistent La Niña, the next El Niño looks set to strike soon.
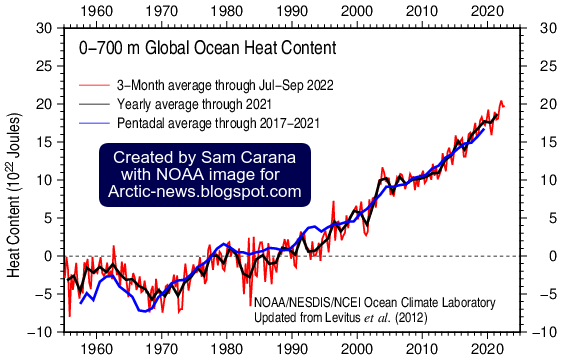
Rising ocean heat causes sea ice to melt from below, resulting in less sea ice, which in turn means that less sunlight gets reflected back into space and more sunlight gets absorbed as heat in the ocean, making it a self-reinforcing feedback loop that further speeds up sea ice loss.
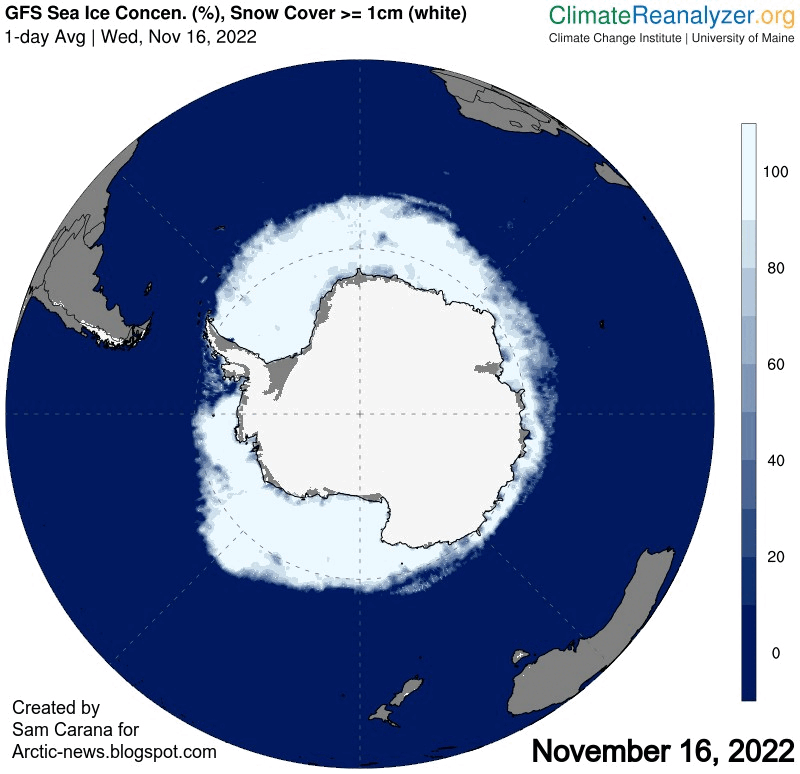
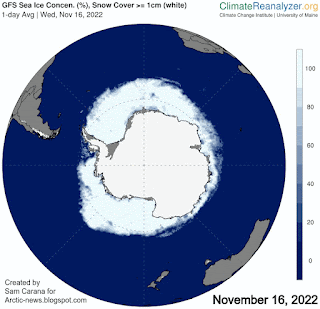 The currently very rapid decline in sea ice concentration around Antarctica is illustrated by the animation of Climate Reanalyzer images on the right, showing Antarctic sea ice on November 16, November 29 and December 15, 2022.
In 2012, a research team led by Jemma Wadham studied Antarctica, concluding that an amount of 21,000 Gt or billion tonnes or petagram (1Pg equals 10¹⁵g) of organic carbon is buried beneath the Antarctic Ice Sheet, as discussed in an earlier post.
In 2012, a research team led by Jemma Wadham studied Antarctica, concluding that an amount of 21,000 Gt or billion tonnes or petagram (1Pg equals 10¹⁵g) of organic carbon is buried beneath the Antarctic Ice Sheet, as discussed in an earlier post.
The potential amount of methane hydrate and free methane gas beneath the Antarctic Ice Sheet could be up to 400 billion tonnes.

The predicted shallow depth of these potential reserves also makes them more susceptible to climate forcing than other methane hydrate reserves on Earth, describes the news release.
“We are sleepwalking into a catastrophe for humanity. We need to take notice right now. It is already happening. This is not a wait-and-see situation anymore," Jemma Wadham said more recently.
The animation on the right shows the thickness of Antarctic sea ice up to December 14, 2022, with 8 days of forecasts added.
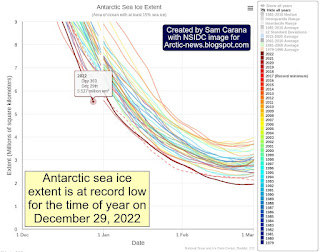

On December 29, 2022, Antarctic sea ice extent was at a record low for the time of the year, at 5.527 million km² (see image on the right).
Recently, a study discovered a process that can contribute to the melting of ice shelves in the Antarctic, as discussed at the ArcticNews group.
Ominously, high concentrations of methane have been recorded over Antarctica recently. The image below shows methane as recorded by the Metop-B satellite on November 28, 2022 pm at 399 mb.

Global sea ice extent was also at a record low for the time of year on December 29, 2022, at 17.53 million km², as illustrated by the image below, by the National Institute of Polar Research, Japan.

The situation is dire and the right thing to do now is to help avoid or delay the worst from happening, through action as described in the Climate Plan.
Links
• NSIDC - Interactive sea ice graph
https://nsidc.org/arcticseaicenews/charctic-interactive-sea-ice-graph
• NOAA - ENSO: Recent Evolution, Current Status and Predictions
https://www.cpc.ncep.noaa.gov/products/analysis_monitoring/lanina/enso_evolution-status-fcsts-web.pdf
• NOAA - ocean heat content
https://www.ncei.noaa.gov/access/global-ocean-heat-content/index.html
• Climate Reanalyzer sea ice concentration
https://climatereanalyzer.org/wx/todays-weather/?var_id=seaice-snowc&ortho=7&wt=1
• Naval Research Laboratory - Antarctic sea ice
https://www7320.nrlssc.navy.mil/GLBhycomcice1-12/antarc.html
• Potential methane reservoirs beneath Antarctica - Press release University of Bristol (2012)
https://www.bristol.ac.uk/news/2012/8742.html
• Potential methane reservoirs beneath Antarctica - by Jemma Wadham et al. (2012)
https://www.nature.com/articles/nature11374
https://www.nature.com/articles/s41467-022-35499-5
• Metop-B satellite readings
• Climate Plan
https://arctic-news.blogspot.com/p/climateplan.html


