The Northern Hemisphere is where most people live. Furthermore, most people live on land. Let's first look at the temperature rise on the Northern Hemisphere.
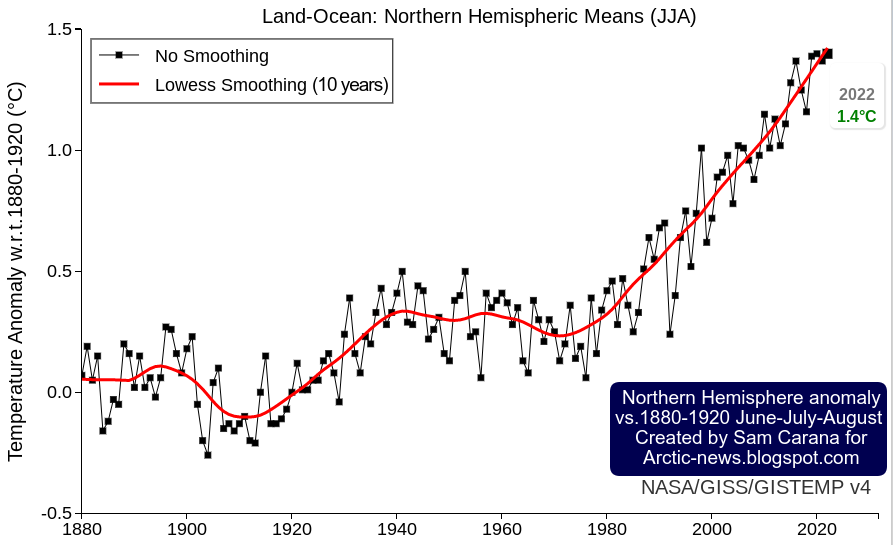
The image below, created with a September 30, 2022 screenshot from NASA customized analysis plots, shows June-July-August temperature anomalies from 1880-1920 on the Northern Hemisphere with June-July-August 2022 highlighted with an anomaly of 1.4°C or 2.52°F, a record high in a tie with 2020.
Secondly, most people live on land. The image below shows the monthly mean global surface temperature anomaly on land. It is similarly created with a September 30, 2022 screenshot from NASA customized analysis plots and shows a peak anomaly from 1880-1920 of 2.95°C or 5.31°F (for February 2016, land only).

In conclusion, the temperature rise on land on the Northern Hemisphere looks set to cross 3°C soon, the more so since we are also facing a peak in sunspots (by 2025), which may coincide with peak temperatures associated with the upcoming El Niño. Also keep in mind that the above temperature anomalies are measured from 1880-1920, so the temperature rise from pre-industrial is significantly higher than that.

There are further events and developments that could additionally speed up the temperature rise, as discussed at the extinction page. Humans are likely to go extinct with a rise of 3°C, as illustrated by the above image, from an analysis discussed in an earlier post.
Methane levels keep rising
The image below, from an earlier post, shows annual global mean methane with a trend added that points at a methane rise that could in 2028 represent a forcing of 780 ppm CO₂e (with a 1-year GWP of 200).
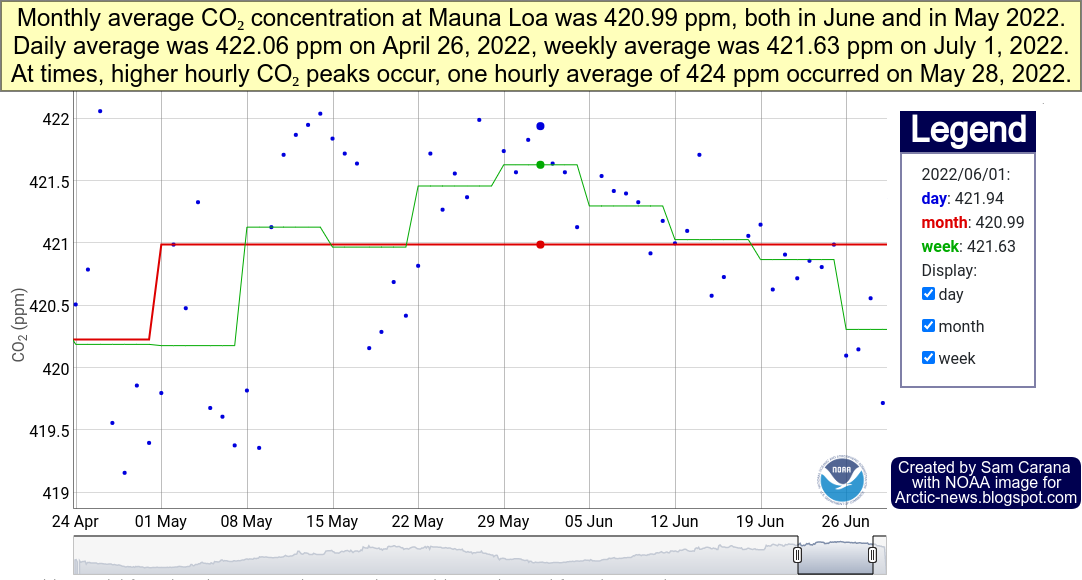
 In other words, the clouds tipping point at 1200 ppm CO₂e could be crossed in 2028 due to the forcing of methane and CO₂ alone, assuming that CO₂ concentration in 2028 will exceed 420 ppm. Moreover, this could happen even earlier, since there are further forcers, while there also are further events and developments that could additionally speed up the temperature rise, as discussed in earlier posts such as this one. Furthermore, the NOAA data used in the above image rise are for marine surface measurements. Methane is accumulating at higher altitude, as illustrated by the compilation images below.
The image below, from an earlier post, shows annual global mean methane with a trend added that points at a methane rise that could in 2028 represent a forcing of 780 ppm CO₂e (with a 1-year GWP of 200).


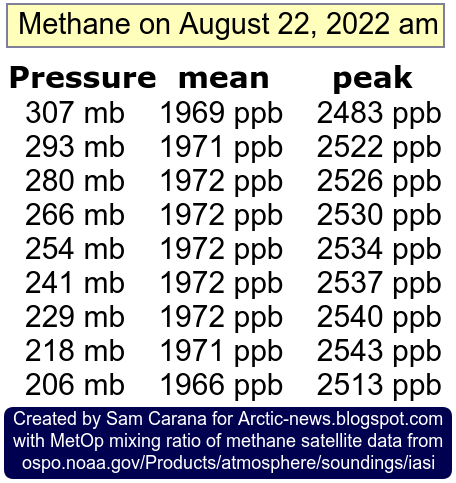
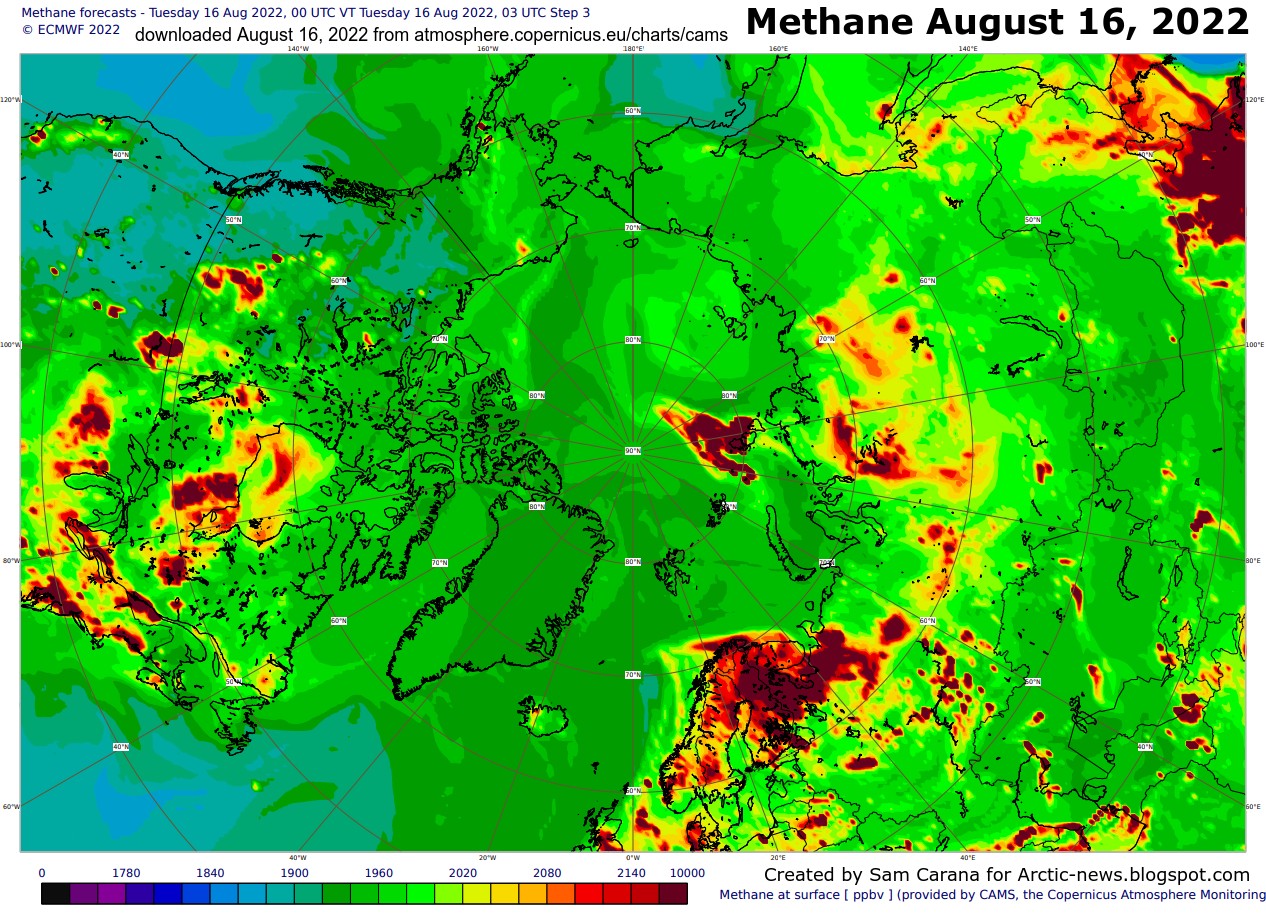
The top image of above compilation image shows that the MetOp-B (also known as MetOp-1) satellite recorded a mean methane concentration of 1979 parts per billion (ppb) at 293 mb on September 30, 2022 pm.
The above compilation image shows high concentrations of methane close to sea level, all the way up to the Tropopause. Does this indicate that methane is rising up from the seafloor of the Arctic Ocean?
 |
| Polar Jet Stream (blue) and Subtropical Jet Stream (red) - NOAA image |
This and the deflection due to the Coriolis force resulted in two Jet Streams forming, circumnavigating the globe in what used to be narrow and straight bands, i.e. the Polar Jet Stream at 60° North and the Subtropical Jet Stream at about 30°, both on the Northern and Southern Hemisphere, resulting in a total of four Jet Streams.
The Jet Stream used to circumnavigate the globe in narrow and straight bands, predominantly following a path from East to West, in line with its strength and with this deflection.
 |
| Polar Jet Stream and Subtropical Jet Stream - NOAA image |
Prevailing wind patterns cause carbon dioxide to accumulate at the poles, as illustrated by the image underneath on the right that shows a high carbon dioxide concentration of 235 ppm over the North Pole.

Some things changed as, due to emissions by people, the difference in temperature between the Arctic and the Tropics narrowed.
This decreases the speed at which heat is moving to the North on the Northern Hemisphere and it deforms the Jet Stream and the prevailing wind patterns, which can make it even more easy for methane that is released from the Arctic Ocean to rise up and accumulate at the Tropopause, and move from there toward the Equator as it rises.
Emissions by people are also causing the Troposhere to expand.
Emissions by people are also causing the Troposhere to expand.
Note the important difference in weight between carbon dioxide and methane. Carbon dioxide tends to accumulate at lower altitudes since it is heavier than air. Methane, on the other hand, is lighter than air, causing methane to rise and accumulate at altitudes near the Tropopause, from where methane moves closer to the Equator, since the Tropopause is higher in altitude at the Tropics than at the Poles.
The accumulation of methane at higher altitudes is further illustrated in the compilation image below that shows that methane mean levels are highest where the troposphere ends over the Arctic.

Links
https://data.giss.nasa.gov/gistemp/graphs_v4/customize.html
• Cataclysmic Alignment
https://arctic-news.blogspot.com/2022/06/cataclysmic-alignment.html
• Sunspots
https://arctic-news.blogspot.com/p/sunspots.html
• Pre-industrial
https://arctic-news.blogspot.com/p/pre-industrial.html
• When will we die?
https://arctic-news.blogspot.com/2019/06/when-will-we-die.html
• Extinction
https://arctic-news.blogspot.com/p/extinction.html
https://arctic-news.blogspot.com/2022/09/blue-ocean-event-2022.html
• Pre-industrial
https://arctic-news.blogspot.com/p/pre-industrial.html
• Pre-industrial
https://arctic-news.blogspot.com/p/pre-industrial.html
• Jet Stream
• nullschool.net
• NOAA - global methane
https://gml.noaa.gov/ccgg/trends_ch4
• Clouds feedback and tipping point
https://arctic-news.blogspot.com/p/clouds-feedback.html
• Sunspots
https://arctic-news.blogspot.com/p/sunspots.html
• MetOp satellite - methane