Dr. Yurganov has released two further images this year, i.e. for December 1-10, 2012 (below left), and for December 11-20, 2012 (below right).

The images show that the highest methane levels show up above the water, as opposed to above land, indicating that methane is being released from the seabed across the Arctic. The images further show that high levels of methane persist in December 2012.
Apart from comparing 10-day periods, we can also look at methane levels for individual days. The NOAA image below shows methane levels up to 2167 ppb on December 27, 2012, for the morning set of measurements.


Pressure levels at which measurements are taken are displayed in hectopascals (symbol hPa) which are numerically equivalent to millibars (mb). A pressure of 600 mb (or hPa) corresponds with an altitude of 13794.9 ft (4204.7 m). By comparison, air pressure at mean sea level is 1013.25 hPa (millibar), or 29.92 inches of mercury.
The map below, from apocalypse4realmethane2012, shows methane measurements taken on the same day (December 27, 2012, morning set), but at 718 mb, which corresponds with an altitude that is a bit closer down to sea level. The map focuses on the Arctic and shows geographic names. If you like, click on the map to enlarge it.

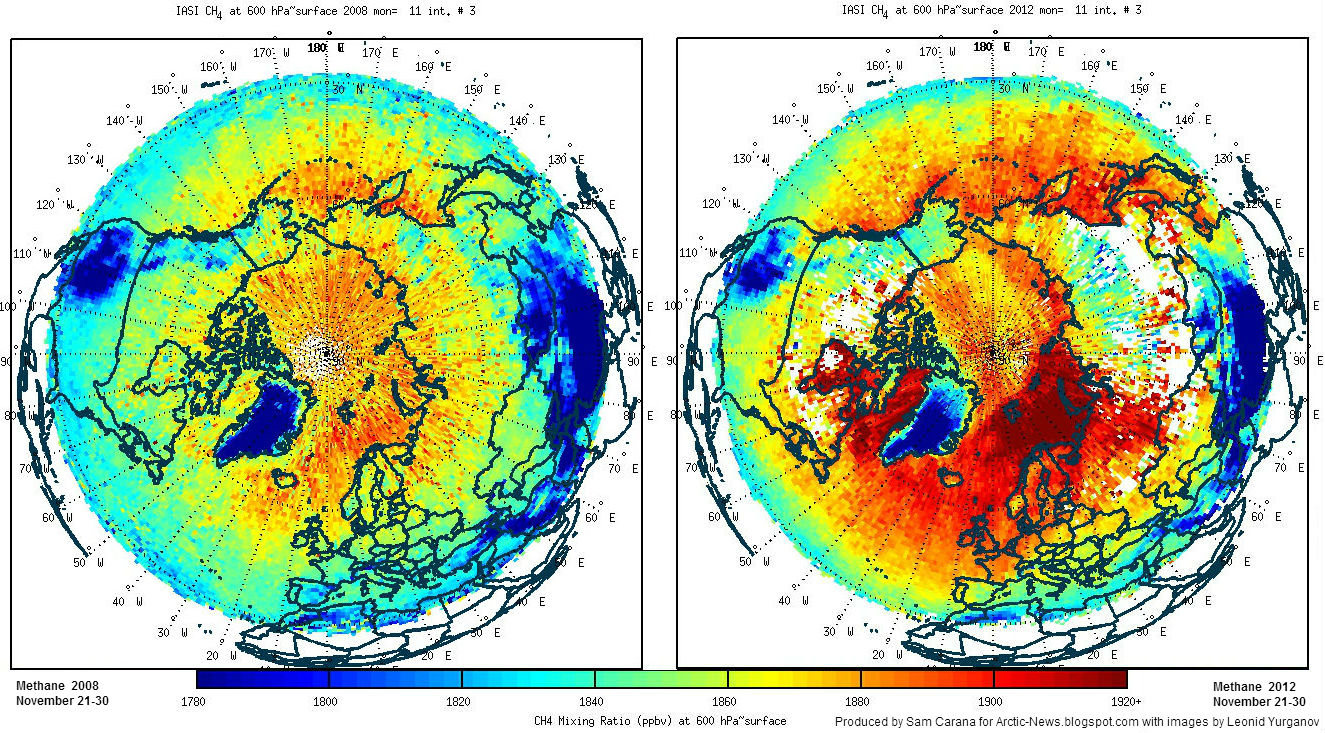
Methane measurements were taken with the IASI (Infrared Atmospheric Sounding Interferometer) instrument, fitted onto the European Space Agencys (ESA) MetOp series of polar orbiting satellites.

For further analysis, the NOAA image with surface temperature anomalies for December 28, 2012, is added above, showing anomalies up to 20 degrees Celsius. Furthermore, the NOAA image with sea surface temperature anomalies for December 27, 2012, is added below, showing anomalies up to 5 degrees Celsius.

5 comments:
Yikes, I need gamers to play game 2C solutions..
Looking at maps of CH4 concentration facts affects
CH4 rise. The game is 2C if Earth can survive and to have best long term outcome for near everyone.
Methane went up in Jan. of 2012. This was especially true over land in Siberia.
The most recent data available at the Cryosphere Today show a record low sea ice area on December 27, 2012, of 10.94949 million sq. km. Only 2010 came close with 10.99332 million sq. km, while all other years recorded over 11 million sq. km for this day of the year.
Methane contributes to this record low in two ways. Firstly, it traps heat in the atmosphere. Furthermore, given that there's so much methane in the atmosphere over the Arctic Ocean, there must additionally be a lot of methane that gets decomposed in the water by methanotrophs. This process generates heat, which warms up the water and makes it more difficult for ice to form.
Sam,
With higher levels of methane being released in marine sediment, could we being seeing another possible positive feedback in the increased decomposition--heat producing--methanotrophs?
Yes, there are a lot of feedbacks; to keep things simple, I've grouped both the above under feedback #2. Methane feedback in the post How to avoid mass-scale death, destruction and extinction, which also includes some human feedback, e.g. farmers slashing and burning forests in response to crop loss caused by climate change.
Post a Comment