This is an extremely high peak. The average daily peak in 2015 until May 1 was 2371 ppb, while the highest daily mean ranged from 1807 ppb (January 10) to 1829 ppb (April 22). Daily peaks and daily highest mean levels in 2015 are shown on the image below.
These peaks are much higher than they were in previous years, as illustrated by the image below, from an earlier post and showing the average highest peak readings in 2013 and 2014 at selected altitudes..
Peak readings in above image are averages over April 2013 and April 2014. On specific days, peak readings could be much higher, e.g. on April 28, 2014, methane levels were recorded as high as 2551 ppb at 469 mb. As said, methane levels as high as 2845 ppb were recorded on April 25, 2015, while the average peak for the first four months of 2015 was 2371 ppb, and this average was calculated from peaks across altitudes.
The table below shows the altitude equivalents in mb (millibar) and feet.
| 56,925 ft | 44,689 ft | 36,850 ft | 30,569 ft | 25,543 ft | 19,819 ft | 14,383 ft | 8,367 ft | 1,916 ft |
| 74 mb | 147 mb | 218 mb | 293 mb | 367 mb | 469 mb | 586 mb | 742 mb | 945 mb |
Peak levels in April appear to be rising strongly each year, following higher peak readings during previous months, especially at higher altitudes, i.e. especially the Arctic Ocean. It appears that much of the additional methane originating from the higher latitudes of the Northern Hemisphere has moved closer to the equator over the past few months, and is now accumulating at higher altitudes over the continents on the Northern Hemisphere, i.e. Asia, Europe, North America and north Africa.
Further analysis of the rise in global mean methane levels appears to confirm the above. The image below shows methane levels on April 22, over three years. While there appears to be little or no rise in mean methane levels at low altitudes, the rise is quite profound at higher altitudes.
 |
| [ click on image to enlarge ] |
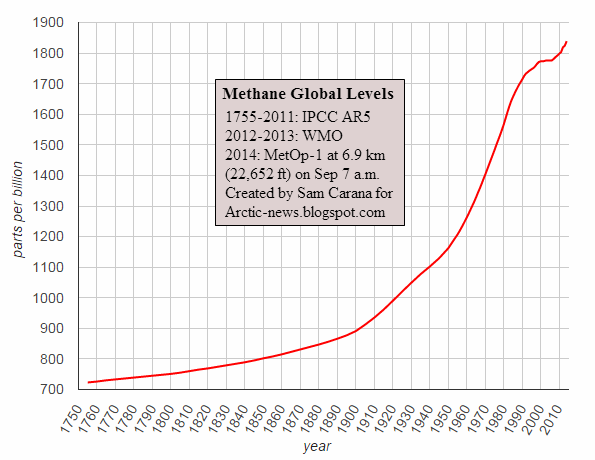
As that post concluded a year ago, it appears that the rise of methane in the atmosphere is accelerating. What can we expect? As temperatures can be expected to continue to rise and as feedbacks start to kick in, this may well constitute a non-linear trend. The image below shows a polynomial trend that is contained in IPCC AR5 data from 1955 to 2011, pointing at methane reaching mean global levels higher than 3000 ppb by the year 2030. If methane starts to erupt in large quantities from clathrates underneath the seafloor of the Arctic Ocean, this may well be where we are heading.
The situation is dire and calls for comprehensive and effective action, as discussed at the Climate Plan.
The 2845 ppb recorded on April 25, 2015, is an extremely high peak. The average daily peak in 2015 until now was 2372...
Posted by Sam Carana on Monday, April 27, 2015


5 comments:
My latest blog post in French :-)
http://leclimatoblogue.blogspot.ca/2015/04/les-previsions-survivables-du-giec-sont.html
I don,t know if you understand French, but if you could please repost in Facbook, I'd surely appreciate
Thank you Sam
And everyone that want to repost it on any social media.
The French also need to know
This is the original post by Nick Breeze, everyone should have a deep look at it
http://www.envisionation.co.uk/index.php/blogs/nick-breeze-blogs/111-survivable-ipcc-projections-are-based-on-science-fiction
Share it wildely please
My next post will either be on Greenland/Anarcttic Ice, or on Methane...
I also want to do a piece on AMOC...
Hello Sam
I just published my newest article on my blog
This time, I decided to take a few major weather events of the last few months and explain how and why the happened, simply enough so that even 10 years old could (hopefully) understand it
Seems from my 1st comment I just received that I reached my goal :-)
This is it, it's a bit lengthty... but it's easy to read for who can read french of course
http://leclimatoblogue.blogspot.ca/2015/05/queleques-evenements-meteo-majeurs-des.html
Thanks again for all your teachings and support
Next one will definitely be on Methane and most of the pics and graphs will come from here with your kind permission.
Have a nice day my friend and mentor
Hello again Sam
I did a short piece on El Niño today translating this https://robertscribbler.wordpress.com/2015/05/06/steaming-equatorial-pacific-sees-winds-blowing-toward-monster-el-nino/
As it was fresh with recent data and not to long, I asked permission to the author to translate and he agreed right away. That's another nice blog I came across after lasts week Radio Ecoshock
Anyhoo, I'm back on methane and I've been trying tto find it's forcing compared to CO2 after 10 years in the Atmosphere and all I found starts at 20...
I tried to find it here, but there's 215 posts on methane (ô^Ô)
Interestingly, I found out that NASA gives it a 105 compared to CO2 forcing over 20 years while almost everyone else comes up with 72...
I also want to address the the shunning of Dr Shakova and her team, the overconfidence in the SpongeBob modeling, AMEG and some more...
So, I'm looking for that 10 years number, and hopefully more details, like 5, 19, 20, 50 years. I think that's about all I need, Most of the rest of the info and pictures will come from here.
Thanks again for your support and make sure you have a nice day.
Jack
See FAQ#13 and methane hydrates.
Thank you very much Sam.
Arctic-News is defenitely the best!
Post a Comment