Saturday, July 3, 2021

A Temperature Rise Of More Than 18 Degrees Celsius By 2026?

On July 1, 2021 pm, the MetOp-1 satellite recorded a mean methane level of 1935 ppb at 293 mb.

[ from earlier post ]
This mean methane level translates into 387 ppm CO₂e at a 1-year Global Warming Potential (GWP) of 200. 

This GWP is appropriate in the light of the danger of a huge burst of methane erupting from the seafloor of the Arctic Ocean, which would, due to the abrupt nature of such an eruption, make its impact felt instantaneously.

Carbon dioxide on July 1, 2021, was 418.33 ppm, as illustrated by the NOAA image below.


Together, this CO₂e level of methane and this carbon dioxide level add up to 805.33 ppm CO₂e, which is 394.67 ppm CO₂e away from the 1200 ppm clouds tipping point which on its own could increase the temperature rise by a further 8°C, as discussed in an earlier post.

This 394.67 ppm CO₂e, again at a 1-year GWP of 200, translates into 1973 ppb of methane. In other words, a methane burst of 1973 ppb or about 5 Gt of methane would suffice to trigger the clouds feedback, adding a further 8°C to the temperature rise, as depicted in the image below. 


A 5 Gt seafloor methane burst would double methane in the atmosphere and could instantly raise the CO₂e level to 1200 ppm and trigger the clouds feedback (top right panel of above chart).

[ from earlier post ]
Even without such a huge eruption of methane from the seafloor, there are further pollutants than just carbon dioxide and methane, such as nitrous oxide, nitrogen oxides, CFCs, carbon monoxide, black carbon, brown carbon and water vapor, and they haven't yet been included in the above CO₂e total. The levels of all these pollutants could rise strongly in a matter of years and feedbacks could start kicking in with much greater ferocity, while the resulting extreme weather events would cause sulfate cooling to end, resulting in an 18.43°C temperature rise that could be reached as early as 2026 (left panel of above chart). 

To further illustrate this, the image on the right shows a trend that is based on NOAA 2006-2020 annual global mean methane data and that points at a mean of 3893 ppb getting crossed by the end of 2026, more than twice the 1935 ppb mean methane level of the image at the top.

Such a high mean methane level by 2026 cannot be ruled out, given the rapid recent growth in mean annual methane levels (15.85 ppb in 2020, see inset on image). And, as said, there are further pollutants, in addition to methane, and additional feedbacks to take into account. 

As discussed in an earlier post, humans will likely go extinct with a 3°C rise, while a 5°C rise will likely end most life on Earth. The temperature rise from pre-industrial to 2020 may well be as large as 2.28°C, as the bottom figure in the bar on the left of above chart shows and as discussed in an earlier post.

Will the IPCC get its act together?

Meanwhile, the IPCC plans to release its next report, the Working Group I contribution to the Sixth Assessment Report (AR6), on August 9, 2021, in the lead up to the COP 26 UN Climate Change Conference, from October 31 to November 12, 2021 in Glasgow, UK. Given their track record, the IPCC and politicians may be reluctant to even consider the information in this post, but it clearly is high time for the IPCC to get its act together. 


The IPCC said, in SR15_FAQ, that the "global temperature is currently rising by 0.2°C (±0.1°C) per decade, human-induced warming reached 1°C above pre-industrial levels around 2017 and, if this pace of warming continues, would reach 1.5°C around 2040." 

Sam Carana: "The temperature rise for the most recent decade (2011-2020) is 0.41°C (NASA data) and the rise from pre-industrial may be 2.28°C, so if this pace continued, 3.11°C could be reached by 2040 and humans will likely go extinct with a 3°C rise. Worse, the rise is accelerating and a rise of as much as 18.43°C could occur by 2026."

Potential temperature rise from pre-industrial to 2026

We face the threat of a potential temperature rise from pre-industrial to 2026 of 18.43°C and the eventual disappearance of all life from Earth, as illustrated by the image below. NASA data shows a 1920-2020 temperature rise of 1.29°C. To calculate the rise from pre-industrial, 0.29°C is added for the 3480 BC-1520 rise, 0.2°C for 1520-1750 and 0.3°C for 1750-1920, while 0.1°C is added to reflect higher polar anomalies and 0.1°C for air temperatures, adding up to a rise of 2.28°C from pre-industrial. A temperature rise of a further 16.15°C could happen by 2026, adding up to a total potential temperature rise of 18.43°C from pre-industrial to 2026. Most species will likely go extinct with a 5°C rise, but humans will likely go extinct with a 3°C rise and eventually, all life would disappear from Earth, as discussed in an earlier post.


In the video below, Guy McPherson comments on the IPCC.


EPA could and should act now

In the US, Joe Biden could simply instruct the EPA to enforce tighter standards. The US supreme court ruled on June 26, 2006, that the EPA has the authority to set standards for greenhouse gas emissions. In 2009, the EPA confirmed that greenhouse gas emissions are pollutants that endanger public health and welfare through their impacts on climate change and admitted that the EPA has the responsibility and the duty to regulate greenhouse gas emissions, and it took until August 3, 2015, for the EPA to issue the Clean Power Plan, giving states a number of choices how to reach set targets for CO₂ emissions. In the light of recent scientific findings and in line with the Paris Agreement, adopted on 12 December 2015, it now makes sense for the EPA to strengthen these targets and enforce this without delay.

Conclusion

The situation is clearly dire and calls for more immediate, more comprehensive and more effective action, as described in the Climate Plan.


Links

• Climate Plan
https://arctic-news.blogspot.com/p/climateplan.html

• Could temperatures keep rising?

• Confirm Methane's Importance
https://arctic-news.blogspot.com/2021/03/confirm-methanes-importance.html

• When Will We Die?
https://arctic-news.blogspot.com/2019/06/when-will-we-die.html

• Overshoot or Omnicide?
https://arctic-news.blogspot.com/2021/03/overshoot-or-omnicide.html

• NASA, Goddard Institute for Space Studies (GISS)
https://data.giss.nasa.gov/gistemp

• IPCC:  Frequently Asked Questions, Special Report on Global Warming of 1.5°C
https://www.ipcc.ch/site/assets/uploads/sites/2/2018/12/SR15_FAQ_Low_Res.pdf

• Possible climate transitions from breakup of stratocumulus decks under greenhouse warming - by Tapio Schneider et al.
https://www.nature.com/articles/s41561-019-0310-1

• Most Important Message Ever
https://arctic-news.blogspot.com/2019/07/most-important-message-ever.html

• Heatwaves and the danger of the Arctic Ocean heating up

• Science Update: Continued IPCC Conservatism and Lies - by Guy McPherson


Monday, June 28, 2021

Heatwaves and the danger of the Arctic Ocean heating up

 Heatwaves and Jet Stream Changes

Heatwaves are increasingly hitting higher latitudes, as illustrated by the forecasts below. The background behind this is that the temperature rise caused by people's emissions is also causing changes to the jet streams. 

[ click on images to enlarge ]

These changes to the Jet Stream are increasingly creating conditions for heatwaves to strike at very high latitudes, as also illustrated by the images on the right.

The first image on the right shows that surface temperatures as high as 48°C or 118.3°F are forecast in the State of Washington for June 30, 2021, at 01:00 UTC, at a latitude of 46.25°N. At the same time, even higher temperatures are forecast nearby at 1000 hPa level (temperatures as high as 119.4°C or 48.6°C). 

The next two images on the right show what happened to the jet stream. One image shows instantaneous wind power density at 250 hPa, i.e. at an altitude where the jet stream circumnavigates the globe, on June 26, 2021 at 11:00 UTC. The image features two green circles. The top green circle marks a location where the jet stream is quite forceful and reaches a speed of 273 km/h or 170 mph. The bottom green circle marks the same location where the 48°C is forecast on June 30, 2021. This shows how heat has been able to move north from as early as June 26, 2021.

The next image on the right shows the situation on June 30, 2021, 04:00 UTC, illustrating how such a jet stream pattern can remain in place (blocked) for several days (in this case for more than five days). The green circle again marks the same location where the 48°C is forecast (in the top image on the right).

This illustrates how a more wavy jet stream can enable high temperatures to rise to higher latitudes, while holding a pattern in place for several days, thus pushing up temperatures over time in the area.  

As said, these changes in the jet stream that are enabling hot air to rise up to high latitudes are caused by global warming. Accelerating warming in the Arctic is causing the temperature difference between the North Pole and the Equator to narrow, which in turn is making the jet stream more wavy.

The next image on the right shows that a UV index reading as high as 12 (extreme) is forecast for a location at 51.56°N in Washington for June 28, 2021, illustrating that such an extreme level of UV can occur at high latitudes, due to changes in the jet stream.

Accelerated Warming in the Arctic


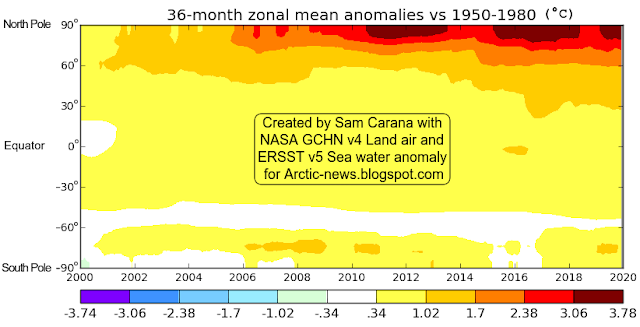
As the temperature rise is accelerating due to people's emissions, it is speeding up more in the Arctic than anywhere else on Earth. 

The Arctic is heating up faster than elsewhere, as numerous feedbacks and tipping points are hitting the Arctic, including:

• Albedo loss goes hand in hand with decline of the snow and ice cover. Albedo is a measure of reflectivity of the surface. Albedo is higher as more sunlight is reflected back upward and less energy is getting absorbed at the surface. Albedo decline can occur as snow and ice disappears and the underlying darker soil and rock becomes exposed. Even when the snow and ice cover remains extensive, its reflectivity can decline, due to cracks and holes in the ice, due to formation of melt ponds on top of the ice and due to changes in texture (melting snow and ice reflects less light). Calving of the ice can take place where warmer water can reach it, and such calving can increase as storms strengthen and waves get larger.

• Furthermore, albedo loss can occur as dust, soot and organic compounds that are caused by human activities get deposited on the snow and ice cover, reducing the reflectivity of the surface. Organic compounds and nutrients in meltwater pools can lead to rapid growth of algae, especially at times of high insolation.

• Latent heat loss. As sea ice gets thinner, ever less ocean heat gets consumed in the process of melting the subsurface ice, to the point where - as long as air temperatures are still low enough - there still is a thin layer of ice at the surface that will still consume some heat below the surface, but that at the same time acts as a seal, preventing heat from the Arctic Ocean to enter the atmosphere.

• Wind changes including changes to the Jet Stream can further amplify the temperature rise in the Arctic. As the temperature difference between the North Pole and the Equator narrows, the Jet Stream becomes more wavy, spreading out widely at times. The changes to the jet stream cause more extreme weather, including heatwaves, forest fires, storms, flooding, etc. This can cause more aerosols to get deposited on the snow and ice cover. Stronger wind and storms over the North Atlantic can also speed up the flow of warm water into the Arctic Ocean.

Albedo loss, latent heat loss and changes to wind patterns can dramatically amplify the temperature rise in the Arctic. The temperature of the Arctic Ocean is rising accordingly, while there are a number of developments and events that specifically speed up the temperature rise of the water of the Arctic Ocean, as discussed below.


Arctic Ocean heating up

The temperature of the water of the Arctic Ocean is rising, due to a number of events and developments:
                 [ from the insolation page ]
  • Solstice occurred on June 21, 2021. The Arctic is now receiving huge amounts of sunlight (see image on the right, from the insolation page).

  • Sea surface temperatures and temperatures on land are very high in Siberia, Canada and Alaska. Strong winds can spread warm air over the Arctic Ocean.

  • Arctic sea ice extent is low for the time of year, but at this stage, there still is a lot of sea ice present (compared to September). The sea ice acts as a seal, preventing ocean heat from entering the atmosphere, resulting in more heat remaining in the Arctic Ocean.

[ Lena River, Siberia ]

  • Warm water from rivers is flowing into the Arctic Ocean, carrying further heat into the Arctic Ocean. Above image shows that on June 23, 2021, sea surface temperatures were 22.3°C or 72.2°F at a spot where water from the Lena River flows into the Arctic Ocean. The image on the right shows that at a nearby location the sea surface temperature was 20°C or 36°F higher than 1981-2011. 

  • Warm water from the North Atlantic Ocean and the North Pacific Ocean is flowing into the Arctic Ocean and the amount of ocean heat flowing into the Arctic Ocean is rising each year.

  • As mentioned above, latent heat loss is contributing to the rapid temperature rise in the Arctic. The remaining sea ice acts as a buffer, consuming ocean heat from below. Sea ice is getting thinner each year, so ever less ocean heat can get consumed in the process of melting the sea ice from below.

  • Changes to the jet stream can also cause strong storms to dramatically speed up the amount of heat flowing into the Arctic Ocean, as discussed at the Cold freshwater lid on North Atlantic page.

The danger of the temperature rise of the Arctic Ocean

The danger of the temperature rise of the Arctic Ocean is that it can cause destabilization of hydrates at its seafloor, resulting in eruption of huge amounts of methane from hydrates and from free gas underneath the hydrates.

[ The Buffer has gone, feedback #14 on the Feedbacks page ]

In conclusion, changes to the jet stream could cause a huge temperature rise soon, while a 3°C rise could cause humans to go extinct, which is a daunting prospect. Even so, the right thing to do is to help avoid the worst things from happening, through comprehensive and effective action as described in the Climate Plan.

• Insolation

• Cold freshwater lid on North Atlantic

• Most Important Message Ever
https://arctic-news.blogspot.com/2019/07/most-important-message-ever.html

• Could temperatures keep rising?

• Latent Heat


Sunday, June 20, 2021

The climate change runaway chain reaction-like process

Amplifying feedbacks leading to accelerated planetary temperatures

by Andrew Glikson

“The paleoclimate record shouts to us that, far from being self-stabilizing, the Earth's climate
system is an ornery beast which overreacts even to small nudges” (Wally Broecker)


Many climate change models, including by the IPCC, appear to minimize or even neglect the amplifying feedbacks of global warming, which are pushing temperatures upward in a runaway chain reaction-like process, as projected by Wally Broecker and other:

These feedbacks drive a chain reaction of events, accelerating the warming, as follows:

  1. Melting snow and ice expose dark rock surfaces, reducing the albedo of the polar terrains and sea ice in surrounding oceans, enhancing infrared absorption and heating.
  2. Fires create charred low-albedo land surfaces.
  3. An increase in evaporation raises atmospheric vapor levels, enhancing the greenhouse gas effect.
  4. Whereas an increase in plant leaf area enhances photosynthesis and evapotranspiration, creating a cooling effect, the reduction in vegetation in darkened burnt areas works in the opposite direction, warming land surfaces.
Figure 1. The 2021 global climate trends (Hansen, 2021, by permission)

The current acceleration of global warming is reflected by the anomalous rise of temperatures, in particular during 2010-2020 (Hansen 2021, Figure 1 above). Consequently, extensive regions are burning, with 4 to 5 million fires per year counted between about 2004 and 2019. In 2021, global April temperatures are much less than in 2020, due to a moderately strong La Nina effects.
Figure 2. The Palaeocene-Eocene Thermal Maximum recorded by benthic plankton isotopic data from sites in the Antarctic, south Atlantic and Pacific (Zachos et al., 2003). The rapid decrease in oxygen isotope ratios is indicative of a large increase in atmospheric temperatures associated with a rise in greenhouse gases CO₂ and CH₄ signifies approximately +5°C warming.

A runaway climate chain reaction-like process triggered by release of methane is believed to have occurred during the Paleocene-Eocene thermal maximum (PETM), about 55 million years ago (Figures 2 above and 3A below).

Analogies between Anthropocene climate change and major geological climate events reveal the rate of current rise in greenhouse gas levels and temperatures as compared to major geological warming events is alarming. A commonly cited global warming event is the Paleocene-Eocene boundary thermal maximum (PETM) at 55 Ma-ago, reaching +5 degrees Celsius and over 800 ppm CO₂ within a few thousand years (Figures 2 above and 3A below).

Figure 3. (A) Simulated atmospheric CO₂ at and following the Palaeocene-Eocene boundary (after Zeebe et al., 2009);
(B) Global CO₂ and temperature during the last glacial termination (After Shakun et al., 2012) (LGM - Last Glacial Maximum; OD – Older dryas; BA - Bølling–Alerød; YD - Younger dryas). Glikson (2020).

The definitive measure of Anthropocene global warming, i.e. the rise in the atmospheric concentration of CO₂, to date by 49 percent since pre-industrial time (from 280 ppm to currently 419 ppm), is only rarely mentioned by the media or politicians. Nor are the levels of methane and nitrous oxide, which have risen by about 3-fold. To date potential attempts toward climate mitigation and adaptation have failed. There is a heavy price in communicating distressing projections, Cassandra-like, where climate scientists have been threatened, penalized or dismissed, including from major institutions

The triggering of a mass extinction event by the activity of organisms is not unique to the Anthropocene. The end Permian mass extinction, the greatest calamity for life in geologic history, is marked in marine carbonates by a negative δ¹³C shift attributed to oceanic anoxia and the emission of methane (CH₄) and hydrogen sulphide (H₂S) related to the activity of methanogenic algae (“purple” and “green” bacteria) (Ward, 2006; Kump, 2011). As a corollary anthropogenic climate change constitutes a geological/biological process where the originating species (Homo sapiens) has not to date discovered an effective method of controlling the calamitous processes it has triggered.


Andrew Glikson
A/Prof. Andrew Glikson

Earth and Paleo-climate scientist
The University of New South Wales,
Kensington NSW 2052 Australia


Books:
The Asteroid Impact Connection of Planetary Evolution
http://www.springer.com/gp/book/9789400763272
The Archaean: Geological and Geochemical Windows into the Early Earth
http://www.springer.com/gp/book/9783319079073
Climate, Fire and Human Evolution: The Deep Time Dimensions of the Anthropocene
http://www.springer.com/gp/book/9783319225111
The Plutocene: Blueprints for a Post-Anthropocene Greenhouse Earth
http://www.springer.com/gp/book/9783319572369
Evolution of the Atmosphere, Fire and the Anthropocene Climate Event Horizon
http://www.springer.com/gp/book/9789400773318
From Stars to Brains: Milestones in the Planetary Evolution of Life and Intelligence
https://www.springer.com/us/book/9783030106027
Asteroids Impacts, Crustal Evolution and Related Mineral Systems with Special Reference to Australia
http://www.springer.com/us/book/9783319745442
The Event Horizon: Homo Prometheus and the Climate Catastrophe
https://www.springer.com/gp/book/9783030547332


Links image top

• Seasonal origin of the thermal maxima at the Holocene and the last interglacial - by Samantha Bova et al. (2021)
https://www.nature.com/articles/s41586-020-03155-x

• Could temperatures keep rising? - by Sam Carana (2021)
• Blueprints of future climate trends - by Andrew Glikson (2018)
https://arctic-news.blogspot.com/2019/09/blueprints-of-future-climate-trends.html

• Global warming preceded by increasing carbon dioxide concentrations during the last deglaciation - by Jeremy Shakun (2012)
https://www.nature.com/articles/nature10915

• The Last Great Global Warming - by Lee Kump (2011)
https://www.scientificamerican.com/article/the-last-great-global-warming

Sunday, June 13, 2021

Could temperatures keep rising?

Orbital changes are responsible for Milankovitch cycles that make Earth move in and out of periods of glaciation, or Ice Ages. Summer insolation on the Northern Hemisphere reached a peak some 10,500 years ago, in line with the Milankovitch cycles, and insolation has since gradually decreased.
Summer insolation on the Northern Hemisphere in red and in langleys
per day (left axis, adapted from Walker, 2008). One langley is 1 cal/cm²
(thermochemical calorie per square centimeter), or 41840 J/m² (joules
per square meter), or about 11.622 Wh/m² (watt-hours per square meter). 
In blue is the mean annual sea surface temperature, given as the difference
from the temperature over the last 1000 years (right axis, from Bova, 2021).

Snow and ice cover acting as a buffer

While temperatures rose rapidly, especially before the insolation peak was reached, the speed at which temperatures rose was moderated by the snow and ice cover, in a number of ways:
  • snow and ice cause sunlight to get reflected back into space
  • energy from sunlight is consumed in the process of melting snow and ice, and thawing permafrost
  • meltwater from sea ice and runoff from melting glaciers and thawing permafrost cools oceans.
In other words, the snow and ice cover acted as a buffer, moderating the temperature rise. While this buffer has declined over time, it is still exercizing this moderation today, be it that the speed at which this buffer is reducing in size is accelerating, as illustrated by the image below, showing the rise of the sea surface temperature on the Northern Hemisphere.

[ from earlier post ]

Will the snow and ice cover ever grow back?

More recently, the temperature rise has been fueled by emissions caused by people. While emission of greenhouse gases did rise strongly since the start of the Industrial Revolution, the rise in emission of greenhouse gases by people had already started some 7,000 years ago with the rise in modern agriculture and associated deforestation, as illustrated by the image below, based on Ruddiman et al. (2015).


The temperature has risen accordingly since those times. At the start of the Industrial Revolution, as the image at the top shows, temperatures already had risen significantly, compared to some 6000 years before the Industrial Revolution started. When also taking into account that the temperature would have fallen naturally (i.e. in the absence of these emissions), the early temperature rise caused by people may well be twice as much.

Temperatures could keep rising for many years, for a number of reasons:
  • Snow & Ice Cover Loss - A 2016 analysis by Ganapolski et al. suggests that even moderate anthropogenic cumulative carbon dioxide emissions would cause an absence of the snow and ice cover in the next Milankovitch cycle, so there would be no buffer at the next peak in insolation, and temperatures would continue to rise, making the absence of snow and ice a permanent loss.
  • Brighter Sun - The sun is now much brighter than it was in the past and keeps getting brighter.
  • Methane - Due to the rapid temperature rise, there is also little or no time for methane to get decomposed. Methane levels will skyrocket, due to fires, due to decomposition of dying vegetation and due to releases from thawing of terrestrial permafrost and from the seafloor as hydrates destabilize.
  • No sequestration - The rapidity of the rise in greenhouse gases and of the associated temperature rise leaves species little or no time to adapt or move, and leaving no time for sequestration of carbon dioxide by plants and by deposits from other species, nor for formation of methane hydrates at the seafloor of oceans.
  • No weathering - The rapidity of the rise also means that weathering doesn't have a chance to make a difference. Rapid heating is dwarfing what weathering can do to reduce carbon dioxide levels. 
  • Oceans and Ozone Layer Loss - With a 3°C rise, many species including humans will likely go extinct. A 2013 post warned that, with a 4°C rise, Earth will enter a moist-greenhouse scenario. A 2018 study by Strona & Bradshaw indicates that most life on Earth would disappear with a 5°C rise. As temperatures kept rising, the ozone layer would disappear and the oceans would keep evaporating and eventually disappear into space, further removing elements and conditions that are essential to sustain life on Earth.

Paris Agreement

All this has implications for the interpretation of the Paris Agreement. At the Paris Agreement, politicians pledged to take efforts to ensure that the temperature will not exceed 1.5°C above pre-industrial levels.

So, what is pre-industrial? To calculate how much the temperature has risen, let's start at 2020 and go back one century. According to NASA data, the temperature difference between 1920 and 2020 is 1.29°C (image below). 


The NASA ocean data are for sea surface temperatures, so another 0.10°C can be added to obtain global air near surface temperatures (2 m). Furthermore, it makes sense to add another 0.10°C for higher polar anomalies. This would bring the temperature rise from 1920 up to 1.49°C.  


Of course, 1920 is not pre-industrial. As the IPCC mentions, the 'pre-' in pre-industrial means 'before', implying that 'pre-industrial' refers to levels as they were in times well befóre (as opposed to when) the Industrial Revolution started.

When taking the rise over the past century and adding 0.30°C for the rise over the previous 170 years, that brings the rise up to 1.79°C (from ≈1750, the start of the Industrial Revolution). Carbon dioxide and methane levels started to rise markedly about 6000 years ago, causing a 0.29°C rise for the years from 3480 BC to 1520 (see image at top). Finally, there will also have been a rise for the years from 1520 to 1750 that, when estimated at 0.20°C, would mean that emissions by people could have caused the temperature to rise by 2.28°C (4.122°F), compared to the temperature some 5500 years ago (see inset on above image).

A huge temperature rise by 2026?

A recent post suggests that the 1.5°C threshold was already crossed in 2012, i.e. well before the Paris Agreement was adopted by the U.N. (in 2015), while there could be a temperature rise of more than 3°C by 2026.

Such a rise could be facilitated by a number of events and developments, including:

[ from earlier post see CH4 GWP]
• The Arctic sea ice latent heat tipping point and the seafloor methane hydrates tipping point look set to get crossed soon (see above image).

• Continued emissions. Politicians are still refusing to take effective action, even as greenhouse gas emissions appear to be accelerating. The warming impact of carbon dioxide reaches its peak a decade after emission, while methane's impact over a few years is huge.

• Sunspots. We're currently at a low point in the sunspot cycle. As the image on the right shows, the number of sunspots can be expected to rise as we head toward 2026, and temperatures can be expected to rise accordingly. According to James Hansen et al., the variation of solar irradiance from solar minimum to solar maximum is of the order of 0.25 W/m⁻².

• Temperatures are currently also suppressed by sulfate cooling, and their impact is falling away as we progress with the necessary transition away from fossil fuel and biofuel, toward the use of more wind turbines and solar panels instead. Aerosols typically fall out of the atmosphere within a few weeks, so as the transition progresses, this will cause temperatures to rise over the next few years.

• El Niño events, according to NASA, occur roughly every two to seven years. As temperatures keep rising, ever more frequent strong El Niño events are likely to occur. NOAA anticipates the current La Niña to continue for a while, so it's likely that a strong El Niño will occur between 2023 and 2025.

• Rising temperatures can cause growth in sources of greenhouse gases and a decrease in sinks, as discussed in an earlier post.

The mass extinction event that we are currently in is rapidly progressing, even faster than the Great Permo-Triassic Extinction, some 250 million years ago, when the temperature rose to about 28°C, i.e. some 14.5°C higher than pre-industrial.

In the video below, Guy McPherson discusses the current mass extinction.


In the video below, Ye Tao introduces and discusses the MEER ReflEction idea.


In conclusion, there could be a huge temperature rise by 2026 and with a 3°C rise, humans will likely go extinct, which is a daunting prospect. Even so, the right thing to do is to help avoid the worst things from happening, through comprehensive and effective action as described in the Climate Plan.


Links

• Climate change and ecosystem response in the northern Columbia River basin - A paleoenvironmental perspective - by Ian R. Walker and Marlow G. Pellat (2008)
https://cdnsciencepub.com/doi/10.1139/A08-004

• Vance, R.E. 1987. "Meteorological Records of Historic Droughts as Climatic Analogues for the Holocene." In N.A. McKinnon and G.S.L. Stuart (eds), Man and the Mid-Holocene Climatic Optimum - Proceedings of the Seventeenth Annual Conference of the Archaeological Association of the University of Calgary. The University of Calgary Archaeological Association, Calgary: 17-32.

• Seasonal origin of the thermal maxima at the Holocene and the last interglacial - by Samantha Bova et al. (2021)
https://www.nature.com/articles/s41586-020-03155-x

• Palaeoclimate puzzle explained by seasonal variation (2021)
https://www.nature.com/articles/d41586-021-00115-x

• Important Climate Change Mystery Solved by Scientists (news release 2021)
https://www.rutgers.edu/news/important-climate-change-mystery-solved-scientists

• Milankovitch (Orbital) Cycles and Their Role in Earth's Climate - by Alan Buis (NASA news, 2020)
https://climate.nasa.gov/news/2948/milankovitch-orbital-cycles-and-their-role-in-earths-climate

• Milankovitch cycles - Wikipedia
https://en.wikipedia.org/wiki/Milankovitch_cycles

• Insolation changes
https://energyeducation.ca/encyclopedia/Insolation
http://www.geo.umass.edu/faculty/bradley/bradley2003x.pdf

• Late Holocene climate: Natural or anthropogenic? - by William Ruddiman et al. (2015)
https://agupubs.onlinelibrary.wiley.com/doi/full/10.1002/2015RG000503

• Critical insolation–CO2 relation for diagnosing past and future glacial inception - by Andrey Ganapolski et al. (2016)
https://www.nature.com/articles/nature16494

• Co-extinctions annihilate planetary life during extreme environmental change - by Giovanni Strona & Corey Bradshaw (2018)

• Earth is on the edge of runaway warming
https://arctic-news.blogspot.com/2013/04/earth-is-on-the-edge-of-runaway-warming.html

• Paris Agreement
https://unfccc.int/process-and-meetings/the-paris-agreement/the-paris-agreement
https://unfccc.int/sites/default/files/english_paris_agreement.pdf

• IPCC Special Report: Global warming of 1.5 ºC — Box SPM.1: Core Concepts 
https://www.ipcc.ch/sr15/chapter/spm/

• IPCC AR5 Synthesis Report — Figure 2.8
https://www.ipcc.ch/report/ar5/syr/synthesis-report

• IPCC AR5 Report, Summary For Policymakers
https://www.ipcc.ch/site/assets/uploads/2018/02/WG1AR5_SPM_FINAL.pdf

• NASA Analysis Graphs and Plots - LSAT and SST change

• Most Important Message Ever
https://arctic-news.blogspot.com/2019/07/most-important-message-ever.html

• Radiative forcing of carbon dioxide, methane, and nitrous oxide: A significant revision of the methane radiative forcing - by M. Etminan et al.
https://agupubs.onlinelibrary.wiley.com/doi/full/10.1002/2016GL071930

• When Will We Die?
https://arctic-news.blogspot.com/2019/06/when-will-we-die.html

• Possible climate transitions from breakup of stratocumulus decks under greenhouse warming - by Tapio Schneider et al.
https://www.nature.com/articles/s41561-019-0310-1

• A World Without Clouds
https://www.quantamagazine.org/cloud-loss-could-add-8-degrees-to-global-warming-20190225

• How close are we to the temperature tipping point of the terrestrial biosphere? - by Katharyn Duffy et al.

• What Carbon Budget?


Thursday, June 3, 2021

Greenhouse gas levels keep rising at accelerating rates

At the Paris Agreement in 2015, politicians pledged to limit the global temperature rise from pre-industrial levels to 1.5°C and promised to stop rises in greenhouse gas emissions as soon as possible and to make rapid reductions in accordance with best available science, to achieve a balance between people's emissions by sources and removals by sinks of greenhouse gases in the second half of this century. 

Yet, greenhouse gas levels keep rising and the rise appears to be accelerating. 

Carbon Dioxide

The annual mean global growth rate of carbon dioxide (CO₂) has been increasing over the years (see above image). The February 2021 global CO₂ level was 2.96 ppm higher than the February 2020 global CO₂ level (image left).
The March 2021 global CO₂ level was 2.89 ppm higher than the March 2020 global CO₂ level (image left), again much higher than the average annual growth rate over the past decade. No discernible signal in the data was caused by restrictions associated with the COVID-19 pandemic.

More recent values are available for Mauna Loa, Hawaii. As the image on the right shows, the monthly average CO₂ level at Mauna Loa was 419.13 ppm for May 2021, while the weekly average was as high as 420.01 ppm (for the week ending at May 1, 2021). 

On April 8, 2021, CO₂ levels at Mauna Loa, Hawaii, reached a level of 421.36 ppm, while several hourly averages recorded in early April were approaching 422 ppm (see earlier post).

According to NOAA, the atmospheric burden of CO₂ is now comparable to where it was during the Pliocene Climatic Optimum, between 4.1 and 4.5 million years ago, when CO₂ was close to, or above 400 ppm. During that time, the average temperature was about 4°C (7°F) higher than in pre-industrial times, and sea level was about 24 m (78 feet) higher than today.

Methane
 
The 2020 global annual methane (CH₄) growth rate of 15.85 ppb was the highest on record. The global CH₄ level in January 2021 was 1893.4 ppb, 20 ppb higher than the January 2020 level. 

The image at the top shows a trend indicating that CH₄ could reach a level of 4000 ppb in 2026, which at a 1-year GWP of 200 translates into 800 ppm CO₂e, so just adding this to the current CO₂ level would cause the Clouds Tipping Point at 1200 CO₂e to be crossed, which in itself could raise global temperatures by 8°C, as described in an earlier post

Nitrous Oxide

The 2020 global annual nitrous oxide (N₂O) growth rate of 1.33 ppb was the highest on record. The global N₂O level in January 2021 was 333.9 ppb, 1.4 ppb higher than the January 2020 level. 

Greenhouse gas levels are accelerating, despite promises by politicians to make dramatic cuts in emissions. As it turns out, politicians have not taken the action they promised they would take. 

Of course, when also adding nitrous oxide, the Clouds Tipping Point can get crossed even earlier.

Elements contributing to temperature rise

Next to rising greenhouse gas levels, there are further elements that can contribute to a huge temperature rise soon. 


As illustrated by above image by Nico Sun, the accumulation of energy going into melting the sea ice is at record high for the time of year. 


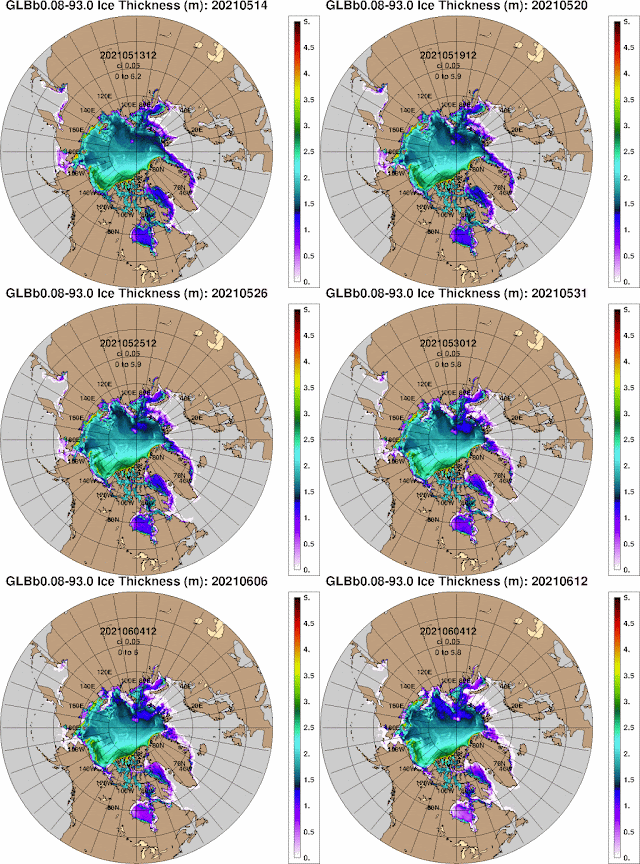
As illustrated by above combination image, the thickness of the sea ice is now substantially less than it used to be. The image compares June 1, 2021 (left), with June 1, 2015 (right). 

The animation on the right shows that sea ice is getting rapidly thinner, indicating that the buffer constituted by the sea ice underneath the surface is almost gone, meaning that further heat entering the Arctic Ocean will strongly heat up the water.

As described in an earlier post, this can destabilizate methane hydrates in sediments at the seafloor of the Arctic Ocean, resulting in eruption of methane from these hydrates and from methane that is located in the form of free gas underneath such hydrates. 

Such methane eruptions will first of all heat up the Arctic, resulting in loss of Arctic sea ice's ability to reflect sunlight back into space (albedo feedback), in disappearing glaciers and in rapidly thawing terrestrial permafrost (and the associated release of greenhouse gases).

The Snowball Effect


Temperatures are rising and they are rising at accelerating pace, especially in the Arctic. A strong El Niño and a distortion in the jet stream could cause the latent heat and methane hydrates tipping points to be crossed soon, causing many feedbacks to kick in with ever greater ferocity, and pushing up the global temperature beyond 3°C, 4°C and 5°C above pre-industrial, like a snowball that keeps growing in size while picking up ever more snow, as it is racing down a very steep slope.

Crossing of tipping points and further events and developments can combine with feedbacks into a snowball effect of rapidly rising temperatures.

Feedbacks include changes to the Jet Stream that result in ever more extreme weather events such as storms and forest fires. Such events can cause huge emissions of greenhouse gases. 

Temperatures can also be expected to rise over the next few years as sulfate cooling decreases. Aerosols can further cause additional warming if more black carbon and brown carbon gets emitted due to more wood getting burned and more forest fires taking place. Black carbon and brown carbon have a net warming effect and can settle on snow and ice and speed up their decline.

Therefore, the 8°C rise as a result of crossing the Clouds Tipping Point would come on top of the warming due to other elements, and the total rise could be as high as 18°C or 32.4°F from preindustrial, as ilustrated by the image on the right, from an earlier post.

Very high sea surface temperature anomalies

Meanwhile, sea surface temperatures on the Northern Hemisphere keep rising. The image below shows that sea surface temperature anomalies off the North American east coast (at the green circle) were as high as as 13.7°C (24.7°F) on June 3, 2021.


More heat is flowing from the tropics along the North American east coast toward the Arctic Ocean, carried by the Gulf Stream, as illustrated by the image on the right. 

In conclusion, there could be a huge temperature rise by 2026. 

At a 3°C rise, humans will likely go extinct, making it from some perspectives futile to speculate about what will happen beyond 2026. 

Even so, the right thing to do is to help avoid the worst things from happening, through comprehensive and effective action as described in the Climate Plan.


• NOAA: Trends in Greenhouse gases
https://gml.noaa.gov/ccgg/trends

• NOAA: Carbon dioxide peaks near 420 parts per million at Mauna Loa observatory

• Overshoot or Omnicide?
• Cryosphere Computing - by Nico Sun
https://cryospherecomputing.tk

• Arctic Ocean invaded by hot, salty water

• Most Important Message Ever
https://arctic-news.blogspot.com/2019/07/most-important-message-ever.html