Monday, September 4, 2023

Too late? The climate and nuclear juggernaut

The Bulletin's Doomsday Clock


by Andrew Glikson

will ’sapiens’ end up on the beach?


Under the guise of lies and cover-ups, the global powers to be have set the stage for the unthinkable, a world-wide hair-trigger human suicide system taking much of nature with it. With the exception of abstract ideas or experimental attempts, no actual steps are being taken to slow down, or even reverse, the inexorable rise of atmospheric greenhouse gases, now rising into Miocene-like levels of >400 parts per million CO₂ within the century, the fastest rise rate identified in the geological record.

Nor are steps undertaken to try and dismantle the global doomsday fleet of more than 12,700 nuclear warheads, where space and the oceans have become nuclear playgrounds, enough to render large parts of the Earth uninhabitable.

The criminal insanity of political, military, strategic, economic and scientific leaders, matched only by the naive blindness of billions of people, is consistent with what has been referred to as the ‘Fermi Paradox’ ─ the apparent absence of signals from technological civilizations in the Milky Way, interpreted in terms of a self-destruction of such civilizations.

Even at this stage, the litany of denial and betrayal never stops. Political leaders who have vowed to adhere to the science, shift to promote the mining and export of fossil fuels, as if greenhouse gases do not disperse in the atmosphere world-wide, or they adopt nuclear weaponry, as soon as they reach power. A suicidal element in human nature?

While the multitudes are fixated on domestic issues and regional troubles, including genocidal conflicts and in corners of the world (Ukraine, Chechnya, Korea, Vietnam, Cambodia, Laos, Mein-Mar, Iraq, Syria, Afghanistan, Yemen, and other), the price of maintaining an Orwellian ‘peace and stability ’, including ethnic cleansing, drowning refugees, economic hardships, misanthropic violence, football games, the tour de France, tennis rackets, relatively few are concerned with the deadly games of empire. Even symbolic gestures toward original people, like the “Voice” are being objected to.

Arnold Böcklin, Self-portrait with Death playing the fiddle (1872)
As in the history of Athens and Sparta, the stronger force is more inclined to start a war. Like schoolboys seeking association with bully alpha males, so do weaker nations look for the protection of an empire, which ends up using them as cannon fodder. 

It is more difficult to understand why, given the scientific and empirical evidence of global heating, intelligent people are prepared to sacrifice the future of their off-springs generations to the $multi-trillion fossil fuel industry and their advocates in governments. 

It would appear that, once representatives acquire real or apparent power, they leave conscience behind, adopting the Faustian bargain (Deal with the devil, image right).

Where does responsibility lie? Where humans are caught up in the anthropogenic genome, not enough “good” angels exist. Where competition for food, shelter and reproduction are inherent, ethics, compassion and empathy may not be easy to find. Humanity may be more readily detected among small tribes than in large civilizations. A young child born in a bubble has few or no impressions impinging on its brain to respond to. By contrast children exposed to obscene violence and lies paraded on fluorescent screens are more likely to grow into distorted brain-washed multitudes.
Greta Thunberg

But perhaps the most lethal human branch has become the media, which with few exceptions turned into a global propaganda machine skilful in distorting facts, promoting conflicts, manufacturing untruths, concealing avenues to peace and promoting wars in the tradition of Goebbels.

Surprisingly, the only significant resistance to the genocidal behaviour of alpha male-dominated groups has arisen from the not-yet spoiled minds of children, led by the young Greta Thunberg.


A/Prof. Andrew Y Glikson
Earth and Paleo-climate scientist

Andrew Glikson
Books:
The Asteroid Impact Connection of Planetary Evolution
https://www.springer.com/gp/book/9789400763272
The Archaean: Geological and Geochemical Windows into the Early Earth
https://www.springer.com/gp/book/9783319079073
The Plutocene: Blueprints for a Post-Anthropocene Greenhouse Earth
https://www.springer.com/gp/book/9783319572369
The Event Horizon: Homo Prometheus and the Climate Catastrophe
https://www.springer.com/gp/book/9783030547332
Climate, Fire and Human Evolution: The Deep Time Dimensions of the Anthropocene
https://www.springer.com/gp/book/9783319225111
Evolution of the Atmosphere, Fire and the Anthropocene Climate Event Horizon
https://www.springer.com/gp/book/9789400773318
From Stars to Brains: Milestones in the Planetary Evolution of Life and Intelligence
https://www.springer.com/us/book/9783030106027
Asteroids Impacts, Crustal Evolution and Related Mineral Systems with Special Reference to Australia
https://www.springer.com/us/book/9783319745442
The Fatal Species: From Warlike Primates to Planetary Mass Extinction
https://www.springer.com/gp/book/9783030754679
The Trials of Gaia. Milestones in the evolution of Earth with reference to the Antropocene
https://www.amazon.com.au/Trials-Gaia-Milestones-Evolution-Anthropocene/dp/3031237080




Sunday, August 20, 2023

High Wet Bulb Globe Temperatures hit the US again

Temperatures are high

Globally, temperatures have been at record high levels for the time of year for some time in 2023, as illustrated by the image below, adapted from Climate Reanalyzer. 


On August 25, 2023, the world temperature was 16.99°C, 0.94°C higher than it was on that day in 1979-2000. 

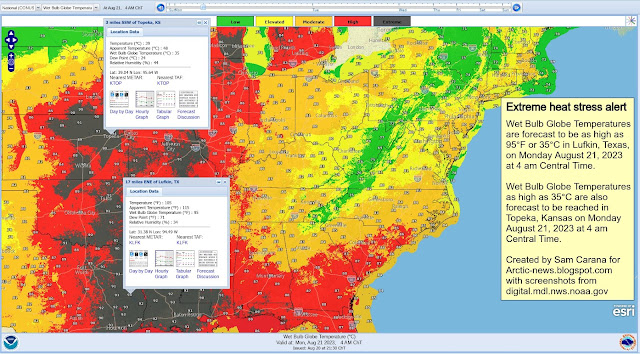
Extreme heat stress alert

High Wet Bulb Globe Temperatures hit the U.S. over a large area, over a long time. 

Wet Bulb Globe Temperatures were forecast to be as high as 95°F or 35°C in Lufkin, Texas, on Monday August 21, 2023 at 4 am Central Time.

Wet Bulb Globe Temperatures as high as 35°C were also forecast to be reached in Topeka, Kansas on the same day and at the same time, as illustrated by the image below.


The image below shows forecasts for August 24, 2023, measured as temperature (left), apparent temperature (center) and wet bulb globe temperature (right), three areas with high values marked by squares, circles, and stars, respectively.  


For descriptions of the various ways temperature can be measures, also see the earlier post Extreme Heat Stress

Unbearable conditions

The images further illustrate that, as temperatures rise, conditions are increasingly occurring that make it hard, if not impossible for many species (including humans) to survive, even at relatively high latitudes. This danger has been discussed in many earlier posts, such as in Humans may be extinct in 2026 and Two Tipping Points

In the video below, Guy McPherson gives his views on the situation.


Conclusion

The situation is dire and is getting more dire every day, which calls for a Climate Emergency Declaration and implementation of comprehensive and effective action, as described in the Climate Plan with an update at Transforming Society.

Links

• Climate Reanalyzer - Daily 2-meter Air Temperature
https://climatereanalyzer.org/clim/t2_daily

• Wet Bulb Globe Temperature forecasts
https://digital.mdl.nws.noaa.gov

• Extreme Heat Stress
https://arctic-news.blogspot.com/2023/06/extreme-heat-stress.html

• National Weather Service - Wet Bulb Globe Temperature: How and when to use it
https://www.weather.gov/news/211009-WBGT

• Humans may be extinct in 2026

• Two Tipping Points


Tuesday, August 15, 2023

Two Tipping Points

The image below, adapted from Climate Reanalyzer, shows that the World Sea Surface Temperature (60°South - 60°North) was at a record high of 21.1°C or 69.98°F for the third day in a row on August 23, 2023. As the image also shows, sea surface temperatures over the past few months have been much higher for the time of year than in any other year on record. 

The image below shows why this recent sea surface temperature rise is so worrying. The image below is based on NASA data for monthly mean global surface temperature anomalies (open ocean) vs 1901-1930. The ochre trend, based on January 1900-July 2023 data, indicates that the latent heat tipping point was crossed in 2021 and the seafloor methane tipping point may be crossed by the end of 2033. Both trends extend into the future for 15 years, but the red trend is based on July 2008-July 2023 data and better reflects El Niño and other variables, and this red trend indicates that the latent heat tipping point was crossed in 2023 and the seafloor methane tipping point may be crossed later this year.

[ click on images to enlarge ]

Sea ice constitutes a latent heat buffer, consuming incoming heat as it melts. While the ice is melting, all energy (at 334 J/g) goes into changing ice into water and the temperature remains at 0°C (273.15K or 32 °F). Once all ice has turned into water, all subsequent energy goes into heating up the water, and will do so at 4.18 J/g for every 1°C the temperature of the water rises. 

[ sea ice thickness, from earlier post ]
Loss of this buffer is linked to subsequent destabilization of methane hydrates. So, there are two tipping points that are linked, and the latent heat tipping point gets crossed in the Arctic before the seafloor methane tipping point gets reached.

The situation is particularly precarious in the Arctic, as the North Atlantic Ocean is very hot and the Gulf Stream keeps pushing hot water toward the Arctic Ocean, while Arctic sea ice has become very thin. The image on the right, from Uni of Bremen, shows that on July 25, 2023, there was virtually no Arctic sea ice left that was more than 30 cm thick. 

The latent heat tipping point is the point where Arctic sea ice loss is such that further incoming ocean heat that was previously consumed as Arctic sea ice melted, instead gets absorbed by the Arctic Ocean. 

[ sea surface temperature anomaly ]
The image on the right, adapted from nullschool.net, shows that on August 2, 2023, most of the Arctic Ocean was showing surface temperatures above the daily average during 1981-2011, indicating that the latent heat tipping point was reached. The latent heat tipping point is estimated to correspond with an ocean temperature anomaly of 1°C above the long term average, 1901-1930 on the above image.

The image underneath, also from nullschool.net, shows the situation on August 20, 2023, when temperatures at the North Pole had been above zero for more than a day and temperatures were forecast to go below zero only twice briefly afterwards, for the period up to August 24, 2023 19:00 UTC (which is as far as the forecast went at the time. 

[ surface temperature ]
This is a further indication that the latent heat tipping point has been reached and that no more heat can be consumed by sea ice melting.

How much sea ice is left? What does the sea ice look like, near the North Pole? Satellite images can give a good impression, but clouds can obscure the view. A clearer view can be obtained by comparing images over several days. 

An animation can reveal how much, or rather how little sea ice is left, and to what extent water of the Arctic Ocean is visible. 

[ Satellite view, click on images to enlarge ]
The animation on the right is made with four NASA Worldview images, showing the situation on August 11, 15, 16 and 19, 2023. 

The second tipping point, the seafloor methane tipping point, occurs as more heat reaches the seafloor where it destabilizes hydrates contained in sediments at the seafloor.

This tipping point comes with multiple self-reinforcing feedback loops, such as explosive growth in methane volume setting off further destabilization, rapid rise of Arctic temperatures, loss of permafrost and loss of albedo, and release of further greenhouse gases.

Crossing of the seafloor methane tipping point will occur later than crossing of the latent heat tipping point, so the seafloor methane tipping point is estimated to correspond with a higher ocean temperature anomaly.

The current situation is particularly precarious in the Arctic, as the North Atlantic Ocean is very hot and the Gulf Stream keeps pushing hot water toward the Arctic Ocean, while Arctic sea ice has become very thin (image right) and the latent heat tipping point has been crossed.

As the temperature of the Arctic Ocean keeps rising, more heat can reach sediments located at the seafloor, since much of the Arctic Ocean is very shallow and sediments at the seafloor of the Arctic Ocean can contain vast amounts of methane.

The danger is that further heat will destabilize hydrates in these sediments, leading to explosive eruptions of methane, as its volume increases 160 to 180-fold when leaving the hydrates, and resulting in huge eruptions of methane both from the destabilizing hydrates and from methane that is present in the form of free gas underneath the hydrates.

[ from earlier post, click on images to enlarge ]

The above image, from an earlier post, illustrates that warnings have been given before about the danger of these two tipping points getting crossed in the Arctic. In the above image, the trends are based on annual sea surface temperature data for the Northern Hemisphere. The seafloor methane tipping point is estimated to get crossed when the ocean temperature anomaly on the Northern Hemisphere goes beyond 1.35°C above its long term average.

The Argo Float 7900549 compilation image below illustrates that the highest water temperatures in the Arctic Ocean can occur at a depth of approximately 100 meters. The image shows temperatures as high as 5°C at that altitude.


Stronger winds along the path of the Gulf Stream can at times speed up sea currents that travel underneath the surface. As a result, huge amounts of hot, salty water can travel from the Atlantic Ocean into the Arctic Ocean, abruptly pushing up temperatures and salinity levels at the bottom of the Arctic Ocean, which in many places is very shallow.


The above image shows details of Argo float 9701007, further illustrating the danger that heat can reach the seafloor. North of Norway, where the water is less than 400 m deep, temperatures higher than 5°C show up throughout the vertical water column, up to August 10, 2023, when temperatures above 11°C were recorded close to the sea surface. The colored inset also shows that greater mixing down of heat occurred from October to December 2022, as the sea ice started to return and seal off the surface, preventing heat transfer from ocean to atmosphere, as also discussed at FAQ #11.

Below is another image adapted from Climate Reanalyzer, showing that the sea surface temperature of the North Atlantic Ocean has for months been much higher for the time of year than it was in previous years on record. Eight causes behind this have been discussed in an earlier post. The image below shows the situation on August 28, 2023, with the North Atlantic sea surface temperature reaching a record high of 25.34°C or 77.61°F. 


The image below, adapted from NOAA, shows how the Gulf Stream is pushing ocean heat toward the Arctic Ocean, while sea surface temperatures show up as high as 33.6°C or 92.48°F on August 17, 2023. 


[ 2022 animation ]
Studies, some of them dating back more than two decades, show that over the shallow East Siberian Arctic Shelf (ESAS) winds at times can mix the water column from the top to the bottom. A 2005 study of the ESAS led by Igor Semiletov recorded water temperatures at the seafloor, in September 2000, of 4.7°C at 20m depth at one location and 2.11°C at 41m depth at another location, with salinity levels of 29.7‰ and of 31.7‰, respectively.

A deformed Jet Stream, in combination with a cyclone, could similarly result in strong winds abruptly pushing a huge amount of heat through the Bering Strait into the Arctic Ocean. 

The animation on the right shows how remnants of Typhoon Merbok were forecast to enter the Arctic Ocean through the Bering Strait from September 17 to 19, 2022.

The image below, adapted from Climate Reanalyzer, shows that the (2-meter) air temperature in the Arctic was 3.79°C on August 25, 2023, a record high for the time of year and 2.08°C higher than the 1979-2011 mean for that day.


The image below illustrates how incoming ocean heat that previously was consumed in the process of melting of the sea ice, is now causing the water of the Arctic Ocean to heat up, with more heat reaching the seafloor of the Arctic Ocean, which has seas that in many places are very shallow.

[ Latent heat loss, feedback #14 on the Feedbacks page ]
Further adding to the danger is that destabilization of methane hydrates can cause huge amounts of methane to erupt with great force in the form of plumes. Consequently, little of the methane can be broken down in the water by microbes, while there is very little hydroxyl in the atmosphere over the Arctic Ocean to break down the methane that enters the atmosphere.

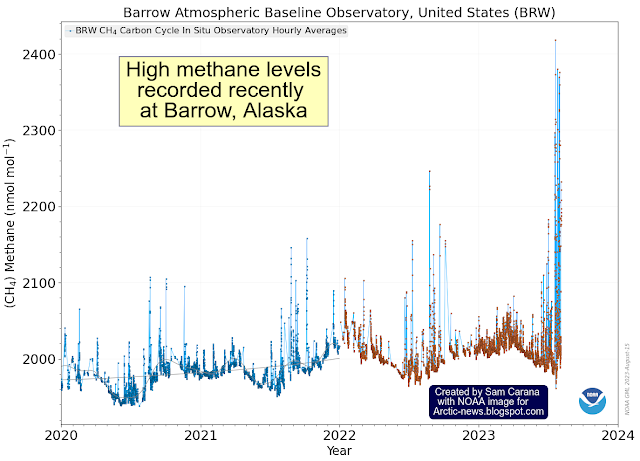
Ominously, some very high methane levels were recorded recently at Barrow, Alaska, as illustrated by the NOAA images below.

The most recent monthly methane average recorded at Barrow, Alaska, is above 2080 parts per billion.

In the video below, Guy McPherson describes the dire situation.


Climate Emergency Declaration

A catastrophe of unimaginable proportions is unfolding. Life is disappearing from Earth and runaway heating could destroy all life. At 5°C heating, most life on Earth will have disappeared. When looking only at near-term human extinction, 3°C will likely suffice.

The situation is dire and is getting more dire every day, which calls for a Climate Emergency Declaration and implementation of comprehensive and effective action, as described in the Climate Plan with an update at Transforming Society.


Links

• Climate Reanalyzer - daily sea surface temperature
https://climatereanalyzer.org/clim/sst_daily

• Climate Reanalyzer - daily 2-meter air temperature
https://climatereanalyzer.org/clim/t2_daily

• NASA - GISS Surface Temperature Analysis
https://earth.nullschool.net

• NOAA - Barrow Atmospheric Baseline Observatory, United States
https://gml.noaa.gov/dv/iadv/graph.php?code=BRW&program=ccgg&type=ts

• Argo Float
https://fleetmonitoring.euro-argo.eu

• Remnants of Typhoon Merbok forecast to enter the Arctic Ocean through the Bering Strait from September 17 to 19, 2022.
Discussed at https://www.facebook.com/SamCarana/posts/10166948876390161, from:
https://arctic-news.blogspot.com/p/cold-freshwater-lid-on-north-atlantic.html

• The East Siberian Sea as a transition zone between Pacific-derived waters and Arctic shelf waters - by Igor Semiletov et al. (2005)
https://agupubs.onlinelibrary.wiley.com/doi/10.1029/2005GL022490

• Sea surface temperature at record high
https://arctic-news.blogspot.com/2023/03/sea-surface-temperature-at-record-high.html

• Record high North Atlantic sea surface temperature


Saturday, August 12, 2023

Return of the Blob?


The Blob is a large mass of water with relatively high heat content, floating at the surface and underneath the surface of the North Pacific Ocean. The Blob did appear several times before, including in 2016, which was a strong El Niño year. The above image shows high sea surface temperature anomalies in the North Pacific on August 10, 2023, raising the question of whether this constitutes a return of the Blob.

As temperatures rise, the Arctic is heating more rapidly than the rest of the world. The narrowing temperature difference between the Arctic and the Tropics is weakening the speed at which the jet stream circumnavigates Earth and this is making the jet stream more wavy.

In a 2012 study, Jennifer Francis et al. warned that this makes atmospheric blocking events in the Northern Hemisphere more likely, aggravating extreme weather events related to stagnant weather conditions, such as droughts, flooding and heatwaves. The Blob appears to be the marine version of a heatwave on land.

The image below shows that, on August 12, 2023, sea surface temperatures were as much as 7°C or 12.6°F higher than 1981-2011 in the Pacific Ocean (at the green circle, follow the arrow). A strongly deformed Jet Stream shows many circular wind patterns, prolonging, intensifying and increasing the occurrence of extreme weather events such as accumulation of heat during heatwaves. 


Is the Kuroshio Current slowing down?

The Kuroshio Current is an ocean current that carries heat along its path in the North Pacific, similar to the Gulf Stream in the North Atlantic Ocean. Is the Kuroshio Current slowing down as temperatures rise and is such slowing down causing hot water to accumulate in the western part of the North Pacific, leading to a return of a new Blob moving across the North Pacific toward the coast of North America?

The North Atlantic has been experiencing record high sea surface temperatures recently. A return of the Blob increases the danger of more heat reaching sediments at the seafloor of the Arctic Ocean.

[ 2022 animation ]
The animation on the right shows how remnants of Typhoon Merbok were forecast to enter the Arctic Ocean through the Bering Strait from September 17 to 19, 2022.

Studies, some of them dating back more than two decades, show that over the shallow East Siberian Arctic Shelf (ESAS) winds at times can mix the water column from the top to the bottom. A 2005 study of the ESAS led by Igor Semiletov recorded water temperatures at the seafloor, in September 2000, of 4.7°C at 20m depth at one location and 2.11°C at 41m depth at another location, with salinity levels of 29.7‰ and of 31.7‰, respectively.

A deformed Jet Stream, in combination with a cyclone, could result in strong winds abruptly pushing a huge amount of heat through the Bering Strait into the Arctic Ocean. This could cause methane hydrates to destabilize and huge amounts of methane to erupt from the seafloor and enter the atmosphere.

Conclusion

The situation is dire and is getting more dire every day, which calls for a Climate Emergency Declaration and implementation of comprehensive and effective action, as described in the Climate Plan with an update at Transforming Society.


Links

• The Blob

• Evidence Linking Arctic Amplification to Extreme Weather in Mid-Latitudes, by Jennifer Francis et al. (2012)
https://agupubs.onlinelibrary.wiley.com/doi/full/10.1029/2012GL051000 

• The Kuroshio current
https://en.wikipedia.org/wiki/Kuroshio_Current

• Record high North Atlantic sea surface temperature

• Remnants of Typhoon Merbok forecast to enter the Arctic Ocean through the Bering Strait from September 17 to 19, 2022.

• The East Siberian Sea as a transition zone between Pacific-derived waters and Arctic shelf waters - by Igor Semiletov et al. (2005)
https://agupubs.onlinelibrary.wiley.com/doi/10.1029/2005GL022490

• Climate Plan
https://arctic-news.blogspot.com/p/climateplan.html

• Transforming Society
https://arctic-news.blogspot.com/2022/10/transforming-society.html

• Climate Emergency Declaration
https://arctic-news.blogspot.com/p/climate-emergency-declaration.html