Monday, March 18, 2024

Tragedy set to unfold in Tropics (update)

The temperature in the Tropics (23.5°S-23.5°N, 0-360°E) reached a new record high on March 13, 2024. The image below shows the situation over the years through March 13, 2024, when the average daily surface air temperature was 26.9°C and 1.4°C above 1979-2000 (black line is 2024).


The previous record high temperature was reached on April 24, 2016, when it was 26.8°C, and 1°C above 1979-2000 (grey line is 2016). 

The annual maximum temperature in the Tropics is typically reached in April, but very high temperatures were also reached in early May 2023 (orange line is 2023), so the temperature this year may well rise even higher over the next two months.

Meanwhile, we're still in El Niño, according to NOAA and as illustrated by the image on the right.

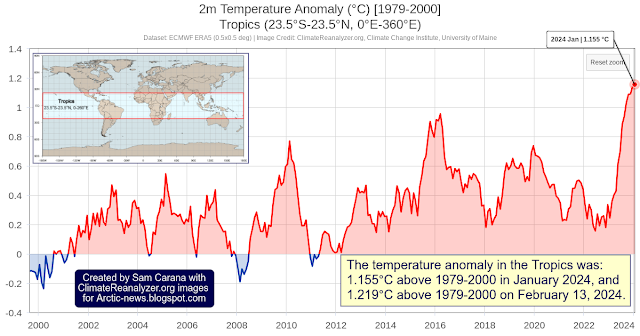
The image below shows the monthly temperature anomalies over the past few years through February 2024. 


Note that the anomalies in the two above images are calculated from different bases. When calculated from a pre-industrial base, anomalies will be higher.

These high temperatures threaten to cause widespread loss of life of people, livestock and wildlife, crop failure and ecosystem collapse in the tropics.

Climate Emergency Declaration

The situation is dire and the precautionary principle calls for rapid, comprehensive and effective action to reduce the damage and to improve the situation, as described in this 2022 post, where needed in combination with a Climate Emergency Declaration, as discussed at this group.


Links

• Climate Reanalyzer
https://climatereanalyzer.org

• Pre-industrial
https://arctic-news.blogspot.com/p/pre-industrial.html

• Extinction
https://arctic-news.blogspot.com/p/extinction.html

• Climate Plan
https://arctic-news.blogspot.com/p/climateplan.html

• Climate Emergency Declaration
https://arctic-news.blogspot.com/p/climate-emergency-declaration.html

Earlier versions of this post are discussed at facebook at:

Friday, March 15, 2024

CO2 rise is accelerating

On March 15, 2024, the daily average carbon dioxide (CO₂) at Mauna Loa, Hawaii, was 427.93 parts per million (ppm), as illustrated by the image below, adapted from NOAA. 

This is the highest daily in situ average in the NOAA record at Mauna Loa, which is the more remarkable since the annual CO₂ maximum is typically reached in May, so even higher values are likely to be reached over the next few months. 

The image below, adapted from NOAA, shows 31 days of CO₂ at Mauna Loa, Hawaii. The image shows that a daily mean CO₂ of 427.93 ppm was recorded on March 15, 2024, and that many of the hourly averages that were recorded in April 2024 were higher than 430 ppm.

The image below, adapted from the Scripps Institution of Oceanography, shows that CO₂ at Mauna Loa was 427.80 ppm on March 14, 2024. The background shows six months of CO₂ ending March 15, 2024. 

The image below, adapted from NOAA, shows that the monthly mean CO₂ at Mauna Loa in March 2024 was 425.38 ppm, a growth of 4.39 ppm compared to March 2023. 

The image below, adapted from NOAA, shows that the annual CO₂ growth at Mauna Loa in 2023 was 3.36 ppm, the highest annual growth on record.

Temperature rise

The February 2024 global surface temperature is 1.75°C or 3.15°F when compared to a base of 1886-1915, i.e. a 30-year period centered around the year 1900, as illustrated by the image below. The image shows part (from 1980) of a graph based on NASA Land+Ocean data from January 1880 through February 2024, with the black squares showing the raw monthly data. 

The rise is as large as 2.74°C or 3.132°F when compared to a pre-industrial base and when also taking into account ocean air temperatures and higher polar anomalies, as indicated in the bright yellow inset on the image below. 

Lowess smoothing (red line, 1 year window) highlights variability between years and the huge rise that has occurred recently, which is partly caused by variability such as associated with El Niño. 

The red line also highlights the potential for an even larger rise to come soon, as feedbacks and further developments start to kick in with greater ferocity, contributing to non-linear and abrupt temperature rise, as discussed in earlier posts such as this one and this one

The use of an early date for a pre-industrial base is discussed at the pre-industrial page and is supported by recent analysis of sponges collected in the Caribbean, illustrated by the image below.

[ from earlier post ]

Other recent research debunks the idea that Earth’s surface (across land and sea) has experienced really hot temperatures over the last two billion years. Instead, it shows that Earth has had a relatively stable and mild climate. This makes the threat of a huge temperature rise over the next few years even more menacing. 

The temperature is rising most rapidly in the Arctic. Loss of sea ice threatens to accelerate the temperature rise in the Arctic even more, and cause destabilization of methane hydrates at the bottom of the Arctic Ocean and thawing of permafrost on land, resulting in massive releases of greenhouse gases, further acceleration of the temperature rise and widespread extinction of species (including humans) as early as in the year 2026.

Clouds Tipping Point

The image below illustrates that a polynomial trend (red) can better capture the acceleration in the rise in CO₂ concentration in the atmosphere than a linear trend (blue). 

The red polynomial trend also illustrates how rising CO₂ can cause the clouds tipping point at 1200 ppm to be crossed before 2100, i.e. earlier than anticipated in IPCC models (inset).

Moreover, the clouds tipping point could be crossed much earlier when also taking into account methane. Monthly methane was about 1960 parts per billion (ppb) recently at Mauna Loa, Hawaii, as illustrated by the image below.


A methane concentration of 1960 ppb corresponds, at a Global Warming Potential (GWP) of 200, with a carbon dioxide equivalent (CO₂e) of 392 ppm. Together with the above daily average CO₂ concentration of 427.93 ppm this adds up to a joint CO₂e of 819.93 ppm, i.e. only 380.07 ppm away from the clouds tipping point (at 1200 ppm CO₂e) that on its own could raise the global temperature by 8°C.

This 380.07 ppm CO₂e could be added almost immediately by a burst of seafloor methane less than the size of the methane that is currently in the atmosphere (about 5 Gt). There is plenty of potential for such an abrupt release, given the rising ocean heat and the vast amounts of methane present in vulnerable sediments at the seafloor of the Arctic Ocean, as discussed in earlier posts such as this one.

Furthermore, nitrous oxide is also rising and there are additional elements that could further speed up the temperatures rise, as discussed at the Extinction page, which shows that, altogether, there is the potential for a temperature rise of well over 18°C by 2026.

A 2018 study (by Strona & Bradshaw) indicates that most life on Earth will disappear with a 5°C rise. Humans, who depend for their survival on many other species, will likely go extinct with a 3°C rise, as illustrated by the image below, from an earlier post.


Environmental crimes

The accelerating growth in carbon dioxide indicates that politicians have failed and are failing to take adequate action. 

Current laws punish people for the most trivial things, while leaving the largest crime one can imagine unpunished: planetary omnicide!

[ from earlier post ]

The image below is from the post Planetwide Ecocide - The Crime Against Life on Earth, by Andrew Glikson


If we accept that crimes against humanity include climate crimes, then politicians who inadequately act on the unfolding climate catastrophe are committing crimes against humanity and they should be brought before the International Criminal Court in The Hague, the Netherlands.

[ image from earlier post ]

Meanwhile, Belgium has recognised ecocide as international crime and the EU Parliament has voted to criminalize the most serious cases of ecosystem destruction. 

Climate Emergency Declaration

The situation is dire and the precautionary principle calls for rapid, comprehensive and effective action to reduce the damage and to improve the situation, as described in this 2022 post, where needed in combination with a Climate Emergency Declaration, as discussed at this group.


Links

• NOAA - Carbon Cycle Gases - Mauna Loa, Hawaii, United States
https://gml.noaa.gov/dv/iadv/graph.php?code=MLO&program=ccgg&type=ts

• Scripps Institution of Oceanography
https://keelingcurve.ucsd.edu

• NOAA - Weekly average CO2 at Mauna Loa 
https://gml.noaa.gov/ccgg/trends/weekly.html

• NOAA - annual mean carbon dioxide growth rates for Mauna Loa
https://gml.noaa.gov/ccgg/trends/gr.html

• NOAA - greenhouse gases at Mauna Loa 

• Belgium becomes first in EU to recognise ecocide as international crime 
https://www.facebook.com/groups/climateplan/posts/8012665172096853

• ‘Revolutionary’: EU Parliament votes to criminalise most serious cases of ecosystem destruction 

• How long do we have?
https://arctic-news.blogspot.com/2019/04/how-long-do-we-have.html


• Blue Ocean Event 2024?

• Potential temperature trends

• Co-extinctions annihilate planetary life during extreme environmental change, by Giovanni Strona and Corey Bradshaw (2018)
https://www.nature.com/articles/s41598-018-35068-1

• NASA GISTEMP - Temperature analysis Plots
https://data.giss.nasa.gov/gistemp/graphs_v4/customize.html

• Tragedy set to unfold in tropics 
https://arctic-news.blogspot.com/2024/02/tragedy-set-to-unfold-in-tropics.html

• 300 years of sclerosponge thermometry shows global warming has exceeded 1.5 °C - by Malcolm McCulloch et al. (2024)
https://www.nature.com/articles/s41558-023-01919-7
discussed at facebook at: 
https://www.facebook.com/groups/arcticnews/posts/10161250170389679

• Oxygen isotope ensemble reveals Earth’s seawater, temperature, and carbon cycle history - by Terry Isson et al. 

Saturday, March 2, 2024

Arctic sea ice set for steep decline


The February 2024 temperature (at 2 meter) was much higher than in 1951-1980, especially in the Arctic, as the above image shows.


The above image is adapted from NASA and shows an average February 2024 temperature anomaly of 1.44°C above 1951-1980, with anomalies showing up as high as 11°C. 


The above image is created with NASA Land+Ocean monthly mean global temperature anomalies versus a 1900-1923 custom base, further adjusted by 0.99°C to reflect ocean air temperatures, higher polar anomalies and a pre-industrial base. 

Two trends are added, the blue trend is based on all data (Jan.1880-Feb.2024) and the magenta trend is based on a shorter period (Jan.2010-Feb.2024), to better reflect variables such as El Niño and non-linear feedbacks as discussed in the page Feedbacks in the Arctic and in this recent post

Ocean temperature


Sea surface temperatures (60°S-60°N, 0-360°E) reached a new record high of 21.22°C on March 10, 2024, in the Climate Reanalyzer daily records that go back to 1981. 

Sea surface temperatures may get even higher later this year. What could make the sea surface temperature go up even higher?

[ click on images to enlarge ]
The highest daily sea surface temperatures for the year are typically reached in March. 

This was the case for the previous years on record going back to 1981, except for the year 2023 when the current El Niño started to emerge, resulting in the highest peak for the year occurring in August 2023.

There is a 100% probability that El Niño will be present during the 3 months from February 2024 to April 2024, according to NOAA predictions updated February 26, 2024.

The image below shows the Northern Hemisphere Sea Surface Temperature Anomaly, January 2000-February 2024 NOAA data (degrees Celsius).

After an astonishing rise in 2023, sea surface temperatures have come down only a little bit in Winter on the Northern Hemisphere, raising the potential for a huge rise in ocean heat later in 2024 that threatens to destabilize sediments at the seafloor of the Arctic Ocean and cause huge amounts of methane to erupt and abruptly enter the atmosphere.
[ click on images to enlarge ]
Ocean heat content keeps rising at a rate of change that is non-linear, as illustrated by the image below, by Zack Labe.


North Atlantic

The animation below, from Nahel Belgherze, illustrates how much hotter the North Atlantic has been over the past 365 days, while a big rise in temperature can be expected over the next few months, due to the change in season.


In February 2024, the temperature (at 2 meter) over the North Atlantic was 1.927°C higher than 1951-1980, as illustrated by the image below. 

The map below shows the North Atlantic sea surface temperature anomaly versus 1951-1980 in February 2024. 


Arctic surface air temperature

The surface air temperature in the Arctic (66.5-90°N, 0-360°E) was 5.2°C above 1979-2000 on March 3, 2024, the highest anomaly on record for the time of year, as illustrated by the image below. 

[ click on images to enlarge ]

Arctic sea ice

As the atmosphere and the oceans keep heating up, Arctic sea ice keeps declining. As illustrated by the image below, Arctic sea ice extent was 14.746 million km² on March 6, 2024. 


As the above image shows, there are a few years with lower sea ice extent during this time of year than in 2024, which could be due to more water vapor in the air causing more precipitation in the Arctic. At this time of year, Arctic sea ice has typically reached its maximum annual extent and goes into steep descend until half September. With the change in seasons, more sunlight will be reaching the Northern Hemisphere and Arctic sea ice looks set for a steep decline over the next few months. 


As illustrated by the above image, Arctic sea ice volume is already at a record low for the time of year, at a time when little or no sunlight is yet reaching the Arctic. Given that Arctic sea ice currently is not at a record low extent for the time of year, this indicates that the sea ice is very thin, due to ocean heat causing sea ice to melt from below. Moreover, as illustrated by the map below, much of the thicker sea ice is located off the east coast of Greenland. This sea ice and the purple-colored sea ice can be expected to melt away quickly with the upcoming rise in temperatures over the next few months, as also discussed in earlier posts such as this one

Emissions and concentrations of greenhouse gases keep rising

Meanwhile, emissions keep rising. The image below, adapted from IEA, shows the increase in energy-related carbon dioxide emissions, 1900-2023. 


February 2024 CO₂ was about 425 ppm (background image below). February 2023 CO₂ was 420.3 ppm (inset right). The highest annual rise on record is about 3 ppm, reached in 1998 and in 2015/2016 (inset left). 

The threat

The threat of a huge, abrupt temperature rise has been described many times before, e.g. on the Threat page that describes many elements contributing to the threat, both cumulatively and interactively, with some of the content dating back as far as 2007. Another page with more background is the Extinction page.

Further illustrating the threat is the image below, adapted from Climate Reanalyzer and using a CMIP6 SSP585 model. The image shows what the temperature anomaly (at 2 meter and compared to 1851-1900) could be by 2100. Such a temperature rise may unfold much earlier when including numerous feedbacks kicking in strongly.


What can strongly contribute to such a rise is that, without the buffer constituted by thicker sea ice, an influx of ocean heat threatens to destabilize hydrates contained in sediments at the seafloor of the Arctic Ocean, resulting in eruptions of huge amounts of methane.

[ The buffer is gone - Latent Heat Tipping Point crossed ]
Climate Emergency Declaration

The situation is dire and the precautionary principle calls for rapid, comprehensive and effective action to reduce the damage and to improve the situation, as described in this 2022 post, where needed in combination with a Climate Emergency Declaration, as discussed at this group.


Links

• Climate Reanalyzer - daily sea surface temperature (60°S-60°N, 0-360°E)
https://climatereanalyzer.org/clim/sst_daily

• NASA - Temperature Analysis
https://data.giss.nasa.gov/gistemp

• NOAA - ENSO: Recent Evolution, Current Status and Predictions (February 26, 2024 update)
https://www.cpc.ncep.noaa.gov/products/analysis_monitoring/lanina/enso_evolution-status-fcsts-web.pdf

• Ocean heat content - image by Zack Labe

• North Atlantic daily sea surface temperature - animation by Nahel Belgherze
https://twitter.com/WxNB_/status/1765065264109101393

• Danish Meteorological Institute - Arctic sea ice volume and thickness
https://ocean.dmi.dk/arctic/icethickness/thk.uk.php

• International Energy Agency (IEA) - CO2 Emissions in 2023 report

• Keeling Curve, Scripps Institution of Oceanography, UC San Diego - CO₂ at Mauna Loa, Hawaii 

• NOOA - Monthly Averages CO₂ at Mauna Loa, Hawaii 

• NOAA - annual increase of CO₂ at Mauna Loa, Hawaii 
https://gml.noaa.gov/ccgg/trends/gr.html

• Feedbacks in the Arctic

• The Threat


Friday, February 23, 2024

Stephen Salter, a giant in combating climate change passes away

   Stephen Salter (2012)
Stephen Hugh Salter, MBE, FRSE, Emeritus Professor of Engineering Design at the University of Edinburgh, was born December 7, 1938, and passed away peacefully on February 23, 2024, at the age of 85.

Stephen Salter was a giant who persisted to dedicate his life to combating climate change, and he did so in many ways until the very end. 

Stephen's work on wave energy led to Salter's Duck (1974), a device able to both generate energy and reduce wave strength. In 1977, Stephen built a multi-directional wave tank at the University of Edinburgh. 

In 2011, Stephen looked at ways to capture methane released in the Arctic, such as by covering lakes and parts of seas by sheets to collect the methane (drawing below).

Empty and filled extruded rubber trough cases with 4 times enlarged views of end and centre

Stephen was perhaps best known for his work on marine cloud brightening, i.e. deploying vessels to spray salt particles into the air in an effort to reduce sea surface temperatures, and thus also reducing sea ice loss and reducing the strength of extreme weather events including storms and hurricanes.

In the video below, Stephen discusses marine cloud brightening in a TEDx talk in 2016. 


Marine cloud brightening | Prof. Stephen Salter | TEDx Talks Published 15 Nov 2016

The image below is from the post Hurricane Moderation at Arctic-news.blogspot.com


In the video below, by theedinburghreporter, Stephen Salter talks about marine cloud brightening.


In the video below, Stephen Salter is interviewed by Nick Breeze (2022). 


Below is a screenshot from the above video by Nick Breeze. 

Stephen Salter discusses sending solar energy back out to space by means of Marine Cloud Brightening.
Screenshot by Sam Carana from video by Nick Breeze.

Stephen Salter (2022): "A jolly small change in reflectivity of the clouds will be sending solar energy back out to space enough to balance what the excess is that's being retained here by greenhouse gases (4:26-4:41). Maybe 10 cubic meters of water a second as sub micron drops sprayed in the right place would offset all the damage we've done since pre-industrial times (5:15-5:24)." 

Our hearts are saddened by this huge loss, and our thoughts are with Stephen's family and his many friends. Stephen's work will not be forgotten.

Added below is a video featuring Stephen Salter, Peter Wadhams, Paul Beckwith, Robert Tulip, Herb Simmens, Alaxandra Price and Win Rampen. 


Links

• Futuristic fleet of 'cloudseeders' - by John Latham (2007)
https://news.bbc.co.uk/2/hi/programmes/6354759.stm

• Sea-going hardware for the cloud albedo method of reversing global warming - by Stephen Salter, Graham Sortino and John Latham (2008)
https://royalsocietypublishing.org/doi/10.1098/rsta.2008.0136

• Can we capture methane from the Arctic seabed? (2011)

• Professor Stephen Salter receives top Academy Award (2012)

• Leading wave energy pioneer Prof Stephen Salter (2012) 
https://www.theengineer.co.uk/content/in-depth/leading-wave-energy-pioneer-prof-stephen-salter

• Coded modulation of computer climate models for the prediction of precipitation and other side-effects of marine cloud brightening (2013)

• Marine cloud brightening | Prof. Stephen Salter | TEDxHeriotWattUniversity |  TEDx talk (2016)
• Hurricane Moderation (2018)
https://arctic-news.blogspot.com/2018/09/hurricane-moderation.html

• Talking to Professor Stephen Salter - TheEdinburghReporter (May 23, 2019)

• Speaking with Professor Stephen Salter - The Edinburgh Report (June 1, 2019)

• Professor Stephen Salter at Holyrood speaking about project to arrest climate change

• John Latham obituary (2021)
https://www.theguardian.com/science/2021/may/30/john-latham-obituay

• Stephen Salter - Whole interview by Nick Breeze ClimateGenn (2022)


Wednesday, February 21, 2024

Tragedy set to unfold in tropics

The temperature is rising rapidly in the tropics. The image below shows the situation in the tropics (23.5°S-23.5°N, 0-360°E) through February 14, 2024, when the average daily surface air temperature was 26.3°C, i.e. 1.3°C above 1979-2000.


On April 24, 2016, it was 26.8°C, the highest temperature on record in the tropics, 1°C above 1979-2000, as the above image also shows. The image below shows temperature anomalies over the years. 

Note that the above anomalies are calculated from 1979-2000, which isn't pre-industrial. When calculated from a genuinely pre-industrial base, anomalies will be higher. Also have a look at the recent analysis of sponges collected in the Caribbean, illustrated by the image below. 


According to NOAA, there is a 100% chance that the current El Niño will persist through February-March-April 2024, as illustrated by the image below. 


The danger is that a tragedy will unfold over the next few months as temperatures look set to exceed the 2016 peak in the tropics and cause widespread loss of life of people, livestock and wildlife, crop failure and ecosystem collapse in the tropics.

Climate Emergency Declaration

The situation is dire and the precautionary principle calls for rapid, comprehensive and effective action to reduce the damage and to improve the situation, as described in this 2022 post, where needed in combination with a Climate Emergency Declaration, as discussed at this group.


Links


• Climate Reanalyzer 
https://climatereanalyzer.org

• NOAA - ENSO: Recent Evolution, Current Status and Predictions
https://www.cpc.ncep.noaa.gov/products/analysis_monitoring/lanina/enso_evolution-status-fcsts-web.pdf

• Pre-industrial
https://arctic-news.blogspot.com/p/pre-industrial.html

• 300 years of sclerosponge thermometry shows global warming has exceeded 1.5 °C - by Malcolm McCulloch et al. (2024)  

• Extinction
https://arctic-news.blogspot.com/p/extinction.html

• Climate Plan
https://arctic-news.blogspot.com/p/climateplan.html

• Climate Emergency Declaration
https://arctic-news.blogspot.com/p/climate-emergency-declaration.html

Tragedy set to unfold in tropics is discussed at facebook:


Monday, February 5, 2024

Too late?

Climate change denial and the rise of fascism

by Andrew Glikson

but they can be sure that they won't be recorded for their crimes in history -- because
there 
won't be any history” (Noam Chomsky, 2023, in a letter to the author)


Extreme planetary heating, the failure of effective mitigation and the rise of denial around the world combine to lead to a seventh mass extinction of species. While originally Global warming constituted an unintended consequence of the 18-20ᵗʰ centuries industrial revolution, the collapse of attempts to arrest it in the 20-21st centuries is already leading toward a mass extinction, but the rise of fascist movements and their neoconservative kins is jeopardizing a unified global approach to the climate crisis. Inherently however racist ideology, worship of power, glorification of war, the pride of killing and “honourable” death is not concerned with the fatal consequences of climate change.

Figure 1. 2023 was the warmest year since global records began in 1850 by a wide margin. It was 1.18°C
above the 20th-century average of 13.9°C. It was 1.35°C above the pre-industrial average (1850-1900).

While the authorities (so-called) claim they are trying to arrest global warming, temperatures continue to rise to fatal levels (Figure 1). Ignoring climate science, dismissing climate scientists and confecting lies while global heating accelerates with deleterious consequences, the species sapiens is finding itself on track to carbon saturation to Miocene levels (420< ppm) of its atmosphere ─ the lungs of the Earth ─ at a geologically unprecedented rate. The extreme rise in the chemistry of the atmosphere, the acidification of the oceans and the coating of the land with carbon residues and plastics are leading toward an uninhabitable Earth.

With exceptions governments pretend the introduction of alternative energy ─ solar, wind, hydrothermal, hydro and tide ─ is likely to reduce the mining of and emission from fossil fuels, but this has hardly occurred since 2022. Oblivious to the implications of climate science, the concerns of the powers that be hinge on the bottom line, an attitude echoed by much in the population. False claims abound in high places, as exemplified by the chair of COP-28 conference claiming: “there is ‘no science’ behind demands for phase-out of fossil fuels”.

Everywhere, including Australia, carbon counting hinges on domestic mining and emissions to the exclusion of carbon exports. Thus “Oil, gas, and coal exports are not counted when countries tally their greenhouse gas emissions under the Paris Agreement.”

Hopeful popular belief abound, as if new science-based discoveries could resolve climate change, as by the optimistic projection by NASA: “While we cannot stop global warming overnight, we can slow the rate and limit the amount of global warming by reducing human emissions of heat-trapping gases and soot. Such suggestions overlook the amplifying feedback from warming oceans, melting ice sheets. disintegrating permafrost, release of methane from the oceans, and migrating climate zones. Scientists are caught between a need to promote mitigation and adaptation on the one hand and a reluctance to communicate the impending calamity.

Australia’s enshrined emissions cut target of 43% by 2030, up from 26-28%, has limited consequences since it has become the fifth largest miner and the world’s third biggest exporter of fossil fuels, exporting only behind Russia and Saudi Arabia, more than Iraq, Venezuela and any country in the EU.

The blood-stained history of Homo sapiens since the mastery of fire (Figure 2), all the way to the Anthropocene crisis, combined with the proliferation of doomsday weapons, do not bode well for the future of terrestrial species.

Global empires east and west have become increasingly brutal. Fascism ─ the ideology of death ─ and its neo-conservative (so-called) followers are not concerned with global warming and its consequences, except where it hurts the profit motive. References to “climate change” by politicians constitute hollow words they hardly mean. There are not too many angels left except where the young like Greta Thunberg rebel.

Figure 2. The deep time origin of the Anthropocene.

A/Prof. Andrew Y Glikson
Earth and Paleo-climate scientist

Andrew Glikson
Books:
The Asteroid Impact Connection of Planetary Evolution
https://www.springer.com/gp/book/9789400763272
The Archaean: Geological and Geochemical Windows into the Early Earth
https://www.springer.com/gp/book/9783319079073
The Plutocene: Blueprints for a Post-Anthropocene Greenhouse Earth
https://www.springer.com/gp/book/9783319572369
The Event Horizon: Homo Prometheus and the Climate Catastrophe
https://www.springer.com/gp/book/9783030547332
Climate, Fire and Human Evolution: The Deep Time Dimensions of the Anthropocene
https://www.springer.com/gp/book/9783319225111
Evolution of the Atmosphere, Fire and the Anthropocene Climate Event Horizon
https://www.springer.com/gp/book/9789400773318
From Stars to Brains: Milestones in the Planetary Evolution of Life and Intelligence
https://www.springer.com/us/book/9783030106027
Asteroids Impacts, Crustal Evolution and Related Mineral Systems with Special Reference to Australia
https://www.springer.com/us/book/9783319745442
The Fatal Species: From Warlike Primates to Planetary Mass Extinction
https://www.springer.com/gp/book/9783030754679
The Trials of Gaia. Milestones in the evolution of Earth with reference to the Antropocene
https://www.amazon.com.au/Trials-Gaia-Milestones-Evolution-Anthropocene/dp/3031237080