Showing posts with label sea ice. Show all posts

Friday, September 27, 2019

IPCC Report Ocean and Cryosphere in a Changing Climate


The IPCC has issued another special report: The Ocean and Cryosphere in a Changing Climate.

How much carbon is there in the Arctic?

[ click on images to enlarge ]
How much carbon is present in the northern circumpolar permafrost region (map)?

According to the report, there is 1460 to 1600 billions of tons of carbon (GtC¹) present in the soil on land. The report also mentions that there is additional carbon present on shallow Arctic sea shelves, but the report doesn't add figures.

Natalia Shakhova et al. once estimated the accumulated methane potential for the Eastern Siberian Arctic Shelf alone to be about 500 Gt of organic carbon, with an additional amount in hydrates of about 1000 Gt and a further amount of methane in free gas of about 700 Gt. Back in 2008, Natalia Shakhova et al. considered release of up to 50 Gt of predicted amount of hydrate storage as highly possible for abrupt release at any time.

Note ¹: 1 billion ton of carbon = 1 GtC = 1.33 Gt of CH₄ (methane) and 1 GtC = 3.67 Gt of CO₂ (carbon dioxide)

How much of these vast amounts could be released to the atmosphere?

The IPCC report projects permafrost near the surface (top 3–4 m) to decrease in area by up to 89% by 2100 under a high emissions scenario (RCP8.5), leading to cumulative release of tens to hundreds of billions of tons of carbon in the form of carbon dioxide and methane to the atmosphere by 2100.

The report fails to warn that, as the Arctic Ocean keeps heating up, huge seafloor methane eruptions could be triggered, and that this could happen within years, as discussed at the extinction page. Abrupt release of 10 Gt of methane would triple the amount of methane in the atmosphere, resulting in huge heating, while it would also trigger the clouds feedback tipping point to be crossed that in itself could push global temperatures up by 8°C within a few years, as earlier discussed in this post and this post.

Sea ice

The report notes that between 1979 and 2018, the areal proportion of multi-year Arctic sea ice at least five years old has declined by approximately 90%. The report refers to a study by Pistone that concludes that the additional heating due to complete Arctic sea ice loss would hasten global warming by an estimated 25 years. Below is a NASA video showing the melting away of the multi-year sea ice over the years.


The image below shows the difference in Arctic sea ice extent between the years, from an earlier post.


The report concludes that Antarctic sea ice extent overall has had no statistically significant trend. At the same time, the report notes that the Southern Ocean's share of the total heat gain in the upper 2000 m global ocean increased to 45–62% between 2005 and 2017. Below is an image illustrating the difference in Antarctic sea ice extent between the years.


The image below shows how much global sea ice extent has decreased over the past few years.

Sea ice decline makes that less sunlight gets reflected back into space and more heat gets absorbed by the ocean. The report also mentions latent heat changes and increased water vapor and increased cloudiness over the Arctic Ocean. Furthermore, as the temperature difference between the North Pole and the Equator narrows, the Jet Stream changes, which makes it more likely that a large influx of hot, salty water can enter the Arctic Ocean. While the IPCC acknowledges that permafrost thaw could release large amount of greenhouse gases, it fails to warn people about the potential for a huge, abrupt temperature rise as a result of the combined impact of warming elements, such as the one illustrated by the image below.


Meanwhile, the MetOp-1 satellite recorded a mean global methane level as high as 1914 parts per billion, on September 30, 2019, pm at 293 mb.


In the report launch press conference video below, IPCC authors respond to the question “May we have already passed the tipping point of abrupt and irreversible change and not knowing it yet?”


Valerie Masson-Delmotte, co-chair of WG1: “I would like to speak about irreversible change in this report. Irreversible means changes that will not be possible to be avoided on timescales of centuries, and climate change is already irreversible, due to the heat uptake in the ocean. We can't go back whatever we do with our emissions. Climate change is already irreversible.”

The situation is dire and calls for comprehensive and effective action, as described in the Climate Plan.


Links

• Climate Plan
https://arctic-news.blogspot.com/p/climateplan.html

• IPCC special report, The Ocean and Cryosphere in a Changing Climate
https://www.ipcc.ch/srocc/home

• Extinction
https://arctic-news.blogspot.com/p/extinction.html

• Most Important Message Ever
https://arctic-news.blogspot.com/2019/07/most-important-message-ever.html

• When Will We Die?
https://arctic-news.blogspot.com/2019/06/when-will-we-die.html

• Critical Tipping Point Crossed In July 2019
https://arctic-news.blogspot.com/2019/09/critical-tipping-point-crossed-in-july-2019.html

• Radiative Heating of an Ice‐Free Arctic Ocean, by Kristina Pistone et al.
https://agupubs.onlinelibrary.wiley.com/doi/abs/10.1029/2019GL082914

• Weekly Arctic Sea Ice Age with Graph of Ice Age By Area: 1984 - 2019, by NASA
https://svs.gsfc.nasa.gov/4750

• IPCC Report Climate Change and Land
https://arctic-news.blogspot.com/2019/08/ipcc-report-climate-change-and-land.html

• IPCC keeps feeding the addication
https://arctic-news.blogspot.com/2018/10/ipcc-keeps-feeding-the-addiction.html

• IPCC seeks to downplay global warming
https://arctic-news.blogspot.com/2018/02/ipcc-seeks-to-downplay-global-warming.html

• Just do NOT tell them the monster exists
https://arctic-news.blogspot.com/2013/10/just-do-not-tell-them-the-monster-exists.html


Saturday, September 14, 2019

Critical Tipping Point Crossed In July 2019


In July 2019, a critical tipping point was crossed. July sea surface temperatures on the Northern Hemisphere were 1.07°C above what they were during the 20th century, as illustrated by above image which has a trend added that points at 5°C above the 20th century by 2033.

Why is 1°C above 20th century's temperature such a critical tipping point for the sea surface on the Northern Hemisphere? Let's first take a look at where global heating is going.


Oceans are absorbing over 90% of global heating, as illustrated by above image. Due to the high greenhouse gas levels resulting from people's emissions, oceans keep on getting hotter, and given oceans' huge heat-absorbing capacity, it has taken many years before this tipping point was crossed.

In July 2016, the tipping point was touched at 0.99°C. In July 2017, the July temperature anomaly was on the tipping point, at exactly 1°C. In July 2018, the sea surface was a bit cooler, and the tipping point was crossed in July 2019 when the temperature anomaly was 1.07°C above the 20th century average.


Arctic sea ice used to absorb 0.8% of global heating (in 1993 to 2003). Ocean heat keeps flowing into the Arctic Ocean, carried by ocean currents, as illustrated by above image. As peak heat arrives in the Arctic Ocean, it melts sea ice from below.

The image below shows sea surface temperatures on August 13, 2019 (left) and on September 9, 2019 (right). The light blue line forms a line indicating the sea surface temperature there is 0°C. That light blue line has moved pole-ward in September, due to rivers that kept adding warm water and also due to more warmer water entering the Arctic Ocean from the Atlantic Ocean and the Pacific Ocean.


As above image also shows, the sea surface near Svalbard was 20.4°C (or 68.7°F) at the area marked by the green circle on August 13, 2019 (left), and 20.3°C (or 68.5°F) on September 9, 2019 (right), indicating how high the temperature of the water can be underneath the surface, as it moves into the Arctic Ocean. In other words, further ocean heat is still entering the Arctic Ocean.

From mid August 2019, ocean heat could no longer find any sea ice to melt, since the thick sea ice that hangs underneath the surface had already disappeared. A thin layer of sea ice at the surface was all that remained, as air temperatures didn't come down enough to melt it from above.


This indicates that the buffer has gone that has until now been consuming ocean heat as part of the melting process. As long as there is sea ice in the water, this sea ice will keep absorbing heat as it melts, so the temperature will not rise at the sea surface. The amount of energy absorbed by melting ice is as much as it takes to heat an equivalent mass of water from zero to 80°C.

The image below, created with NOAA 2007-2019 June-August sea surface temperature data, shows how extra heating of the sea surface on the Northern Hemisphere from 2012 caused the buffer to disappear and the 1°C tipping point to be crossed in 2019.


Once the buffer is gone, further heat arriving in the Arctic Ocean must go elsewhere.


The image below illustrates the difference in extent between the years, as recorded by ads.nipr.ac.jp. On September 13, 1980, Arctic sea ice extent was 7.77 million km². On September 17, 2019, Arctic sea ice extent was 3.96 million km². On September 16, 2012, extent was 3.18 million  million km².


Arctic sea ice will soon be growing in extent, sealing off the water, meaning that less ocean heat will be able to escape to the atmosphere.


This situation comes at a time that methane levels are very high globally. Mean global methane levels were as high as 1911 parts per billion on September 3, 2019, as discussed in a recent post. This post, as well as many earlier posts, also discussed the danger that ocean heat will reach sediments at the seafloor of the Arctic Ocean and cause huge methane releases.

Ominously, methane levels at Barrow, Alaska, were very high recently, as illustrated by above image showing methane levels peaking at over 2500 parts per billion. The satellite image below shows the global situation on the afternoon of September 13, 2019, when peak methane levels as high as 2605 ppb were recorded by the MetOp-1 satellite at 586 mb.


In the videos below, Paul Beckwith discusses the situation.


The situation is dire and calls for comprehensive and effective action, as described in the Climate Plan.


Links

• Climate Plan
https://arctic-news.blogspot.com/p/climateplan.html

• Arctic Sea Ice Gone By September 2019?
https://arctic-news.blogspot.com/2019/07/arctic-sea-ice-gone-by-september-2019.html

• July 2019 Hottest Month On Record
https://arctic-news.blogspot.com/2019/08/july-2019-hottest-month-on-record.html

• Cyclone over Arctic Ocean - August 24, 2019
https://arctic-news.blogspot.com/2019/08/cyclone-over-arctic-ocean-august-24-2019.html

• Most Important Message Ever
https://arctic-news.blogspot.com/2019/07/most-important-message-ever.html

• Arctic Ocean overheating
https://arctic-news.blogspot.com/2019/09/arctic-ocean-overheating.html


Sunday, September 8, 2019

Arctic Ocean overheating


The Arctic Ocean is overheating, as illustrated by above image.
[ from earlier post ]

Heating of the water in the Arctic Ocean is accelerating, as illustrated by above map that uses 4-year smoothing and that shows temperatures in the Arctic that are up to 4.41°C hotter than the average global temperature during 1880-1920.

The NOAA image on the right shows the sea surface temperature difference from 1961-1990 in the Arctic at latitudes 60°N - 90°N on September 7, 2019.

Where Arctic sea ice disappears, hot water emerges on the image, indicating that the temperature of the ocean underneath the sea ice is several degrees above freezing point.

The nullschool.net image on the right shows sea surface temperature differences from 1981-2011 on the Northern Hemisphere on September 8, 2019, with anomalies reaching as high as 15.2°C or 27.4°F (near Svalbard, at the green circle).

Accelerating heating of the Arctic Ocean could make global temperatures skyrocket in a matter of years.

Decline of the sea ice comes with albedo changes and further feedbacks, such as the narrowing temperature difference between the North Pole and the Equator, which slows down the speed at which the jet stream circumnavigates Earth and makes the jet stream more wavy.


Disappearance of the sea ice also comes with loss of the buffer that has until now been consuming ocean heat as part of the melting process. As long as there is sea ice in the water, this sea ice will keep absorbing heat as it melts, so the temperature will not rise at the sea surface. The amount of energy absorbed by melting ice is as much as it takes to heat an equivalent mass of water from zero to 80°C. Once the sea ice is gone, further heat must go elsewhere.

[ click on images to enlarge ]
The Naval Research Laboratory image on the right shows a forecast for Sep. 8, 2019, run on Sep. 7, 2019, of the thickness of the sea ice. Sea ice has become terribly thin, indicating that the heat buffer constituted by the sea ice has effectively gone. Only a very thin layer of sea ice remains in place throughout much of the Arctic Ocean.

This remaining sea ice is stopping a lot of ocean heat from getting transferred to the air, so the temperature of the water of the Arctic Ocean is now rising rapidly, with the danger that some of the accumulating ocean heat will reach sediments at the seafloor and cause eruptions of huge amounts of methane.


This situation comes at a time that methane levels are very high globally. Mean global methane levels were as high as 1911 parts per billion on the morning of September 3, 2019, a level recorded by the MetOp-1 satellite at 293 mb (image below).


[ from an earlier post ]
As the image on the right shows, mean global levels of methane (CH₄) have risen much faster than carbon dioxide (CO₂) and nitrous oxide (N₂O), in 2017 reaching, respectively, 257%, 146% and 122% their 1750 levels.

Compared to carbon dioxide, methane is some 150 times as potent as a greenhouse gas during the first few years after release.

Huge releases of seafloor methane alone could make marine stratus clouds disappear, as described in an earlier post, and this clouds feedback could cause a further 8°C global temperature rise.

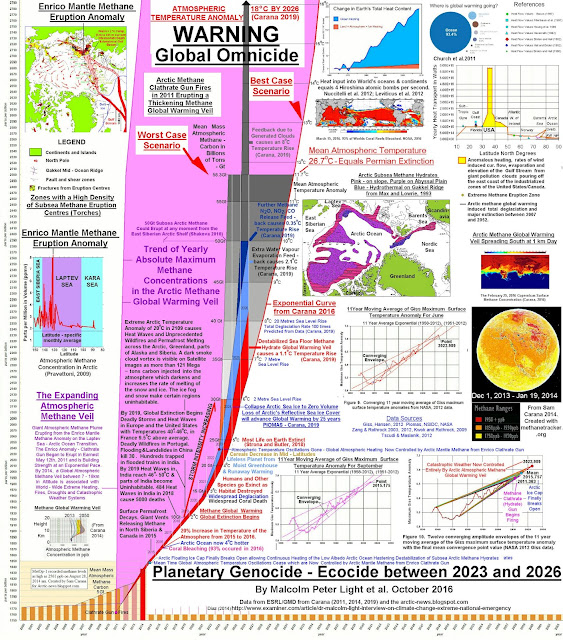
In total, global heating by as much as 18°C could occur by the year 2026 due to a combination of elements, including albedo changes, loss of sulfate cooling, and methane released from the ocean seafloor.

from an earlier post (2014)  

In the image below, from an earlier post, a global warming potential (GWP) of 150 for methane is used. Just the existing carbon dioxide and methane, plus seafloor methane releases, would suffice to trigger the clouds feedback tipping point to be crossed that by itself could push up global temperatures by 8°C, within a few years time, adding up to a total rise of 18°C by 2026.


Progression of heating could unfold as pictured below.

[ from an earlier post ]

In the video below, John Doyle describes out predicament.


The situation is dire and calls for comprehensive and effective action, as described in the Climate Plan.


Links

• Climate Plan
https://arctic-news.blogspot.com/p/climateplan.html

• Arctic Sea Ice Gone By September 2019?
https://arctic-news.blogspot.com/2019/07/arctic-sea-ice-gone-by-september-2019.html

• July 2019 Hottest Month On Record
https://arctic-news.blogspot.com/2019/08/july-2019-hottest-month-on-record.html

• Cyclone over Arctic Ocean - August 24, 2019
https://arctic-news.blogspot.com/2019/08/cyclone-over-arctic-ocean-august-24-2019.html

• Most Important Message Ever
https://arctic-news.blogspot.com/2019/07/most-important-message-ever.html


Tuesday, July 30, 2019

Arctic Sea Ice Gone By September 2019?

Record low Arctic sea ice extent for the time of year


Arctic sea ice minimum extent typically occurs about half September. In 2012, minimum extent was reached on September 17, 2012, when extent was 3.387 million km².

On July 28, 2019, Arctic sea ice extent was 6.576 million km². How much extent do you think there will be by September 17, 2019? From July 28, 2019, to September 17, 2019, that's a period of 52 days during which a lot of melting can occur. Could there be a Blue Ocean Event in 2019, with virtually all sea ice disappearing in the Arctic?

Consider this. Extent was 6.926 million km² on September 17, 1989. Extent was 3.387 million km² on September 17, 2012, so 3.539 million km² had disappeared in 23 years. Over those years, more ice extent disappeared than what was left on September 17, 2012.

The question is how much sea ice extent will be left when it will reach its minimum this year, i.e. in September 2019. The red dashed line on the image at the top continues the path of the recent fall in sea ice extent, pointing at zero Arctic sea ice extent in September 2019. Progress is followed at this post.

Zero Arctic sea ice in 2019

Zero Arctic sea ice in 2019 sounds alarming, and there is good reason to be alarmed.


Above map shows temperatures on Greenland on July 31, 2019, with temperatures at one location as high as 23.2°C or 73.8°F and at another location - in the north - as high as 14.2°C or 57.6°F.

The map on the right shows sea surface temperature anomalies compared to 1961-1990 as on July 29, 2019. Note the high anomalies in the areas where the sea ice did disappear during the past few months. The reason for these high anomalies is that the buffer has disappeared that previously had kept consuming heat in the process of melting.

Where that buffer is gone, the heat has to go somewhere else, so it will be absorbed by the water and it will also speed up heating of the atmosphere over the Arctic.

Sea ice melting is accelerating for a number of reasons:
  • Ocean Heat - Much of the melting of the sea ice occurs from below and is caused by heat arriving in the Arctic Ocean from the Atlantic Ocean and the Pacific Ocean. 
  • Direct Sunlight - Hot air will melt the ice from above and this kind of melting can increase strongly due to changing wind patterns. 
  • Rivers - Heatwaves over land can extend over the Arctic Ocean and they also heat up river water flowing into the Arctic Ocean.
  • Fires - Changing wind patterns can also increase the intensity and duration of such heatwaves that can also come with fires resulting in huge amounts of greenhouse gas emissions, thus further speeding up the temperature rise, and also resulting in huge emissions of soot that, when settling on sea ice, speeds up melting (see images below). 
  • Numerous feedbacks will further speed up melting. Heating is changing the texture of the sea ice at the top and is making melt pools appear, both of which cause darkening of the surface. Some further feedbacks, i.e. storms and clouds are discussed below in more detail. 

Above combination image shows smoke from fires in Siberia getting pushed over the Laptev Sea on August 11, 2019, due to cyclonic winds over the Arctic Ocean. This was also discussed in an earlier post. The image below shows the situation on August 12, 2019.


The image below shows the situation on August 14, 2019.


In the video below, Paul Beckwith discusses the situation.


In the video below, Paul Beckwith discusses the heating impact of albedo loss due to Arctic sea ice loss, including the calculations in a recent paper.


As the Arctic is heating up faster than the rest of the world, it is also more strongly affected by the resulting extreme weather events, such as heatwaves, fires, strong winds, rain and hail storms, and such events can strongly speed up the melting of the sea ice.


All around Greenland, sea ice has now virtually disappeared. This is the more alarming considering that the thickest sea ice was once located north of Greenland. This indicates that the buffer is almost gone.

Why is disappearance of Arctic sea ice so important? Hand in hand with albedo loss as the sea ice disappears, there is loss of the buffer (feedbacks #1, #14 and more). As long as there is sea ice in the water, this sea ice will keep absorbing heat as it melts, so the temperature will not rise at the sea surface. The amount of energy absorbed by melting ice is as much as it takes to heat an equivalent mass of water from zero to 80°C.


Once the sea ice is gone, further heat must go elsewhere. This heat will raise the temperature of the water and will also make the atmosphere heat up faster.

Storms and Clouds

Storms: As temperatures in the Arctic are rising faster than at the Equator, the Jet Stream is changing, making it easier for warm air to enter the Arctic and for cold air to descend over continents that can thus become much colder than the oceans, and this stronger temperature difference fuels storms.

Clouds: More evaporation will occur as the sea ice disappears, thus further heating up the atmosphere (technically know as latent heat of vaporization).

In the video below, Paul Beckwith further discusses Arctic albedo change and clouds.


Disappearance of the sea ice causes more clouds to form over the Arctic. This on the one hand makes that more sunlight gets reflected back into space. On the other hand, this also make that less outward infrared radiation can escape into space. The net effect of more clouds is that they are likely cause further heating of the air over the Arctic Ocean (feedbacks #23 and #25).

More low-altitude clouds will reflect more sunlight back into space, and this occurs most during Summer when there is most sunshine over the Arctic. The image below, a forecast for August 17, 2019, shows rain over the Arctic. Indeed, more clouds in Summer can also mean rain, which can devastate sea ice, as discussed in an earlier post.


Regarding less outward radiation, the IPCC has long warned, e.g. in TAR, about a reduction in outgoing longwave radiation (OLR): "An increase in water vapour reduces the OLR only if it occurs at an altitude where the temperature is lower than the ground temperature, and the impact grows sharply as the temperature difference increases."

While reduction in OLR due to water vapor is occurring all year long, the impact is particularly felt in the Arctic in Winter when the air is much colder than the surface. In other words, less OLR makes Arctic sea ice thinner, especially in Winter.

The inflow of ocean heat into the Arctic Ocean can increase strongly as winds increase in intensity. Storms can push huge amounts of hot, salty water into the Arctic Ocean, as discussed earlier, such as in this post and this post. As also described at the extreme weather page, stronger storms in Winter will push more ocean heat from the Atlantic toward the Arctic Ocean, further contributing to Arctic sea ice thinning in Winter.

Seafloor Methane


[ The Buffer has gone, feedbacks #14 and #16 ]

As the buffer disappears that until now has consumed huge amounts of heat, the temperature of the water of the Arctic Ocean will rise even more rapidly, with the danger that further heat will reach methane hydrates at the seafloor of the Arctic Ocean, causing them to get destabilized and release huge amounts of methane (feedback #16).

Ominously, high methane levels were recorded at Barrow, Alaska, at the end of July 2019, as above image shows.


[ from an earlier post ]
And ominously, a mean global methane level as high as 1902 ppb was recorded by the MetOp-1 satellite in the afternoon of July 31, 2019, as above image shows.

As the image on the right shows, mean global levels of methane (CH₄) have risen much faster than carbon dioxide (CO₂) and nitrous oxide (N₂O), in 2017 reaching, respectively, 257%, 146% and 122% their 1750 levels.

Temperature Rise

Huge releases of seafloor methane alone could make marine stratus clouds disappear, as described in an earlier post, and this clouds feedback could cause a further 8°C global temperature rise.

Indeed, a rapid temperature rise of as much as 18°C could result by the year 2026 due to a combination of elements, including albedo changes, loss of sulfate cooling, and methane released from destabilizing hydrates contained in sediments at the seafloor of oceans.

[ from an earlier post ]

Below is Malcolm Light's updated Extinction Diagram.

[ click on images to enlarge ]
The situation is dire and calls for comprehensive and effective action, as described in the Climate Plan.


Link

• Climate Plan
https://arctic-news.blogspot.com/p/climateplan.html

• Smoke Covers Much Of Siberia
https://arctic-news.blogspot.com/2019/07/smoke-covers-much-of-siberia.html

• Extreme Weather
https://arctic-news.blogspot.com/p/extreme-weather.html

• Albedo and more
https://arctic-news.blogspot.com/p/albedo.html

• Radiative Heating of an Ice‐Free Arctic Ocean, by Kristina Pistone et al. (2019)
https://agupubs.onlinelibrary.wiley.com/doi/10.1029/2019GL082914

• High cloud coverage over melted areas dominates the impact of clouds on the albedo feedback in the Arctic, by Min He et al. (2019)
https://www.nature.com/articles/s41598-019-44155-w

• ESD Reviews: Climate feedbacks in the Earth system and prospects for their evaluation, by Christoph Heinze et al. (2019)
https://www.earth-syst-dynam.net/10/379/2019/esd-10-379-2019-discussion.html

• Contribution of sea ice albedo and insulation effects to Arctic amplification in the EC-Earth Pliocene simulation, by Jianqiu Zheng et al. (2019)
https://www.clim-past.net/15/291/2019

• Far-infrared surface emissivity and climate, by Daniel Feldman et al. (2014)
https://www.pnas.org/content/111/46/16297.abstract

• Extreme Weather
https://arctic-news.blogspot.com/p/extreme-weather.html

• Feedbacks in the Arctic
https://arctic-news.blogspot.com/p/feedbacks.html

• Rain Storms Devastate Arctic Ice And Glaciers
https://arctic-news.blogspot.com/2015/01/rain-storms-devastate-arctic-ice-and-glaciers.html

• A rise of 18°C or 32.4°F by 2026?
https://arctic-news.blogspot.com/2019/02/a-rise-of-18c-or-324f-by-2026.html
• As El Niño sets in, will global biodiversity collapse in 2019?
https://arctic-news.blogspot.com/2018/11/as-el-nino-sets-in-will-global-biodiversity-collapse-in-2019.html

• Dangerous situation in Arctic
https://arctic-news.blogspot.com/2018/11/dangerous-situation-in-arctic.html

• Warning of mass extinction of species, including humans, within one decade
https://arctic-news.blogspot.com/2017/02/warning-of-mass-extinction-of-species-including-humans-within-one-decade.html


Thursday, July 25, 2019

Smoke Covers Much Of Siberia

Smoke covers much of Siberia, as shown by the NASA Worldview image dated July 25, 2019.


The enormous intensity of the fires is illustrated by the image below, showing carbon monoxide (CO) levels as high as 80,665 ppb on July 25, 2019.


The image below shows that, at that same spot on July 25, 2019, carbon dioxide (CO₂) levels were as high as 1205 ppm.


The image below shows that aerosols from biomass burning were at the top end of the scale.


When soot from fires settles on snow and ice, it darkens the surface, resulting in more sunlight getting absorbed (instead of reflected back into space, as was previously the case), thus further speeding up the melting.

The loss of sea ice north of Greenland is particularly worrying, since this is the area where once the thickest sea ice was present. The image below shows the situation on July 24, 2019.


The image below shows the sea ice disappearing north of Greenland and Ellesmere Island on July 25, 2019.


The huge recent fall in sea ice volume is illustrated by the graph below, by Wipneus.


The naval.mil animation below illustrates the rapid fall in sea ice thickness, showing 30-day period including seven forecasts up to August 1, 2019.


The combination image below shows sea ice thickness forecasts for July 25, 2019, and for August 1, 2019.


The video below, by Robin Westenra, further illustrates our predicament.


The situation is dire and calls for comprehensive and effective action, as described in the Climate Plan.


Links


• Climate Plan
https://arctic-news.blogspot.com/p/climateplan.html