On April 20, 2023, sea surface temperatures (between 60°South and 60°North) had been at 21°C or higher for as many as 32 days. Such temperatures are unprecedented in the NOAA record that goes back to 1981.
On April 4, the sea surface temperature in 2023 (black line) was as much as 0.3°C higher than in 2022 (orange line) and we're only just entering the upcoming El Niño.
SST North Atlantic
The situation is especially critical in the North Atlantic. Vast amounts of ocean heat in the North Atlantic are moving toward the Arctic, threatening to cause rapid melting of Arctic sea ice and thawing of permafrost. Last year, North Atlantic sea surface temperatures reached a record high of 24.9°C in early September and, as illustrated by the image below, the North Atlantic sea surface temperature on April 20 was as much as 0.5°C higher in 2023 (black) than in 2022 (orange).
As we're moving into the upcoming El Niño, the Arctic Ocean can be expected to receive more and more heat over the next few years, i.e. more heat from direct sunlight, more heat from rivers, more heat from heatwaves and more ocean heat from the Atlantic Ocean and the Pacific Ocean.
Temperature rise
As illustrated by the image below, the difference in global temperatures (Land+Ocean) between November 2022 and March 2023 is already about half a degree Celsius and we are not even in an El Niño yet.
Rising temperatures threaten to trigger massive loss of sea ice (and loss of albedo) and eruptions of methane from the seafloor of the Arctic Ocean. Over the next few years, feedbacks threaten to start kicking in with increased ferocity and important tipping points threaten to get crossed, such as the latent heat tipping point and the seafloor methane tipping point.
El Niño can be expected to reach its full strength within a few years, with a maximum possible in 2026. Altogether, the rise from pre-industrial could be more than 18.44°C by 2026. Meanwhile, humans are likely to go extinct with a rise of 3°C and most life on Earth will disappear with a 5°C rise.
Above image depicts how humans could go extinct within years. The image was created with NASA LOTI 1880-Dec.2019 data, 0.78°C adjusted to reflect ocean air temperatures (as opposed to sea surface temperatures), to reflect higher polar temperature anomalies (as opposed to leaving out 'missing' data) and to reflect a 1750 baseline (as opposed to a 1951-1980 baseline), with two trends added. Blue: a long-term trend based on Jan.1880-Dec.2019 data. Red: a short-term trend, based on Jan.2009-Dec.2019 data, to illustrate El Niño/La Niña variability and how El Niño could be the catalyst to trigger huge methane releases from the Arctic Ocean. This updates an earlier post with more detail on how the image was created.
The image below shows El Niño/La Niña variability going back to 1950, added to the NOAA monthly temperature anomaly.
Ocean heat is increasing rapidly, especially on the Northern Hemisphere, as illustrated by the NOAA image below, showing the rise from 1980 through 2019.
The image underneath uses the same data and has a trend added pointing at a 1.5°C anomaly from the 20th century average by the year 2026.
As discussed in an earlier point, there is a tipping point at 1°C above the 20th century average, i.e. there are indications that a rise of 1°C will result in most of the sea ice underneath the surface to disappear. This sea ice used to consume the inflow of warm, salty water from the Atlantic Ocean and the Pacific Ocean. So, while there may still be sea ice left at the surface, the latent heat buffer will be gone.
[ click on images to enlarge ]
Loss of the latent heat buffer speeds up heating of the Arctic Ocean, with the danger that huge amounts of methane will be released from the seafloor. The image below illustrates the danger, showing that peak methane levels as high as 2670 parts per billion (ppb) were recorded by the MetOp-1 satellite on January 2, 2020 pm at 469 mb.
Most worryingly, above image shows a large almost-solidly magenta-colored area blanketing the East Siberian Arctic Shelf (ESAS), with magenta indicating levels above 1950 ppb. Such satellite measurements indicate that large amounts of methane are erupting from the seafloor of the Arctic Ocean.
Above image shows that, a few years ago, methane was accumulating most strongly at an altitude corresponding to a pressure of some 400 mb. More recently, methane has been accumulating most strongly at higher altitudes, corresponding to a pressure of just under 300 mb, which is the upper limit of the troposphere over the North Pole. Methane tends to follow the Tropopause, i.e. at higher altitudes methane will be present in higher concentrations closer to the Equator, where the troposphere extends further into space, as discussed in an earlier post.
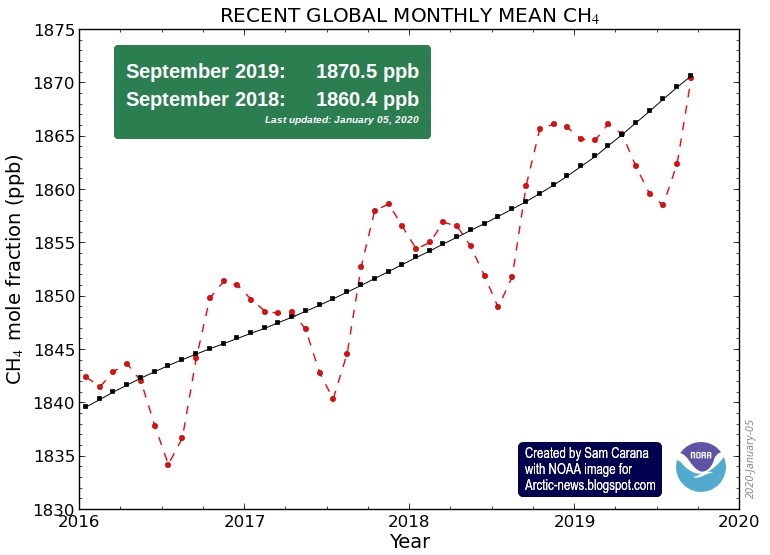
The NOAA graph below indicates that methane levels are growing at over 10 parts per billion per year, and this may actually underestimate global methane concentrations. The graph uses land-based measurements taken at sea level that can miss methane rising from the seafloor, especially from the seafloor of the Arctic Ocean, since there are few measuring stations in the Arctic in the first place. Land-based measurements can additionally overlook methane that is moving along the Tropopause from the Arctic toward the Equator.
Ominously, the image below shows high methane levels at Barrow, Alaska, at the end of January 2020.
Rising CO₂ levels are also worrying. A daily average CO₂ level of 415.79 ppm was recorded by NOAA at Mauna Loa, Hawaii, on January 21, 2020, a level that is unprecedented for millions of years. Since an annual peak is typically reached in May, we can expect even higher levels over the coming months.
It's not just at Mauna Loa that such high CO₂ readings were recorded recently. The image below shows CO₂ levels recorded recent;y at Barrow, Alaska.
Fires in Australia have contributed to these high CO₂ levels. The image below shows smoke plumes from fires in Australia on January 4, 2020.
Such fires can generate huge amounts of smoke, with smoke rising up high in the atmosphere and entering the stratosphere, while circumnavigating Earth. The ferocity of these fires is also shown in the NASA video below.
In the video below, Guy McPherson gives examples of species that went extinct rapidly.
Meanwhile, the Bulletin of the Atomic Scientists has moved the Doomsday Clock closer to Midnight, to 100 seconds to Midnight, adding that Civilization-ending nuclear war—whether started by design, blunder, or simple miscommunication—is a genuine possibility. Climate change that could devastate the planet is undeniably happening. And for a variety of reasons that include a corrupted and manipulated media environment, democratic governments and other institutions that should be working to address these threats have failed to rise to the challenge. Faced with a daunting threat landscape and a new willingness of political leaders to reject the negotiations and institutions that can protect civilization over the long term, the Bulletin of the Atomic Scientists Science and Security Board moved the Doomsday Clock 20 seconds closer to midnight—closer to apocalypse than ever.
The image below, created with thebulletin.org content and data from 1991 to 2020, has a linear trend added that points at Midnight by 2022.
The situation is dire and calls for immediate, comprehensive and effective action, as described in the Climate Plan.
The July 2019 temperature was on a par with, and possibly marginally higher than, that of July 2016, according to a World Meteorological Organization (WMO) news release pointing an image by the Copernicus Climate Change Programme that is used as the background for above image.
Previously, July 2016 was the hottest July on record with a global land and ocean temperature of 16.67°C (62.01°F), or 3.25°C above the pre-industrial temperature of 13.42°C (56.16°F) and surpassing the record set before that, in July 2015.
The July 2019 Surface Temperature was 16.7°C in real temperatures (as opposed to anomalies), as illustrated by the image on the right, supplied by James Hansen and constructed using Dr. Phil Jones climatology and GISS 250 km smoothing of anomalies.
The image also shows, James Hansen adds, that the monthly mean of the daily mean (not daily maximum) exceeded 35°C (95°F) in parts of North Africa and the Middle East.
The month July typically is the hottest month of the year. July 2019 was 2.34°C (or 4.21°F) hotter than the 1980-2015 annual global mean, and July 2019 was the hottest July on record, making it the hottest month on record to date.
According to NASA data, July 2016 was 2.26°C hotter than the 1980-2015 annual global mean, and August 2016 was actually the previously hottest month on record with 2.31°C above the 1980-2015 annual mean, so August 2019 could be even hotter, which is quite remarkable given that we're currently in an El Niño-neutral period.
There's a spread of more than 3°C between the coldest and hottest monthly temperatures, in line with the seasonal cycle. Since the land/sea ratio is larger on the Northern Hemisphere and land heats up faster than oceans, July typically is the hottest month of the year, so the annual mean temperature for the year 2019 will be somewhat lower than the temperature for July 2019.
Above image takes another perspective, showing NASA Land and Ocean Temperature Index (LOTI) data that are adjusted 0.78° to reflect a 1750 baseline (as opposed to NASA's default 1951-1980 baseline), to reflect ocean air temperatures (as opposed to sea surface temperatures) and higher polar anomaly (to better reflect absent data).
Two trends are added, based on the adjusted data, as described in an earlier analysis. The blue long-term trend is based on 1880-July 2019 data and points at a 3°C (or 5.4°F) rise by 2026. The red short-term trend is based on 2012-July 2019 data, to better illustrate El Niño/La Niña variability and the danger that large methane eruptions from the seafloor of the Arctic Ocean could result in near-term human extinction.
NASA's LOTI anomaly of 0.93°C above 1951-1980 for July 2019 becomes 1.71°C above pre-industrial when adjusted as described above. The trends also show that it could be 1.85°C above pre-industrial, in line with the earlier analysis that already pointed at a potential mean temperature for 2019 of 15.27°C, or 1.85°C above pre-industrial. Depending on what will happen in the Arctic and on further variables such as the strength of El Niño over the remainder of the year, 2019 could even cross the 2°C guardrail that politicians at the Paris Agreement pledged would not be crossed.
Above image shows the worrying rise of Northern Hemisphere sea surface temperature anomalies from the 20th century average, with the added trend illustrating the danger that this rise will lead to Arctic sea ice collapse and large methane eruptions from the seafloor of the Arctic Ocean, further accelerating the temperature rise.
Unbearable heat
As temperatures keep rising, there are places on the northern hemisphere where the July heat is becoming ever harder to bear.
The image on the right shows that on July 29, 2019, it felt like it was as hot as 57.2°C or 135°F in China (in the area marked by the green circle).
How could it get this hot? As the image underneath on the right shows, the temperature in that area was 35.1°C or 95.1°F (at the right circle), while it was much hotter at some places elsewhere in China, e.g. it was 41.5°C or 106.6°F at the left circle on July 29, 2019.
What made the weather so hard to bear was a combination of high temperature and high relative humidity, which was 81% in the area at the circle on the right at the time.
The jet stream is becoming ever more deformed as the Arctic heats up faster than the rest of the world. On July 29, 2019, the jet stream was all over the place, with a strong presence north of the circle, which made warm, moist air from the south move over China.
Since the Arctic continues to heat up faster than the rest of the world, such situations are likely to become more common. As noted in an earlier post, cyclones can increase humidity, making conditions worse. New research has meanwhile emerged pointing at the increasing risk associated with the combination of cyclones and heatwaves.
Wet Bulb Temperature
The temperature in that area of 35.1°C, at 81% relative humidity and a pressure level of 1004 hPa, translates into a wet bulb temperature of 32.11°C.
Had the temperature remained at 35.1°C, but had relative humidity kept rising to 100%, i.e. rainfall, the wet bulb temperature threshold of 35°C would have been exceeded (35.01°C). Alternatively, had relative humidity remained at 81%, but had the temperature kept rising to 38.2°C, the wet bulb temperature threshold of 35°C would equally have been exceeded (35.07°C), showing how dangerous the situation is. A wet bulb temperature of 35°C can be lethal, as the human body will be unable to lose heat, even when the wind is strong and no matter how much one drinks or sweats.
The situation is dire and calls for comprehensive and effective action, as described in the Climate Plan.
Fires are raging over Alaska. The satellite image below shows the situation on July 8, 2019.
The satellite image below shows the situation on July 9, 2019.
The image below shows carbon monoxide levels as high as 43,443 ppb over Alaska on July 8, 2019.
Carbon dioxide levels were as high as 561 ppm over that same spot in Alaska on July 8, 2019. Carbon dioxide levels were as high as 888 ppm on July 10, 2019, as the image below shows.
The image below shows a forecast for July 10, 2019, with temperatures forecast to be as high as 35.5°C or 95.8°F.
The Arctic has been heating up faster than the rest of the world, due to self-reinforcing feedback loops such as the decline of the snow and ice cover in the Arctic, which results in less sunlight getting reflected back into space and more sunlight instead getting absorbed in the Arctic.
As the image on the right shows, sea surface temperatures in the Bering Sea were as high as 19.8°C or 67.64°F on June 21, 2019.
As the image underneath shows, sea surface temperatures in the Bering Sea were as high as 21.6°C or 70.88°F on July 15, 2019.
Warm water from rivers flowing into the Bering Strait have contributed to some of the high temperatures of the water near the coast of Alaska.
Furthermore, as the June 21, 2019, image below shows, sea surface temperature anomalies have also been high around Alaska further away from the coast.
Indeed, more than 90% of the extra energy caused by humans goes into oceans, and sea currents carry a lot of this extra heat toward the Arctic Ocean.
As a result, ocean temperatures have been high for some time around Alaska.
The image below shows sea surface temperature anomalies around Alaska on June 21, 2019.
Another feedback is that, as the Arctic heats up faster than the rest of the world, the jet stream becomes more wavy, making it easier for cold air to flow out of the Arctic to the south and for warm air from the south to enter the Arctic. These changes to the jet stream also cause stronger storms to occur in the Arctic and more water vapor to enter the atmosphere. All this further contributes to more heating to occur in the Arctic and more extreme weather events.
Heatwaves also cause more forest fires to occur in Alaska, and these forest fires are causing large amounts of soot to get deposited on mountains and on sea ice, thus further blackening the surface. More generally, the Arctic is getting more deposits of soot and dust, as well as stronger growth of algae, moss and microbes, all further speeding up the demise of the snow and ice cover in the Arctic.
The image below shows sea surface temperature anomalies around Alaska on July 11, 2019, with an anomaly of 7.7°C or 13.8°F compared to 1981-2011 showing up north of Alaska in the Arctic Ocean. The light blue areas indicate sea surface that is colder, due to heavy melting of the sea ice in those areas.
The image below shows a deformed jet stream (forecast for July 9, 2019) that enables hot air from the south to move over Alaska.
Heatwaves and forest fires are symptoms of the rapid heating that is taking place in the Arctic. Self-reinforcing feedback loops further accelerate heating in the Arctic and just one of them, seafloor methane, threatens to cause runaway heating.
Just the existing carbon dioxide and methane, plus seafloor methane releases, would suffice to trigger the clouds feedback tipping point to be crossed that by itself could push up global temperatures by 8°C, within a matter of years, as the image below shows.
As described on above image and in an earlier post, huge amounts of methane could be released from destabilizing hydrates contained in sediments at the seafloor of the Arctic Ocean. Such releases could be triggered by strong winds causing an influx of warm, salty water into the Arctic ocean, as described in an earlier post and discussed in the 2017 video below.
The image on the right shows sea surface temperatures on July 6 for the years 2014 to 2018 at a location near Svalbard (at 77.958°N, 5.545°E), with an exponential trend added based on the data.
The combination image below shows sea surface temperatures on July 6 for each of these years, with the location highlighted by a green circle:
2014: -0.8°C or 30.6°F
2015: 6.2°C or 43.2°F
2016: 8.3°C or 47.0°F
2017: 14.4°C or 57.9°F
2018: 16.6°C or 61.9°F
The situation reflects the rapid decline of Arctic sea ice over the years and constitutes a stark warning of imminent sea ice collapse and its consequences for the world at large.
[ click on images to enlarge ]
The image on the right shows the sea surface temperature on July 18, 2018, at that location. It was as warm as 17.2°C or 63°F near Svalbard. This compares to a sea surface temperature of 5°C or 41.1°F in 1981-2011 at that location (at the green circle). For more background on the warm water near Svalbard, also see the earlier post Accelerating Warming of the Arctic Ocean.
The images illustrate why sea ice has fallen dramatically in volume, especially so where sea currents push warm water from the Atlantic Ocean underneath the sea ice.
The decline of Arctic sea ice volume over the years is illustrated by the Jim Pettit graph below.
As the Wipneus image below shows, Arctic sea ice volume on July 9, 2018, was at a record low for the time of the year.
The animation on the right shows a fall in volume of some 1 meter over most of the sea ice, over the period from June 21 through July 12, 2018, with a further eight days of forecasts added.
The animation illustrates the huge amount of melting taking place from underneath, due to an inflow of heat from the Atlantic Ocean and the Pacific Ocean, and from warm water from rivers that end in the Arctic Ocean. Meanwhile, sea ice extent doesn't fall very much at all.
When only looking at sea ice extent, the dramatic fall in sea ice volume may be overlooked.
Complete disappearance of Arctic sea ice in September 2018 is within the margins of a trend based on yearly annual minimum volume, as illustrated by the image on the right.
Latent heat can make such disappearance come abruptly and - for people who only look at changes in extent - rather unexpectedly.
Latent heat is energy associated with a phase change, such as the energy absorbed by solid ice when it changes into water (melting). During a phase change, the temperature remains constant.
Sea ice acts as a buffer that absorbs heat, while keeping the temperature at zero degrees Celsius. As long as there is sea ice in the water, this sea ice will keep absorbing heat, so the temperature doesn't rise at the sea surface.
The amount of energy absorbed by melting ice is as much as it takes to heat an equivalent mass of water from zero to 80°C.
Oceans take up over 90% of global warming, as illustrated by the image below. Ocean currents make that huge amounts of this heat keep entering the Arctic Ocean from the Pacific Ocean and the Atlantic Ocean.
Once the sea ice is gone, further ocean heat must go elsewhere, i.e. it will typically raise the temperature of the water. The atmosphere will also warm up faster. More evaporation will also occur once the sea ice is gone, which will cool the sea surface and warm up the atmosphere (technically know as latent heat of vaporization).
As temperatures in the Arctic are rising faster than at the Equator, the Jet Stream will change, making it easier for warm air to enter the Arctic. More clouds will form over the Arctic, which will reflect more sunlight into space, but which will also make that less outward IR radiation can escape into space over the Arctic, with a net warming effect.
Meanwhile, El Niño is getting stronger, as illustrated by above image on the right. A warmer Arctic comes with stronger heat waves, forest fires and associated emissions, and rapid warming of water in rivers that end in the Arctic Ocean, all of which will further warm up the Arctic Ocean. Forest fires have already been burning strongly in Siberia over the past few months and methane recently reached levels as high as 2817 ppb (on July 8, 2018, pm).
One huge danger is that, as the buffer disappears that until now has consumed huge amounts of ocean heat, and the Arctic Ocean keeps warming, further heat will reach methane hydrates at the seafloor of the Arctic Ocean, causing them to get destabilized and release methane.
[ The Buffer has gone, feedback #14 on the Feedbacks page ]
Additionally, disappearance of the sea ice will come with albedo changes that mean that a lot more sunlight will be absorbed, instead of getting reflected back into space as occurred previously.
Similar albedo changes are likely to take place over land in the Arctic soon thereafter. Adding up all warming elements associated with disappearance of the sea ice can result in an additional global warming of several degrees Celsius.
The situation is dire and calls for comprehensive and effective action, as described in the Climate Plan.